In this article, data-dependent acquisition (DDA) experimental data collected by the ZenoTOF 8600 system was analyzed with MS-DIAL 5.5 software to detect and classify lipid molecular species in human plasma samples. These findings were compared to identical studies carried out on the ZenoTOF 7600 system.
Untargeted lipidomics processes, such as DDA, aim to identify as many lipids in a sample as feasible. The lipidome's coverage reflects the method design and analytical power of the mass spectrometer used to collect data.
The most important factor influencing coverage is instrument sensitivity, which allows for identifying low-level analytes.
Collision-induced dissociation (CID) is the standard fragmentation mode for lipidomics investigations; however, electron-activated dissociation (EAD) can yield additional diagnostic fragments to help identify lipids.
The data demonstrates that the ZenoTOF 8600 system is around ten times more sensitive than a previous-generation high-resolution mass spectrometer, the ZenoTOF 7600 system.
Using the ZenoTOF 8600 system, CID-based DDA lipidomics experiments (positive ion mode) using reversed-phase chromatography (RP) produced around 1.8-fold more identified lipids. In contrast, EAD-based DDA experiments produced a 2.4-fold increase (Figure 1).
The increased coverage may uncover new analytes relevant to biological studies and help us understand the probable pathophysiology of human disease through biomarker analysis.
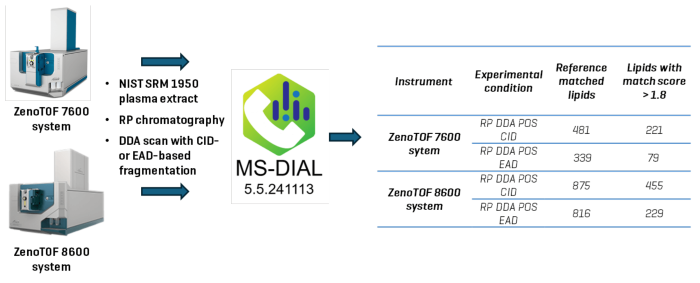
Figure 1. A comparative study to evaluate the identification of lipids using untargeted lipidomics analysis. Lipid extracts were prepared from NIST SRM 1950 human plasma, and a 0.5 µl plasma equivalent was analyzed on the ZenoTOF 7600 or 8600 system using CID-based fragmentation. A reversed-phase chromatographic strategy was used to resolve lipids, and they were analyzed in the positive ionization mode. Data were processed using MS-DIAL 5.5 software to identify reference-matched lipids. Data acquired on the ZenoTOF 8600 system enabled the identification of ~1.8-fold more lipids than the ZenoTOF 7600 system with CID-based fragmentation and ~2.4-fold more with EAD-based fragmentation. Image Credit: SCIEX
Key features of lipidomics analysis using the ZenoTOF 8600 system
- The ZenoTOF 8600 system is 10 times more sensitive than the ZenoTOF 7600, resulting in higher signal-to-noise ratio in TOF-MS XIC peaks.
- The ZenoTOF 8600 system detected approximately 1.8 times more lipids in CID-based DDA tests than the ZenoTOF 7600 system. EAD-based DDA trials demonstrated a 2.4-fold increase in lipid identification.
- EAD analysis improved lipid characterization by identifying crucial structurally diagnostic pieces.
Introduction
The analysis of lipids in biological samples is complicated due to the sheer amount of lipid molecular species (estimated to be over 150,000), substantial isobaric overlap across lipids, and a lack of adequate primary and internal reference standards.
The structural specificity provided by the analytical method used to analyze lipids complicates their identification and quantification.
For example, the lipid PE 36:1 is defined by its total composition (lipid class, total number of carbons, and double bonds); however, when examined at the fatty acid level of specificity, this seemingly single lipid molecular species can be conservatively expanded to 5 lipids, as shown in Figure 2.
A closer look at the structure shows that lipid PE 36:1 can represent 56 different lipid molecular species when considering fatty acids, fatty acid locations, double bond orientations, and stereochemical configurations.
There is currently a lot of interest in targeted lipid analysis. This method eliminates the requirement for interpretive software, and the results are quantitative at the MS2 level.1 However, untargeted analytical procedures remain an essential aspect of lipid analysis, with the potential to identify novel lipid molecular species.
The effectiveness of an untargeted lipidomics experiment is determined by various parameters, including chromatographic separation, primary reference standards, the level of structural specificity required, and equipment sensitivity.
This last point directly impacts the quality of the product ion spectra generated during DDA analysis. Typically, the higher the spectrum quality (i.e., the breadth and intensity of fragments), the more likely a match can be found utilizing lipid spectral databases.
Untargeted lipidomics analysis is widely performed using a variety of mass spectrometric methods. The original procedure, "shotgun lipidomics," is a semi-targeted experiment that identifies lipids at the total composition level by grouping lipids that go through CID to produce lipid class-diagnostic fragment ions or neutral losses.
DDA methods can identify fatty acids but only quantify precursor ions; this is now the most prevalent methodology. Finally, data-independent acquisition (DIA) can give both qualitative identification and quantitative measurements at the MS2 level.
SWATH DIA's current form cannot resolve precursor ions to < 1 Da, perhaps leading to a larger false positive rate than DDA experiments. DDA experiments were performed to assess the performance of a new high-resolution mass spectrometer, the ZenoTOF 8600 system.
The ZenoTOF 8600 device offers unique design features that are ideal for untargeted lipidomics investigation. First, the instrument offers a complementary fragmentation mode, EAD, that provides unprecedented structural characterization of lipids.2-6
Using this fragmentation method, lipids can be detected at the fatty acid, positional isomer, and double bond positions (Figure 2).
EAD can also be used to evaluate the stereochemical configuration of fatty acid double bonds.5 Second, enhanced hardware, such as the front end with the Optiflow Pro source and a sophisticated optical detector, offers great sensitivity.
Third, the instrument's front end has a DJet+ with Mass Guard, which has been shown to reduce instrument contamination on the SCIEX 7500+ system,7 which is critical for lipid analysis.
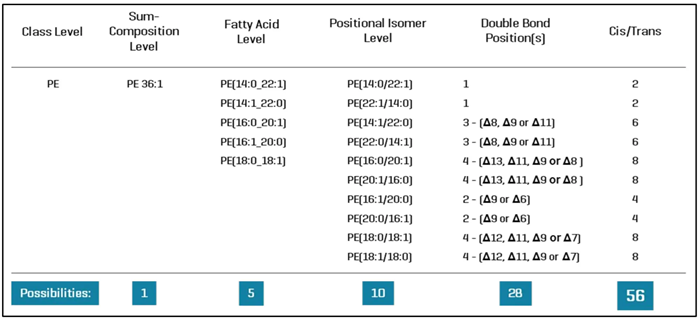
Figure 2. Molecular speciation of lipids based on the level of structural analysis. The sum composition of a lipid, which is the data output from “shotgun lipidomics” and most untargeted lipidomics experiments, describes lipids in terms of lipid class and the molecular weight, from which the total number of carbons and double bonds among the fatty acids can be deduced. DDA and targeted lipid analysis can analyze lipids at the fatty acid level, but alternative fragmentation modes or alternative methodologies are needed to identify lipids at greater levels of specificity. Here, only “typical” mammalian fatty acids were considered. Image Credit: SCIEX
The investigations examined human plasma (NIST SRM 1950) lipid extracts utilizing DDA with CID- or EAD-based fragmentation in the positive ion mode. Lipids were resolved using RP chromatographic separation methods, and the data was analyzed using MS-DIAL 5.5.
The purpose was to compare the lipid coverage of the ZenoTOF 8600 and 7600 systems in human plasma, compare data quality, and measure the improvement in sensitivity for lipid analysis.
Materials & methods
Sample preparation:
Millipore Sigma (Burlington, MA) provided human plasma (NIST SRM 1950), from which lipids were isolated using the Bligh and Dyer technique.8 Extracts were dried under a nitrogen stream and then resuspended in methanol for RP separation.
The ultimate extract concentration was 1 µl plasma/10 µl injection solvent. Samples were placed in HPLC vials and examined using mass spectrometry. All tests involved analyzing 5 µl of plasma extract (0.5 µl plasma equivalent).
Chromatography:
Chromatographic separation was carried out utilizing an Exion AD system (SCIEX), which included a binary ultrahigh-pressure gradient pump with degasser, a temperature-controlled autosampler, and a column oven. The separation was done using a Phenomenex Luna C18 column (2.1 µm, 150 x 2 mm) at 55 °C.
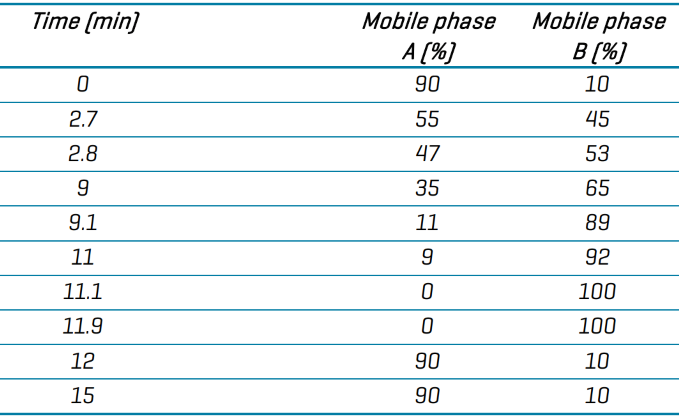
Mobile phase A was water/acetonitrile/isopropanol (50/30/20, v/v) with 10 mM ammonium acetate, while mobile phase B was isopropanol/acetonitrile/water (90/9/1, v/v) with 10 mM ammonium acetate. The flow rate was 0.4 mL/min, and the gradient profile is displayed in Table 1.
Samples were stored in the autosampler at 10 °C with a 5 µL injection volume. It should be noted that HILIC chromatography was tested using this DDA method (not shown). The results obtained with RP chromatography provided improved coverage. As a result, the findings presented here are solely based on RP separation.
Table 1. Reverse phase chromatography gradient conditions. Source: SCIEX
Mass spectrometry:
Lipid detection was carried out using two instruments: a ZenoTOF 7600 system and a ZenoTOF 8600 system, both of which have an Optiflow Turbo V ion source and an electrospray ionization (ESI) probe.
The automatic calibrant delivery system (CDS) maintained instrument calibration by calibrating every five samples with an ESI calibration solution tailored to positive or negative ionization modes. DDA and tests employed CID-based fragmentation in the positive ion mode.
The devices were set up for CID-based DDA tests to isolate the top 50 most abundant ions for fragmentation. For EAD studies, DDA selection criteria were used to identify the top 25 ions for fragmentation.
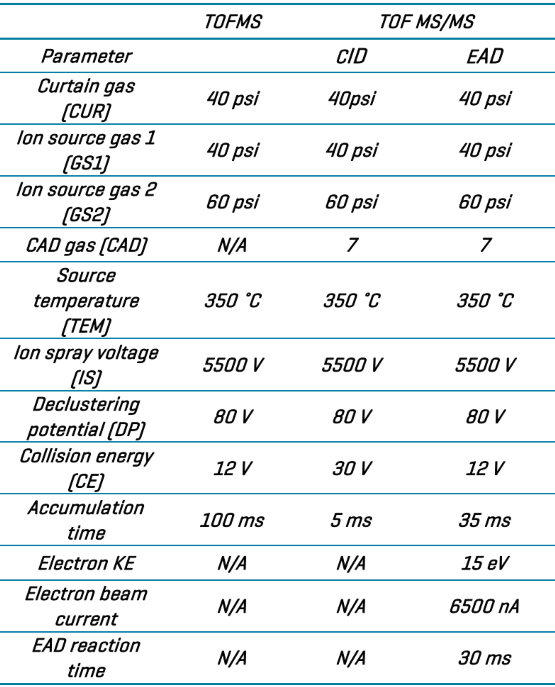
Dynamic background subtraction (DBS) with a mass tolerance of 50 mDa was used in both tests to reduce noise and improve MS/MS quality. The TOF MS accumulation time was set to 100 ms. Table 2 displays the TOF MS and TOF MS/MS values for CID and EAD.
The parameter settings were identical for both instruments. A complete overview of the ZenoTOF 7600 system instrument settings and their application to metabolomics and lipidomics DDA studies has already been published.9
Table 2. Instrument parameter settings. Source: SCIEX
Data processing:
MS-DIAL 5.5 software was used to handle all DDA data.10 A recent SCIEX technical note describes the optimal parameter values for MS-DIAL.11
Lipid coverage is calculated from data obtained by each instrument and reported as reference-matched identifications. However, the actual number of spectra acquired far exceeds this.
The results also include the number of lipids with a match score greater than 1.8. (For a more extensive explanation of match scores, see reference 8.) Qualitative data was represented using SCIEX OS software's Explorer module.
Results and discussion
Quantitative performance of the ZenoTOF 8600 system
The ZenoTOF 8600 system features an optical detector capable of processing more ion current than the ZenoTOF 7600 system. This ability, combined with enhanced front-end ion optics, increases the instrument's sensitivity.
To assess the impact of increased sensitivity on untargeted lipid analysis, two aspects of the data were considered: the increase in TOFMS peak intensities (measured using XIC peak areas with an extraction window of ± 0.010 Da) and the extent of lipid molecular species identified using MS-DIAL 5.5 software.
Figure 3 shows the combined TICs (TOFMS in blue and dependent product ion scans in pink) for the ZenoTOF 7600 and 8600 systems (top and bottom, respectively).
A casual review of each instrument's TICs reveals an approximately 10-fold increase in ion intensity for the ZenoTOF 8600 system, indicating greater sensitivity.
This development significantly increased the number of characteristics captured by the ZenoTOF 8600 system over the ZenoTOF 7600 system (25,816 vs. 12,482).
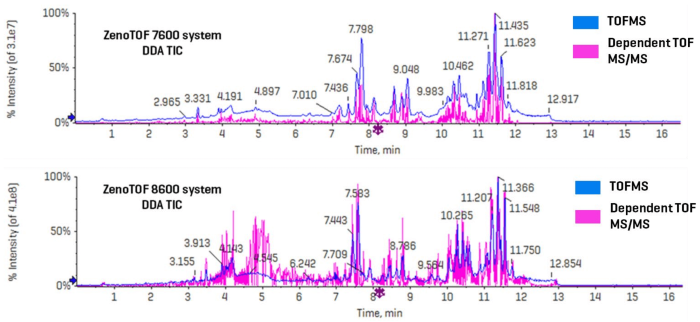
Figure 3. Untargeted (DDA) analysis of lipids in human plasma on the ZenoTOF 7600 and 8600 systems using CID-based fragmentation. The top panel shows a combined TIC for TOFMS (blue) and dependent product ion scans (pink) acquired on the ZenoTOF 7600 system. The lower panel shows the same for data acquired on the ZenoTOF 8600 system. The number and intensities of the triggered product ion scans are significantly higher using the ZenoTOF 8600 system (25,816 dependent scans vs. 12,482 on the ZenoTOF 7600 system in a direct comparison of a sample injected onto both instruments). The 2-fold increase in the number of dependent scans resulted in a greater number of identified lipids. Image Credit: SCIEX
The 10-fold increase in peak intensity on the ZenoTOF 8600 system does not imply that the device is 10-fold more sensitive. Sensitivity enhancements should be represented as an increase in the signal-to-noise ratio.
Because DDA experiments are not quantitative at the TOF MS/MS level, sensitivity was determined by comparing TOF MS XIC peak intensities to the concordant S/N of lipid analytes measured on each instrument.
Figure 4 shows the TOF MS XIC and TOF MS/MS spectra for five selected analytes. The left panel displays results from CID-based data collected on the ZenoTOF 7600 instrument, whereas the right panel displays the same data type for the ZenoTOF 8600 system.
Each product ion spectrum contains key diagnostic fragment ions, which were used to authenticate each lipid's identity in terms of total composition.
Because of the considerable isobaric overlap between distinct lipid classes during RP separation, the MS/MS spectra may seem convolved as several precursor ions are co-isolated during product ion analysis. This is one of numerous reasons why DDA experiments do not yield quantitative results at the MS/MS level.
Adopting a narrow XIC window allows for more accurate precursor isolation at the TOFMS level of analysis. Figure 4 shows that data recorded with the ZenoTOF 8600 system yields peak intensities that are approximately tenfold higher.
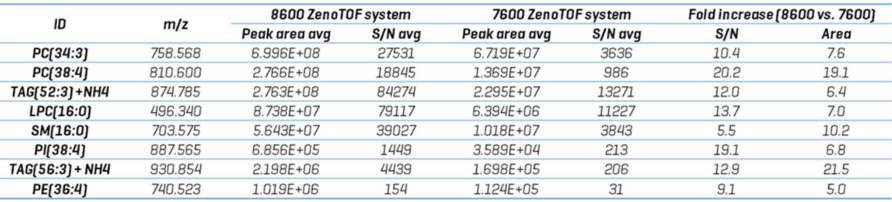
Table 3 evaluates these and other compounds, including S/N calculations for each peak. The S/N was obtained using SCIEX OS software's Explorer data analysis module, representing the average value for each analyte throughout n=5 injections.
The noise zone from each TOF MS XIC used to calculate the S/N was chosen based on the following criteria: the "blank" chromatographic region had to be longer than one minute, within three minutes of the specified peak elution time, and free of any extraneous isobaric peaks.
The ZenoTOF 8600 system increased the S/N of TOF MS XIC peaks by an average of 12.9-fold (range = 5.5- to 20.2-fold). This improvement is reflected in an average 10.4-fold increase in peak intensities (range: 5.0- to 19.1-fold).
Together, these results show that the ZenoTOF 8600 system improves sensitivity while increasing the number of dependent scans triggered during DDA analysis.
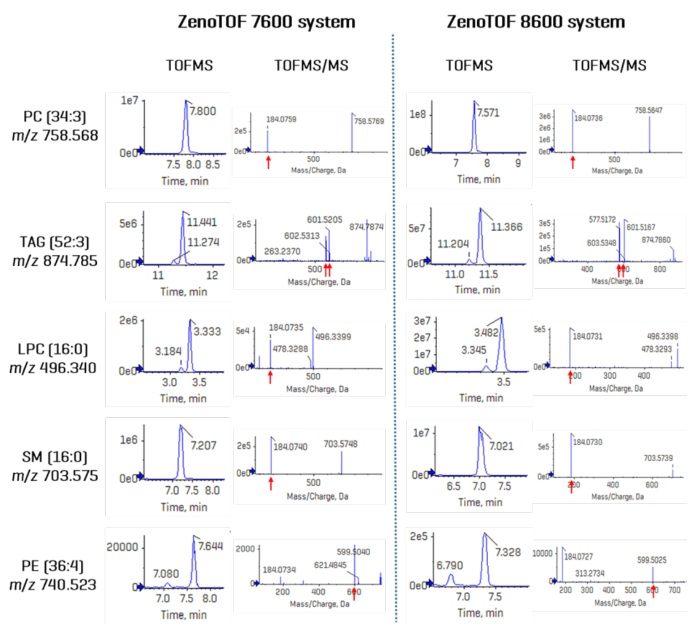
Figure 4. Comparison of DDA data acquired on the ZenoTOF 7600 and 8600 systems. Five compounds were selected across different lipid classes to show the XIC intensities and the associated TOF MS/MS spectra. Indicated by red arrows, diagnostic fragment ions for each lipid are shown in each product ion spectrum. Because these data were acquired in the positive ion mode, polar lipids were only identified at the sum-composition level; TAG 52:3 can be speciated at the fatty acid level in this ionization mode. Overall, TOFMS XIC peak intensities for every compound were increased significantly (~10-fold) using the ZenoTOF 8600 system. Image Credit: SCIEX
Table 3. XIC TOF MS peak areas and s/n calculations for various lipids identified from CID-based DDA analysis on the ZenoTOF 7600 and 8600 systems. Source: SCIEX
Identification of lipids using MS-DIAL 5.3 software
The ZenoTOF 8600 system's higher sensitivity and expanded number of features should result in better lipidome coverage from untargeted lipidomics research.
In general, increased sensitivity allows for the detection of less conspicuous fragment ions, which improves the quality of the product ion spectra and leads to a more accurate and reliable lipid identification.
DDA tests were carried out on the ZenoTOF 7600 and 8600 systems to explore this notion and compare the number of detected lipid molecular species in human plasma extracts.
Earlier, a top-50 technique was claimed to be the optimum selection criterion for DDA metabolomics analysis.9
To guarantee the highest possible coverage for lipidomics, top-40, top-50, and top-60 DDA selection criteria approaches were applied (not shown). The top-50 DDA method proved to be the best for untargeted lipid analysis on both platforms.
The MS-DIAL user interface shows a comprehensive view of the processed DDA data (Figure 5). The upper left-hand screen, the peak spot navigator, displays the number of reference-matched lipids discovered during data processing. This is the total number of distinct lipids detected during the batch procedure.
The top panel of Figure 5 displays the results from the ZenoTOF 7600 system, while the bottom panel displays the results from data collected on the ZenoTOF 8600 system. The latter instrument's increased sensitivity led to a 182% increase (~1.8-fold) in the human plasma lipidome coverage in these tests (875 vs. 481 reference-matched IDs).
These discovered lipids have match scores ranging from 2.6 to 0.6. Based on these and other experiments, a minimum match score of 1.8 provides the highest confidence in the results.11
Figure 1 shows that the reference-matched lipids with scores greater than 1.8 were 221 and 455 for the ZenoTOF 7600 and 8600 systems, respectively.
Using the ZenoTOF 8600 system to examine 0.5 µl of human plasma in DDA tests using CID-based fragmentation in the positive ion mode resulted in a 205% (~2-fold) increase in detected lipids.
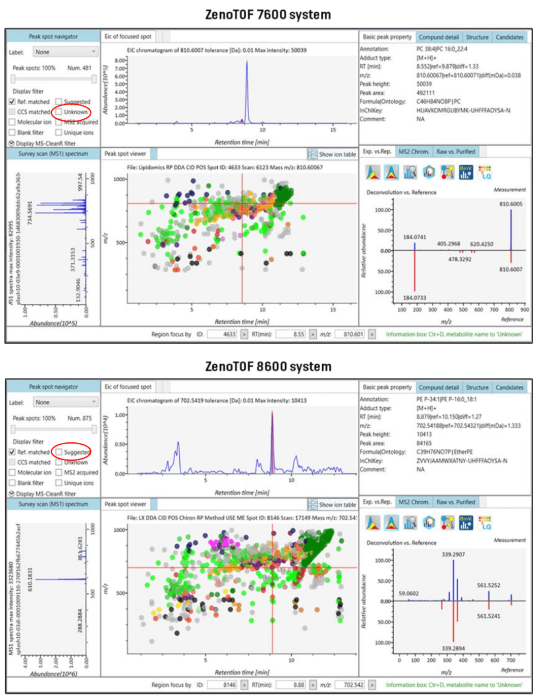
Figure 5. MS-DIAL 5.2 software results user interface: comparative lipid identification. CID-based DDA experiments were performed on the ZenoTOF 7600 (A) and 8600 (B) systems, and the data were processed using MS-DIAL 5.2 software. In these examples, the data from 9 DDA experiments (RP chromatography; positive ion mode; 3 x top-40, 3 x top-50 and 3 x top-60) were processed together to provide a composite view of the lipids identified by the two instruments (see Table 5). The ZenoTOF 7600 data identified 481 reference-matched lipids, whereas the ZenoTOF 8600 identified 875, an 182% increase in coverage (highlighted in red). For each identified lipid, the molecular details are given (upper right-hand panels) along with the spectral matching results (lower right-hand panel). Image Credit: SCIEX
Characterization of lipids using EAD-based fragmentation
The data provided by CID-based lipid analysis offers only modest structural information about lipids. The positive ion mode's results are confined to the sum composition, as seen in Table 4.
This is because the loss of the phospholipid head group is the most advantageous fragmentation event during CID; the fatty acids are lost as neutral species, and the complementing lyso-lipid fragments are usually in short supply.
The negative ion mode allows for the identification of lipids at the fatty acid level (Figure 2); nevertheless, class distinction is not attainable in this ionization mode, and class specificity depends on chromatography or other forms of separation.
EAD-based fragmentation is carried out in the positive ion mode and offers information about the lipid class and fatty acids, enabling a near-complete structural characterisation of lipids.5
The ZenoTOF 8600 system's enhanced sensitivity was used to examine lipids in a DDA scan mode with EAD-based fragmentation. Compared to CID, EAD is somewhat inefficient in terms of fragmentation, depleting 30-40% of the precursor ion in a typical lipidomics experiment with an electron kinetic energy of 15 eV.
Incomplete fragmentation of the precursor ion has the specific advantage of producing most of the primary fragments.
The Zeno trap's low fragmentation efficiency and the enhanced sensitivity of the ZenoTOF 8600 system are critical instrument features for generating high-quality EAD-based product ion spectra for lipid research.
Table 4. XIC TOF MS peak areas and s/n calculations for various lipids identified from EAD-based DDA analysis on the ZenoTOF 7600 and 8600 systems. Source: SCIEX
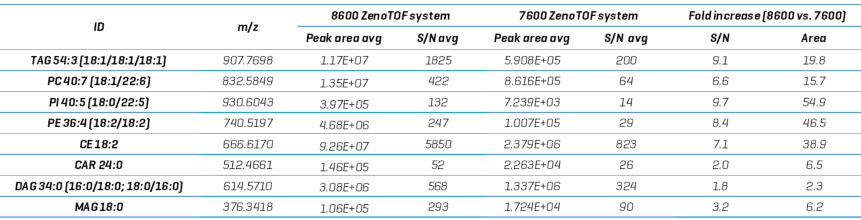
Figure 6 shows example TICs from EAD-based DDA trials. The top two chromatograms show the survey scan (TOF MS in blue) and the dependent scan (pink) from data collected on the ZenoTOF 7600 instrument.
The TICs were split in this figure due to significant scale discrepancies, which is not the case with CID-based data (Figure 3). The ZenoTOF 8600 system was used to collect EAD-based DDA data, which is shown below.
The elution patterns at the TOF MS and TOF MS/MS levels appear comparable, but the intensities of the peaks between the two instruments are considerably different, with the ZenoTOF 8600 system displaying ~10 times larger intensities.
To compare the quantitative differences between the two instruments that use EAD-based fragmentation, peak areas and S/N values were assessed for a typical number of substances (Table 4).
As with the CID-based fragmentation data, the ZenoTOF 8600 system is more sensitive at the MS1 level, as demonstrated by comparing the S/N of analyte peaks generated by the two instruments.
Data collected using the ZenoTOF 8600 system showed an average increase in peak area of 23.8-fold (range = 2.3-54.9) and an average increase in S/N of 6-fold (range = 1.8-9.7). This is significant, but slightly smaller than the almost 10-fold rise in CID-based data.
This could be connected to the types of compounds used for comparison. The three types of substances with the smallest increases in S/N were acylcarnitines (CAR), diacylglycerols (DAG), and monoacylglycerols (MAG).
TAGs and phospholipids were the two types of compounds that showed comparable large increases in S/N. Because both types of fragmentation-based DDA studies have a TOFMS survey scan independent of the fragmentation event, this data indicates that there may be some compound reliance on sensitivity between the two instruments.
The EAD-based DDA data was processed using MS-DIAL 5.5 software, which had the same parameter settings as the CID-based data. One major exception was the usage of a specific EIEIO library within silico-generated EAD spectra for ~9000 lipids.
Because most, if not all, CID-based fragments are generated using EAD, the standard CID-based lipid database was also employed for data analysis.
When plasma extract was analyzed with the ZenoTOF 8600 system vs the ZenoTOF 7600 system, the detected lipids rose by 240% (816 vs. 339), as shown in Figure 1.
Both instruments acquired around 3.5K product ion spectra, indicating that these were top-25 trials rather than top-50 for CID-based DDA analysis. This suggests that increased lipid identification is likely owing to higher-quality product ion spectra, which leads to better database matching.
Spectral matching is an essential part of compound identification. In lipidomics, a false positive rate to assess data processing quality is neither defined nor widely utilized. Rather, confidence in identification is determined by the similarity of spectra (i.e., reference vs. measured) and quantified with a dot product score.
This mathematical function returns a value ranging from 0 to 1, with 1 representing the highest amount of resemblance. When evaluating mass spectrometry data, this function compares the number and intensity of fragment ions. MS-DIAL software employs a "match score" value to qualify a discovered compound.12
This score is calculated by combining the dot product score, reverse dot product score, RT similarity, and precursor mass similarity.
Although not expressly stated in the literature, in this research and others, a match score value of more than 1.8 is considered a strong match.11 Manual verification may be required for compounds with values less than 1.8.
Figure 1 shows the number of lipids discovered with a match score >1.8 on each instrument using the various fragmentation types.
The ZenoTOF 8600 system produced more reference-matched IDs and identified lipids with higher match scores, which may represent the superior quality of the product ion spectra produced by this instrument.
The match scores were much lower for each instrument's EAD-based fragmentation data. This can be due to the lower fragment intensities in EAD-generated spectra, but it could also be because the EIEIO library was developed in silico, and the number of fragments and intensities do not always match those of a spectrum recorded using authentic standards.
This mismatch should be reflected in the Dot Product score, resulting in a lower score. For example, using the ZenoTOF 8600 system, a glycerophospholipid identified in the CID-based experiment as PE P-34:2 had a dot product score of 944.
Using the same instrument and EAD-based fragmentation, the molecule was identified as PE (p-16:0_18:2), with an estimated dot product score of 598. Manual inspection reveals the diagnostic peaks in the measured spectrum, but their intensities are low in comparison to the reference spectrum (not depicted).
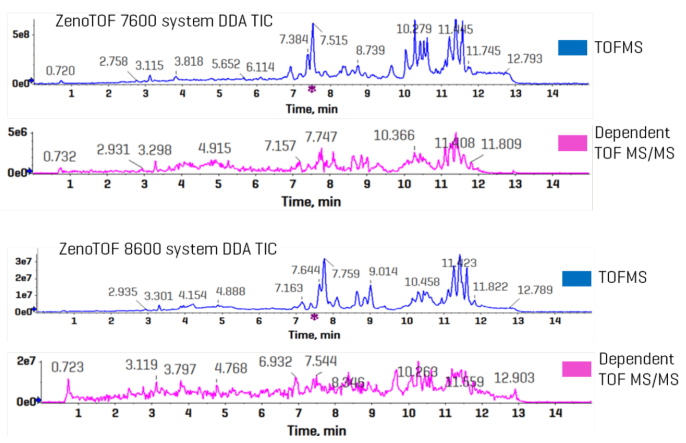
Figure 6. Comparison of TICs from DDA experiments using EAD-based fragmentation on the ZenoTOF 7600 and 8600 systems. Image Credit: SCIEX
EAD-based fragmentation results in a product ion spectrum enriched with structurally diagnostic fragment ions (3-6, 11). Figure 7 shows a qualitative study of an example lipid molecular species.
The MS-DIAL user interface display for PC (18:0_20:1) is presented on the left side of the figure. It includes molecular details and an inverted display of the deconvoluted data vs. reference spectrum.
MS-DIAL recognized the two fatty acids in this sample but did not assign a regiospecific configuration. The molecule's product ion spectrum is shown on the right side of the picture, which was created using the Explorer module in the SCIEX OS program.
The diagnostic ions, highlighted in red, can be used to further structurally describe the PC molecule. Notably, the fragment at m/z 522.3572 is the consequence of the unique neutral loss of a 20:1 fatty aldehyde from the sn-2 carbon of the glycerol backbone, allowing for unequivocal identification at the positional isomer level as PC (18:0/20:1).5
Figure 7 illustrates the unique neutral losses and fragment ions associated with regiospecific fatty acids. Example of improved lipid structure characterization using EAD-based fragmentation.
The left side of the figure shows the MS-DIAL UI readout for PC (18:0_20:1), which includes molecular details and an inverted display of the deconvoluted data vs. the database spectrum. The right side of the figure shows the Explorer module of SCIEX OS software, which produces an enhanced product ion spectrum.
The diagnostic ions that can help structurally describe the PC molecule are highlighted in red.
Notably, the fragment at m/z 522.3572 is the consequence of the neutral loss of a 20:1 fatty aldehyde from the sn-2 carbon of the glycerol backbone,5 allowing the positional isomer to be identified as PC (18:0/20:1).
Complex lipids during EAD-based fragmentation have been found and can be employed for improved structural characterization.5
To summarize, the ZenoTOF 8600 system is suited for non-targeted lipidomics study. The system's ability to perform 100 MS/MS operations per second and its ~10-fold higher sensitivity (compared to the ZenoTOF 7600 system in terms of S/N at the MS1 level) allows for accurate identification and coverage of lipids in human plasma.
MSDIAL 5.5 software provides a seamless approach for data processing and can evaluate EAD-based fragmentation data from DDA experiments to routinely identify lipids at the fatty acid level as well as the regio-specific and double bond position levels (Figure 2).11
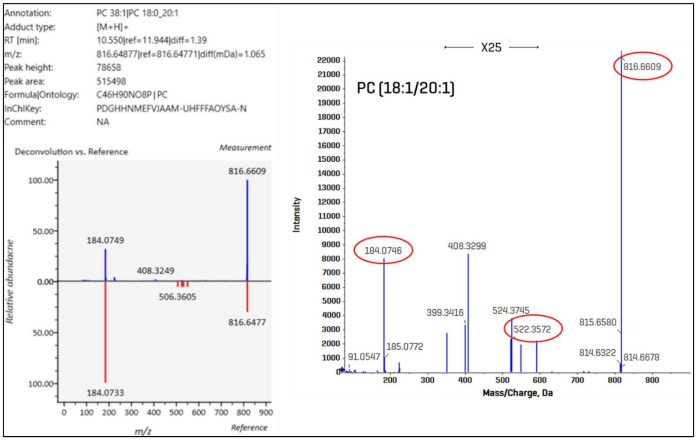
Figure 7. Example of improved lipid structural characterization with EAD-based fragmentation. The left side of the figure shows the MS-DIAL UI readout for PC (18:0_20:1), including molecular details and an inverted display of the deconvoluted data vs. the database spectrum. On the right side of the figure is an enhanced product ion spectrum from the Explorer module in SCIEX OS software. The diagnostic ions that can be used to structurally characterize the PC molecule are highlighted in red. Of note, the fragment at m/z 522.3572 results from the specific neutral loss of a 20:1 fatty aldehyde from the sn-2 carbon of the glycerol backbone (5), enabling the identification at the positional isomer level as PC (18:0/20:1). Image Credit: SCIEX
Conclusions
- The ZenoTOF 8600 system outperforms the ZenoTOF 7600 system in terms of TOF MS XIC peak intensities and signal-to-noise ratio.
- The ZenoTOF 8600 system gathered approximately twice as many features (~25 vs. ~12 k) under the same experimental conditions.
- The ZenoTOF 8600 system outperformed the ZenoTOF 7600 system in CID-based DDA lipidomics research in the positive ion mode, resulting in approximately 1.8-fold more reference-matched spectra.
- MS-DIAL 5.5 software can process WIFF2 files generated by CID-based fragmentation experiments on SCIEX instruments.
- MS-DIAL 5.5 software can process EAD-based fragmentation data using an in silico-generated EIEIO spectrum database.
- The ZenoTOF 8600 system recognized 240% more IDs than the ZenoTOF 7600 system, providing extra structurally diagnostic pieces for lipid identification with excellent specificity.
References
- Zhang, Z., et al. (2023). Development of a targeted hydrophilic interaction liquid chromatography-tandem mass spectrometry based lipidomics platform applied to a coronavirus disease severity study. Journal of Chromatography A, 1708, pp.464342–464342. https://doi.org/10.1016/j.chroma.2023.464342.
- SCIEX (2024). Quantitative analysis and structural characterization of bile acids using the ZenoTOF 7600 system. (online) Available at: https://sciex.com/tech-notes/life-science-research/metabolomics/quantitative-analysis-and-structural-characterization-of-bile-ac (Accessed 12 Jul. 2025).
- Baba, T., et al. (2016). In-depth sphingomyelin characterization using electron impact excitation of ions from organics and mass spectrometry. 57(5), pp.858–867. https://doi.org/10.1194/jlr.m067199.
- Baba, T., et al. (2016). Structural identification of triacylglycerol isomers using electron impact excitation of ions from organics (EIEIO). Journal of Lipid Research, 57(11), pp.2015–2027. https://doi.org/10.1194/jlr.m070177.
- Baba, T., et al. (2018). Quantitative structural multiclass lipidomics using differential mobility: electron impact excitation of ions from organics (EIEIO) mass spectrometry. Journal of Lipid Research, 59(5), pp.910–919. https://doi.org/10.1194/jlr.d083261.
- Baba, T., et al. (2017). Distinguishing Cis and Trans Isomers in Intact Complex Lipids Using Electron Impact Excitation of Ions from Organics Mass Spectrometry. Analytical Chemistry, 89(14), pp.7307–7315. https://doi.org/10.1021/acs.analchem.6b04734.
- SCIEX. (2024). Redefine bioanalysis with enhanced robustness on the SCIEX 7500+ system. (online) Available at: https://sciex.com/tech-notes/pharma/bioanalysis-pk/redefine-bioanalysis-with-enhanced-robustness-on-the-sciex-7500-plus-system (Accessed 12 Jul. 2025).
- Bligh, E.G. and Dyer, W.J. (1959). A RAPID METHOD OF TOTAL LIPID EXTRACTION AND PURIFICATION. Canadian Journal of Biochemistry and Physiology, 37(8), pp.911–917. https://doi.org/10.1139/o59-099.
- SCIEX. (2022). Untargeted data-dependent acquisition (DDA) metabolomics analysis using the ZenoTOF 7600 system. (online) Available at: https://sciex.com/tech-notes/life-science-research/metabolomics/untargeted-data-dependent-acquisition--dda--metabolomics-analysi (Accessed 12 Jul. 2025).
- Takeda, H., et al. (2024). MS-DIAL 5 multimodal mass spectrometry data mining unveils lipidome complexities. Nature Communications, 15(1). https://doi.org/10.1038/s41467-024-54137-w.
- SCIEX. (2025). The simultaneous processing of DDA and SWATH data by MS-DIAL software improves coverage for untargeted lipidomics analysis. (online) Available at: https://sciex.com/tech-notes/life-science-research/lipidomics/The-simultaneous-processing-of-DDA-and-SWATH-data-by-MS-DIAL-software-improves-coverage-for-untargeted-lipidomics-analysis (Accessed 12 Jul. 2025).
- Tsugawa, H., et al. (2015). MS-DIAL: data-independent MS/MS deconvolution for comprehensive metabolome analysis. Nature Methods, (online) 12(6), pp.523–526. https://doi.org/10.1038/nmeth.3393.
About SCIEX
SCIEX mission is to deliver solutions for the precision detection and quantitation of molecules, empowering their customers to protect and advance the wellness and safety of all.
SCIEX has led the field of mass spectrometry for 50 years. From the moment we launched the first ever commercially successful triple quad in 1981, they have developed groundbreaking technologies and solutions that influence life-changing research and outcomes.
Today, as part of the Danaher family of global life science and technology innovators, they continue to pioneer robust solutions in mass spectrometry and capillary electrophoresis. But they don’t just develop products. It is what they do together with their customers that sets them apart. That’s why thousands of life science experts around the world choose SCIEX to get the answers they can trust to better inform critical decisions. Decisions that positively impact lives.
They proudly stand behind our tagline: The Power of Precision.
Sponsored Content Policy: News-Medical.net publishes articles and related content that may be derived from sources where we have existing commercial relationships, provided such content adds value to the core editorial ethos of News-Medical.Net which is to educate and inform site visitors interested in medical research, science, medical devices and treatments.