This article highlights the ZenoTOF 8600 system's ability to detect, measure, and structurally describe bile acid levels in human plasma. Bile acid analysis in human samples has grown increasingly significant as insights into the prominent biological role of this class of molecules are discovered.1–2
Bile acid analysis using triple-quadrupole MS (TQMS) systems is difficult due to the significant chemical background observed in various precursor ions to precursor ion-based multiple-reaction monitoring (MRM) transitions employed in current cutting-edge assays.1-4
High-resolution mass spectrometry (HRMS) allows for the extraction of fragment ions with a narrow mass-to-charge (m/z) window, which can reduce background chemical interferences and improve the assay's signal-to-noise (S/N), as previously demonstrated.3
Individual bile acid isomers are now detected using chromatographic resolution since collision-induced dissociation (CID)-based fragmentation cannot discriminate between these isomeric metabolites.
A recent fragmentation approach, electron-activated dissociation (EAD), can produce distinct fragments even among isomers, potentially reducing analysis time.
The ZenoTOF 8600 system was used to measure the bile acid content of human plasma sample extracts using both CID- and EAD-based fragmentation techniques. When isomeric pairs overlapped, EAD-based fragmentation was utilized deliberately to provide specificity and allow for speedier analysis.
Key features of bile acid analysis on the ZenoTOF 8600 system
- The ZenoTOF 8600 system detects and quantifies bile acids with a 12-fold higher sensitivity than the ZenoTOF 7600 system.
- HRMS's narrow fragment ion extraction window enhances test sensitivity by decreasing background chemical interferences, leading to higher S/N values.
- EAD can generate diagnostic fragment ions to distinguish bile acid isomers, improving analytical specificity and speed.
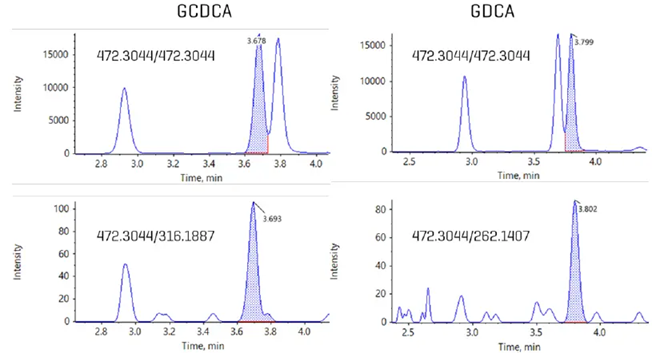
Figure 1. Detection and quantitation of bile acid isomers in human plasma using EAD. Using a fast, 10-minute gradient, bile acids were analyzed on the ZenoTOF 8600 system, Isomers such as GCDCA and GDCA are indistinguishable using CID-based fragmentation. Using EAD, unique, diagnostic fragments were identified that enabled their accurate quantitation despite the chromatographic overlap. The upper panels show the two isomers overlapping when using a precursor to precursor MRMHr transition; the lower panels show the ability to isolate each isomer separately when a unique, EAD-based fragment is used. Image Credit: SCIEX
Introduction
Bile acids are amphipathic steroidal molecules produced in the liver from cholesterol that play an important role in the digestion and absorption of dietary lipids.1 Primary bile acids, such as cholic acid and chenodeoxycholic acid, are conjugated with glycine or taurine before being secreted into bile.
Once discharged into the intestinal lumen, these acids undergo microbial modification to produce secondary bile acids such as deoxycholic acid and lithocholic acid, which are collectively known as microbially conjugated bile acids (MCBAs).
The enterohepatic circulation maintains a dynamic bile acid production, secretion, reabsorption, and elimination equilibrium.
Beyond their digestive roles, bile acids are increasingly recognized as signaling chemicals involved in metabolic control and immunological responses. They act via nuclear receptors such as FXR and membrane-bound G-protein-coupled receptors.2
Because of its sensitivity, specificity, and capacity to distinguish structurally identical substances, mass spectrometry (MS) has emerged as the preferred analytical approach for bile acid quantification and profiling.3-5
HPLC ESI-MS/MS enables the simultaneous identification of numerous bile acid species, both conjugated and unconjugated, in biological matrices such as plasma, bile, and feces.
Targeted MS techniques employing multiple reaction monitoring (MRM) provide high-throughput and quantitative data critical for clinical and research applications in liver disease, metabolic diseases, and gut microbiome studies.
A recent study analyzed bile acids utilizing the ZenoTOF 7600 system, a hybrid quadrupole time of flight instrument (QTOF) with high resolution (~35K) and mass accuracy (<2 ppm) [TN ref].
Bile acid analysis in the negative ion mode is difficult to perform with nominal mass instruments due to the high chemical background noise, which is solvent-based.
With precise mass systems, this issue can be reduced by adopting small product ion extraction windows (XIC), which reduce noise and allow the ZenoTOF 7600 system to have an estimated LOQ comparable to the very sensitive triple quadrupole SCIEX 7500 system.
These experiments were extended with the ZenoTOF 8600 system to take advantage of the instrument's increased sensitivity.
The ZenoTOF 8600 system's unique design features are ideal for focused bile acid analysis. First, the instrument offers a supplementary fragmentation mode, EAD, that provides unmatched structural analysis of tiny molecules.6–10
Second, enhanced hardware, such as the front end with the Optiflow Pro source, a wider instrument orifice, and a sophisticated optical detector, allows for higher sensitivity than the ZenoTOF 7600 system.
Third, the instrument's front end features a DJET+ with Mass Guard, which has been shown to reduce instrument contamination on the SCIX 7500+ system, an important consideration for lipid and metabolite analysis, particularly in the complex matrices common to bile acid analysis, such as plasma, feces, and bile.11
Bile acids are cholesterol-derived amphipathic compounds composed of saturated hydroxylated C-24 sterols. Figure 2 shows how the position and stereochemistry of the hydroxyl functional groups define the many isomers within each subclass.
CID-based bile acid fragmentation produces predominantly product ions linked to the bile acid head group, with few fragments created from the ring structure; thus, CID alone does not generate diagnostically valuable fragment ions for identification or quantification.
Using chromatography to resolve bile acid isomers necessitates relatively long chromatographic gradients, which are not ideal for high-throughput analyses. EAD provides an alternative to lengthy chromatographic gradients and CID-based fragmentation.
EAD-based fragmentation generates many fragments from the sterol ring structure and may differentiate between the isomers of each bile acid subclass without requiring substantial chromatographic process development.
This article uses the ZenoTOF 8600 system's speed and sensitivity to quantify bile acids in prepared plasma samples.
To demonstrate the ability of EAD to improve structural specificity during quantitative analysis, unique EAD-based fragments were identified for potentially co-eluting isomer pairs and strategically used in conjunction with CID-based fragmentation to allow for a faster assay while maintaining quantitative specificity, accuracy, and precision.
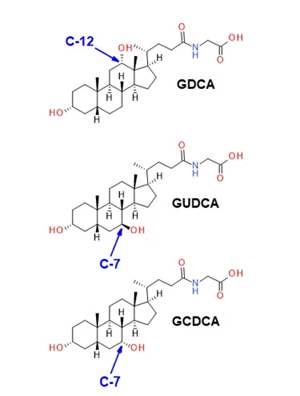
Figure 2. The glucodeoxycholic acid subclass of bile acids. Bile acids are cholesterol-derived amphipathic molecules of saturated hydroxylated C-24 sterols. GDCA has a hydroxyl moiety at carbon 12 (C-12), whereas GUDCA and GCDCA are hydroxylated at carbon 7 (C-7). The latter two isomers are characterized by a different stereochemistry at the number 7 carbon. Quantitative specificity for this class of molecules is highly dependent on chromatographic resolution when analyzed using CID-based fragmentation. Image Credit: SCIEX
Methods
Materials:
The bile acid standard mixes were bought from Cambridge Isotopes Laboratories. Internal standards were stable isotope-labeled bile acid mixes (unconjugated, cat# MSK-BA1; conjugated, MSK-BA2), whereas unlabeled bile acid mixes (unconjugated, cat# MSK-BA1-US; conjugated, MSK-BA2-US) were primary reference standards. All solvents were LC-MS quality and came from Burdick & Jackson and Fisher Scientific.
Sample preparation:
Human blood (for research purposes only) was collected into tubes containing potassium ethylenediamine tetraacetic acid (K2EDTA) anticoagulant using a process approved by BCM's institutional review board (IRB).
The plasma was separated from the red blood cell component using centrifugation. Pipette 50 µL of each plasma sample into 0.6 mL Eppendorf tubes. Add 200 µL of methanol to precipitate plasma proteins (primary DF=5-fold).
All samples were vortexed for 30 seconds before centrifugation at 17,000 g for five minutes. The supernatant from each cleared plasma extract sample was transferred to new vials.
Each cleared plasma extract sample was put into new glass vials at a volume of 50 µL. Each sample vial received 450 µL of an internal standard solution (10 nM deuterated BAs) (DF=50-fold overall), which was then capped and vortexed for 30 seconds and prepared for HPLC/ESI-MS/MS analysis.
Table 1. Chromatographic gradient conditions. Source: SCIEX
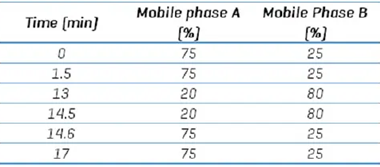
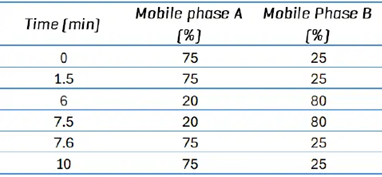
Table 2. 10-minute chromatographic gradient conditions. Source: SCIEX
Chromatography:
Metabolites were extracted and resolved using a Nexera 40 Series UHPLC system with a Restek Raptor C18 column (100 x 2.1 mm; 5.0 µm particle size).
The autosampler sample bay was kept at 10 °C, and a 5 µL sample volume was injected onto the column. The column oven temperature was set to 50 °C, with a constant mobile phase flow rate of 0.3 mL/min for a total run period of 17 minutes.
The mobile phase contained (A) 10 mM ammonium formate in water and (B) 100% acetonitrile. Table 1 presents the gradient details.
Alternatively, the gradient was changed to allow for a 10-minute total run time (Table 2). EAD-based fragmentation was used selectively to maintain compound specificity for co-eluting isomers that cannot be distinguished using CID-based fragmentation, as illustrated in Figure 1.
Mass spectrometry:
The ZenoTOF 8600 system was used to examine sample extracts, which featured an OptiFlow ProTurbo V ion source and a scheduled, high-resolution multiple reaction monitoring (sMRMHR) scan mode.
CID-based fragmentation was utilized to evaluate the system's performance using the 17-minute gradient. The experiment was performed with EAD-based fragmentation.
An sMRMHr experiment was carried out using mixed-mode fragmentation to shorten the duration to 10 minutes. When the gradient was shortened, isomers that overlapped were identified using an EAD-based fragment.
Otherwise, CID was used for analysis due of its higher sensitivity and shorter accumulation durations. Table 3 shows the MS instrument parameters, and Table 4 lists the substances tested.
Table 3. ZenoTOF 7600 and QTRAP 7500 systems source and method parameter settings. Source: SCIEX
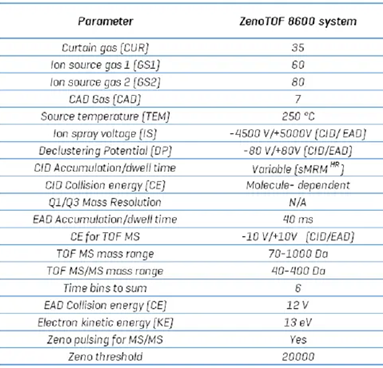
Table 4. Bile acid compound parameters. Source: SCIEX
During sMRMHr analysis, a complete product ion spectrum is obtained. To find diagnostic EAD-based fragments for co-eluting bile acid isomers like GCDCA and GDCA,
The Analytics portion of the SCIEX OS program was utilized for quantitation, while the Explore module was employed to describe bile acids using EAD-based MS/MS spectra structurally.
The limit of quantitation (LOQ) was calculated using the lowest standard injection with a %CV value < 15 and an accuracy between 85% and 115% of the predicted values for the internal standard curve.
Data processing:
All data was handled using the SCIEX OS software. The Analytics module was utilized for quantification, while the Explore module was used to structurally describe bile acids derived from EAD-based MS/MS spectra.
Limits of detection (LOD) and quantitation (LOQ) estimates were calculated using the standard deviation of the y-intercepts and the mean slope of the three (ZenoTOF 7600 system) or four (QTRAP 7500 instrument) calibration curves calculated for each analyte, as described in the ICH harmonized tripartite guideline.
The linear regression calculations with SCIEX OS software included the internal standard concentration (9 nM).
Results and discussion
A bile acid standard curve was created in plain solvent and evaluated using the ZenoTOF 8600 instrument. The parameter settings were improved, as shown in Tables 3 and 4, and the chromatographic gradient conditions separated each isomeric bile acid with baseline resolution (Figure 3).
The concentrations on the internal standard curve ranged from 0.011 to 100 nM, representing a dynamic range of more than four orders of magnitude.
Figure 4 shows an example curve for gylcoursodeoxycholic acid (GUDCA), as well as individual chromatograms for each injection of the standard curve ranging from 0.011 to 50 nM GUDCA.
Table 5 displays the quantitative information for quantifying GUDCA. The results from the internal standard curves were utilized to determine the LOQ for each bile acid measured using the ZenoTOF 8600 system (Table 6).
These values were calculated by injecting the lowest concentration standard that resulted in a %CV value <15% and an accuracy range of 85% to 115% of expected value.
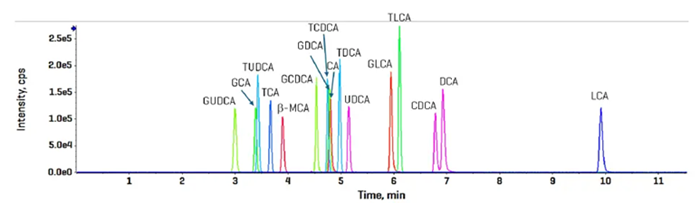
Figure 3. Elution profile of targeted bile acids using CID-based fragmentation in the negative ion mode. The 50 nM standard was injecte3d and analyzed using the sMRMHr scan mode. Total run time was 17 min. Image Credit: SCIEX
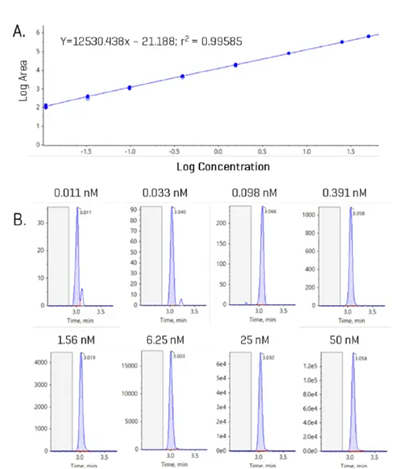
Figure 4. Example internal standard curve with representative peaks for GUDCA. (A) Internal standard curve for GUDCA from 0.011 to 50 nM. (B) Example chromatograms at each concentration level of the curve; blank region highlighted in grey. Image Credit: SCIEX
Table 5. Quantitative statistics for GUDCA. Source: SCIEX
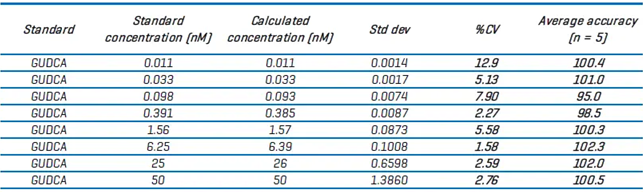
Table 6. LOQ values for bile acids on the ZenoTOF 8600 system. Source: SCIEX
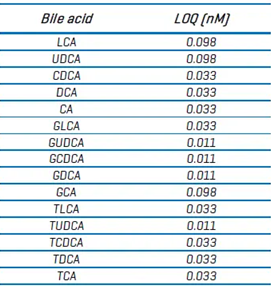
The LOQ values for the ZenoTOF 7600 system were determined differently [BA TN] than those in this study (see above).
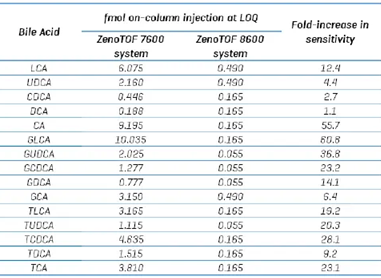
The ZenoTOF 7600 system received a 15 µL sample, while the ZenoTOF 8600 system received only 5 µL. To assess the relative sensitivity of the two systems, the on-column injection amount at the LOQ was chosen as a benchmark (Table 7).
The statistics indicate that the ZenoTOF 8600 system is approximately 20-fold more sensitive than the ZenoTOF 7600 system (range = 1.1 to 61-fold improvement). The large range may partly be attributable to the different sources employed by the two instruments.
The ZenoTOF 7600 system features the Turbo V dual spray source, which optimizes differently and may have a different ionization capacity or ionization efficiency than the ZenoTOF 8600 system's Optiflow Pro Turbo V ion source.
The ZenoTOF 8600 system's ion route differs from the previous version, which may have a modest effect on transmission in a compound-dependent manner.
Table 7. Comparison of on-column injection load at LOD between the ZenoTOF 7600 and 8600 systems. Source: SCIEX
The technique established using neat standards was used to quantify endogenous bile acids in human plasma. Figure 5 shows the combined XIC results for all targeted bile acids determined using the sMRMHr procedure in human plasma extract.
Except for lithocholic acid (LCA), all bile acids were identified and measured with the ZenoTOF 8600 instrument.
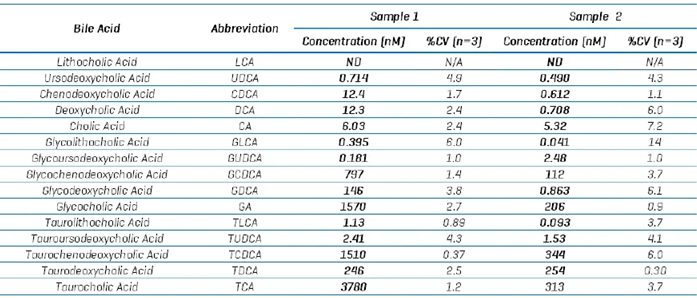
The data presented here was gathered using the CID-based fragmentation method, with the LC gradient lasting 17 minutes. Table 8 shows the bile acid amounts measured in two example plasma samples.
The same experiment was carried out for all compounds utilizing EAD-based fragmentation (not shown), and the results were used to identify diagnostic fragment ions for bile acid isomers that co-elute with the quicker, 10-minute gradient.
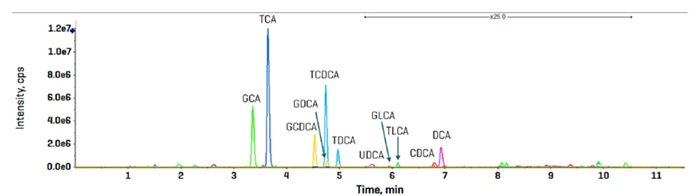
Figure 5. Bile acid detection and quantitation in human plasma using sMRMHr analysis on the ZenoTOF 8600 system. Image Credit: SCIEX
Table 8. Example quantitative results from 2 different human plasma samples. Source: SCIEX
The ZenoTOF 7600 system's EAD-based fragmentation functionality can yield more structural data than CID-based fragmentation. Previously, the discovery of distinct pieces of the bile acid isomers CDCA and DCA was reported [TN BA].
These isomers elute quite closely, which contributes to the very long analysis time required to maintain chromatographic resolution. It was expected that adopting EAD-based fragmentation for these isomer pairings will result in a shorter chromatographic gradient and faster sample analysis.
The researchers used the ZenoTOF 8600 system's ~10-fold increased sensitivity to apply EAD-based fragmentation for individual bile acids in sMRMHr analysis.
Figure 6 shows a section of the EAD-derived product ion spectrum for GCDCA and GDCA that were acquired as clean standards; the spectrum for GCDCA is inverted to highlight the differences between the spectra. Fragment ions of m/z 262.1403 and 316.1888 were found as distinct diagnostic ions for GDCA and GCDCA, respectively.
Red arrows highlight additional fragment ions that appear to be distinct to each bile acid isomer. Having many unique fragment ions may aid in quantitation, as fragment intensities can be added during quantitative processing in SCIEX OS software's Analytics module.
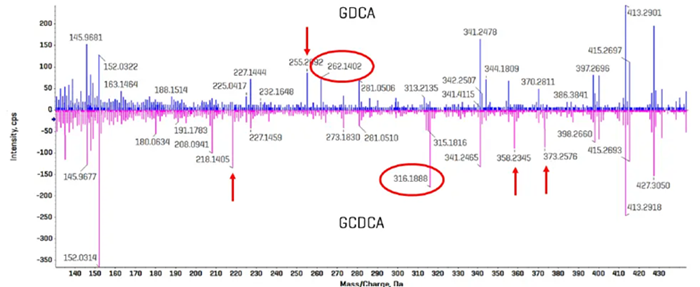
Figure 6. Comparison of EAD-based fragmentation of GDCA and GCDCA. A portion of the product ion spectra for GCDCA and GDCA is highlighted, with the spectrum for GDCA overlaid and inverted. Multiple fragments were identified for each bile acid isomer that appear to be unique and could serve as a selective fragment ion during analysis (red arrows). The fragment ions with m/z 262.1403 and 316.1888 were chosen for GDCA and GCDCA, respectively, due to their relatively high abundances. Image Credit: SCIEX
The bile acid standards were evaluated utilizing EAD-based fragmentation on a quicker 10-minute gradient. Figure 7, panel A, displays the elution profile of GCDCA and GDCA using clean standards, with a peak-to-peak retention time difference of around 12 s.
Panel B displays the product ion spectra, with the diagnostic ion clearly visible in each spectrum.
As shown in Panel C, the fragment panel app within the SCIEX OS Explore module presented two alternative fragment configurations. In Panel D, the XICs for GCDCA and GDCA demonstrate minimal to no interference when EAD-specific fragments are employed.
To determine whether this methodology can be utilized to assess bile acids in plasma, the same 10-minute, EAD-based procedure employed in Figure 7 was applied to human plasma extracts (Figure 1).
In the plasma matrix, unlike with neat standards, the isomers GCDCA and GDCA are not baseline resolved when employing a common fragment—in this example, the precursor-to-precursor MRMHr transition.
When the data was processed with the unique EAD-based pieces, the individual bile acids were totally resolved, allowing for precise quantification.
The ZenoTOF 8600 system measured bile acids in human plasma with approximately ten times the sensitivity of the ZenoTOF 7600 device, which used CID-based fragmentation.
For this assay, the choice is between maximizing sensitivity with the longer gradient in the negative ion mode with CID-based fragmentation and maximizing speed and specificity with the fast gradient using EAD-based fragmentation, which sacrifices ~100-fold sensitivity.
The EAD-based technique was suitable for biological analysis for the isomers in question, GDCA, GCDCA, and GUDCA. A study is now being conducted to evaluate amino acid conjugates of bile acids.
These compounds are detected in the positive ion mode and can be analyzed using a combination of CID- and EAD-based methods, with EAD used only when necessary to improve specificity.
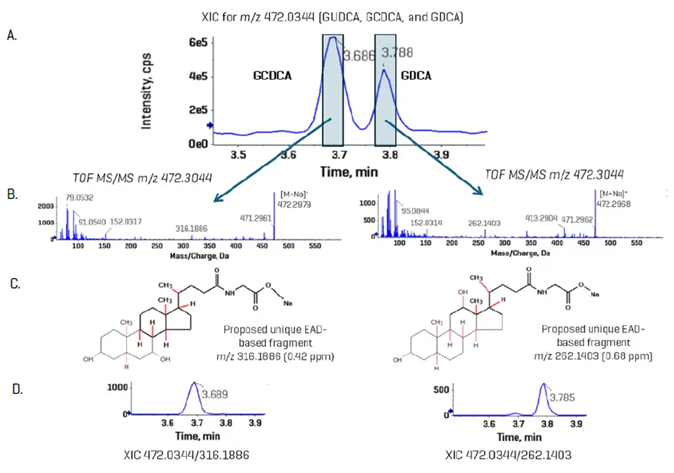
Figure 7. Resolution of bile acid isomers using EAD-based fragmentation. GCDCA and GDCA are bile acid isomers that have identical CID-based MS/MS spectra. Using EAD, unique, diagnostic fragments were observed for each isomer (A and B) in a standard mixture (6.56 nM). Using the fragments pane in SCIEX OS, structures for each fragment, m/z 316.1886 and 262.1403, were proposed for GUDCA and GDCA, respectively (C). Using a 10 mDa XIC window, panel D shows the improved specificity of the analysis for the two standard. Image Credit: SCIEX
Conclusion
The ZenoTOF 8600 system is approximately 20-fold more sensitive for analyzing bile acids than the ZenoTOF 7600 system. The small XIC window on HRMS systems allows for MS1-based data gathering without chemical background interferences.
EAD-based fragmentation enables structural characterization of compounds and eliminates the necessity for chromatographic separation of isomers for specificity.
References
- Collins, S.L., et al. (2022). Bile acids and the gut microbiota: metabolic interactions and impacts on disease. Nature Reviews Microbiology, (online) pp.1–12. https://doi.org/10.1038/s41579-022-00805-x.
- Lin, S., et al. (2023). Bile acids and their receptors in regulation of gut health and diseases. Progress in Lipid Research, 89, p.101210. https://doi.org/10.1016/j.plipres.2022.101210.
- SCIEX. (2024). Quantitative analysis and structural characterization of bile acids using the ZenoTOF 7600 system. (online) Available at: https://sciex.com/tech-notes/life-science-research/metabolomics/quantitative-analysis-and-structural-characterization-of-bile-ac.
- Liu, D., et al. (2023). Quantitative Detection of 15 Serum Bile Acid Metabolic Products by LC/MS/MS in the Diagnosis of Primary Biliary Cholangitis. Chemistry & Biodiversity, 20(3). https://doi.org/10.1002/cbdv.202200720.
- Gao, T., et al. (2023). Targeted LC-MS/MS profiling of bile acids reveals primary/secondary bile acid ratio as a novel biomarker for necrotizing enterocolitis. Analytical and Bioanalytical Chemistry, 416(1), pp.287–297. https://doi.org/10.1007/s00216-023-05017-7.
- Yang, J., et al. (2023). Study on the effect of calibration standards prepared with different matrix on the accuracy of bile acid quantification using LC-MS/MS. Journal of Pharmaceutical and Biomedical Analysis, 237, pp.115785–115785. https://doi.org/10.1016/j.jpba.2023.115785.
- Baba, T., et al. (2017). Development of a Branched Radio-Frequency Ion Trap for Electron Based Dissociation and Related Applications. Mass Spectrometry, 6(1), pp.A0058–A0058. https://doi.org/10.5702/massspectrometry.a0058.
- Baba, T., et al. (2016). In-depth sphingomyelin characterization using electron impact excitation of ions from organics and mass spectrometry. 57(5), pp.858–867. https://doi.org/10.1194/jlr.m067199.
- Baba, T., et al. (2016). Structural identification of triacylglycerol isomers using electron impact excitation of ions from organics (EIEIO). Journal of Lipid Research, 57(11), pp.2015–2027. https://doi.org/10.1194/jlr.m070177.
- Baba, T., et al. (2018). Quantitative structural multiclass lipidomics using differential mobility: electron impact excitation of ions from organics (EIEIO) mass spectrometry. Journal of Lipid Research, 59(5), pp.910–919. https://doi.org/10.1194/jlr.d083261.
- Baba, T., et al. (2017). Distinguishing Cis and Trans Isomers in Intact Complex Lipids Using Electron Impact Excitation of Ions from Organics Mass Spectrometry. Analytical Chemistry, 89(14), pp.7307–7315. https://doi.org/10.1021/acs.analchem.6b04734.
- SCIEX. (2024). Redefine bioanalysis with enhanced robustness on the SCIEX 7500+ system. (online) Available at: https://sciex.com/tech-notes/pharma/bioanalysis-pk/redefine-bioanalysis-with-enhanced-robustness-on-the-sciex-7500-plus-system.
About SCIEX
SCIEX mission is to deliver solutions for the precision detection and quantitation of molecules, empowering their customers to protect and advance the wellness and safety of all.
SCIEX has led the field of mass spectrometry for 50 years. From the moment we launched the first ever commercially successful triple quad in 1981, they have developed groundbreaking technologies and solutions that influence life-changing research and outcomes.
Today, as part of the Danaher family of global life science and technology innovators, they continue to pioneer robust solutions in mass spectrometry and capillary electrophoresis. But they don’t just develop products. It is what they do together with their customers that sets them apart. That’s why thousands of life science experts around the world choose SCIEX to get the answers they can trust to better inform critical decisions. Decisions that positively impact lives.
They proudly stand behind our tagline: The Power of Precision.
Sponsored Content Policy: News-Medical.net publishes articles and related content that may be derived from sources where we have existing commercial relationships, provided such content adds value to the core editorial ethos of News-Medical.Net which is to educate and inform site visitors interested in medical research, science, medical devices and treatments.