This article highlights the use of SCIEX ZenoTOF 8600 equipment for high-throughput quantitative proteomics analysis.
Using improved separations with the Evosep One system and high-sensitivity data-independent acquisition (DIA) of the ZenoTOF 8600 system, powered by ZT Scan DIA 2.0, up to 26,000 precursors and 4,000 protein groups were identified from 5 ng commercial human digest at 500 samples-per-day (SPD) throughput.
This provides a >5-fold improvement in precursor identifications and a >3-fold improvement in protein group identifications at similar loads compared to previous-generation instruments, allowing for higher proteome coverage in large-scale cohort analyses.
Key features of high-throughput quantitative proteomics on the ZenoTOF 8600 system
- The ZenoTOF 8600 system offers high-throughput quantitative proteomics with sensitivity improvements that result in LC-MS peak area gains of up to 10-fold compared to previous-generation instrumentation.
- ZT Scan DIA 2.0 allows for over 5-fold and 3-fold increases in quantitative identifications for precursors and protein groups, respectively.
- The ZenoTOF 8600 system has also improved ion transmission efficiency and advanced optical detection.
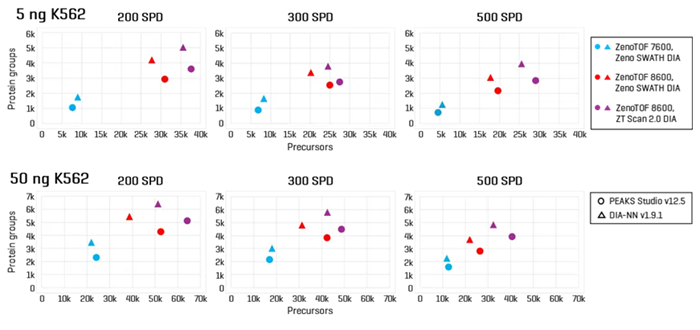
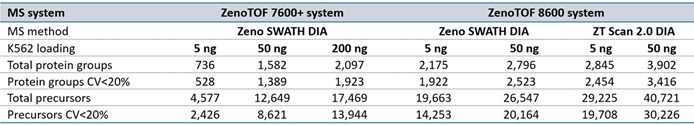
Figure 1. High-throughput identification of precursors and protein groups using the SCIEX ZenoTOF 8600 system. K562 sample loadings of 5 ng (top panes) or 50 ng (bottom panes) were analyzed at 200 SPD, 300 SPD, and 500 SPD with either Zeno SWATH DIA or ZT Scan 2.0 DIA on the ZenoTOF 8600 system. Results were compared against data acquired on the ZenoTOF 7600+ system using Zeno SWATH DIA. Data were processed using either PEAKS Studio or DIA-NN software. The results highlight significant gains in both precursor and protein group identifications using the ZenoTOF 8600 system. Using ZT Scan DIA 2.0 resulted in further gains in identifications compared to using Zeno SWATH DIA. Image Credit: SCIEX
Introduction
Given the widespread use of high-throughput proteomics in translational and clinical research, these procedures' sensitivity and quantitative accuracy must be carefully considered.
Quantitative proteomics is essential because it allows researchers to go beyond simply identifying proteins and analyze their quantity and expression, which is critical for understanding biological processes and detecting disease indicators.
Clinical investigations must be conducted on a large scale and using precise measurement methods to generate statistically significant results. As a result, next-generation proteomics research has focused on developing procedures capable of processing huge quantities of samples.
The SCIEX ZenoTOF 8600 system substantially advances high-resolution mass spectrometry (HR-MS). The combination of the OptiFlow Pro ion source, higher-efficiency ion capture, and an improved optical detector results in more than tenfold sensitivity gains over previous-generation HR-MS instruments.
ZT Scan DIA 2.0 isolates precursors using a constantly scanning quadrupole, giving customers more flexibility to fine-tune procedures for better qualitative and quantitative analysis than discrete-window DIA methods.
When paired with improved separation techniques on the Evosep One system, these ZenoTOF 8600 system innovations provide remarkable performance for quantitatively identifying peptides and proteins in complex samples at throughputs of up to 500 SPD.
Methods
To prepare the sample, Promega's Human K562 Lysate Tryptic Digest Standard was obtained and reconstituted with 0.1% formic acid in water. Samples (5 ng or 50 ng total) were placed onto Evotips following the Evosep technique.
Chromatography
Separations were performed on an Evosep One system utilizing optimized methods for 200, 300, and 500 SPD. All studies were conducted using an EV1182 column (4 cm x 150 µm, 1.9 µm particle size) heated to 40 °C. Samples were examined three times for all loads and gradient lengths.
Mass spectrometry
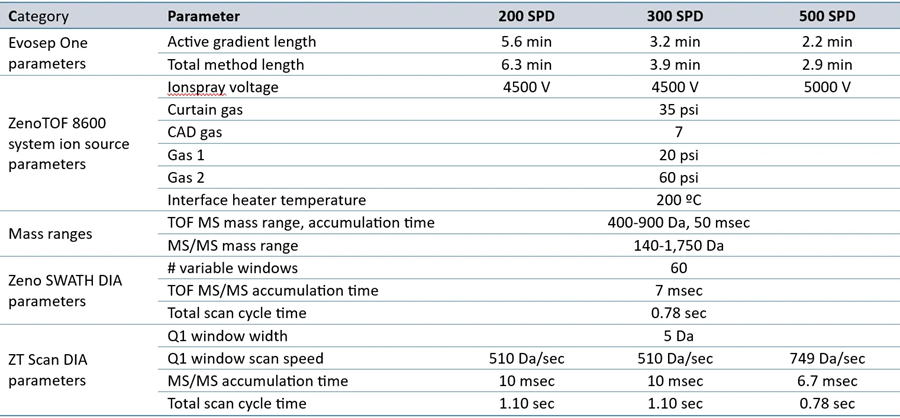
DIA analysis was performed on a ZenoTOF 8600 system with an ion source and a 1-10 µL/min microflow electrode. The Evosep column was linked to the microflow probe using a PEEK 1/16" nanotight union (IDEX). The method parameters are described in Table 1.
Data processing
DIA data was analyzed using DIA-NN version 1.9.11 or PEAKS Studio version 12.5 software to identify protein groups and precursors. Prior to processing with DIA-NN software, SCIEX data files (.wiff) were converted to .dia format using a research-grade data converter.
As previously described, database searches were carried out using a K562/HeLa spectral library.2
Default parameter settings were utilized, with the following exceptions: precursor m/z range was set to 400-900, fragment m/z range was set to 140-1750, and Match Between Runs (MBR) was enabled.
The quantification strategy was set to "Legacy" mode. ZT Scan DIA data was processed using the "--scanning-swath" command option. Existing ZenoTOF 7600+ system data files for 5 ng, 50 ng, and 200 ng K562 loadings at 200, 300, and 500 SPD4 were processed as described above to compare to ZenoTOF 8600 system performance.
Triplicate files for a specific loading, SPD method, and DIA method were searched simultaneously. Protein groups and precursors were found using the "pg_matrix.tsv" and "pr_matrix.tsv" files generated by the DIA-NN software.
A combination search was performed with PEAKS Studio software, employing the K562/HeLa collection and the human canonical FASTA protein sequences. Triplicate files for specific loading, SPD, and DIA methods were searched simultaneously.
The mass ranges were determined as described above. Carbamidomethylation (C) was defined as a permanent modification, whereas oxidation (M) and deamidation (N/Q) were designated as variable modifications.
The digest mode was set to semi-specific, with the number of missed cleavages set to one. The number of protein groups and precursors was calculated using the exported Protein CSV and Feature Vector CSV files, respectively.
Additional quantitation data was processed using SCIEX OS software's Analytics module. Fragment ions were used to quantify 15 random peptides from human proteins discovered in the K562 digest, with two fragment ions chosen for each peptide.
Table 1. LC-MS parameters used for this work. Source: SCIEX
Gains in quantitative identifications of protein groups and precursors on the ZenoTOF 8600 system
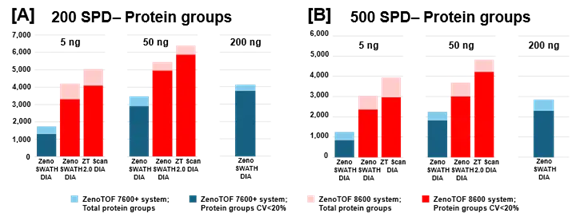
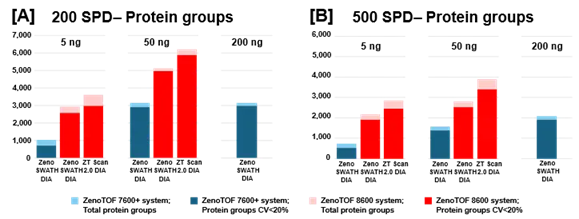
Figure 2. Summary of protein groups identified and quantified from K562 digest using the ZenoTOF 8600 system. K562 sample loadings of 5 ng or 50 ng were analyzed at 200 SPD (A) or 500 SPD (B), with either Zeno SWATH DIA or ZT Scan 2.0 DIA on the ZenoTOF 8600 system (red bars). Results were compared against data acquired on the ZenoTOF 7600+ system (blue bars). Data were processed using DIA-NN software. Notably, more protein groups were identified at 5 ng loadings on the ZenoTOF 8600 system than at 200 ng loadings on the ZenoTOF 7600+ system. Using ZT Scan DIA 2.0 resulted in further gains in identifications compared to using Zeno SWATH DIA. Image Credit: SCIEX
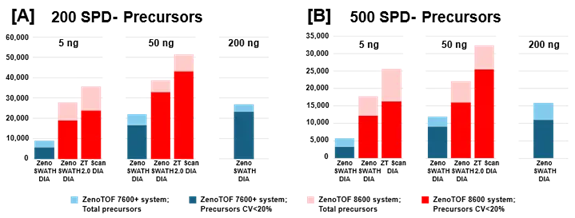
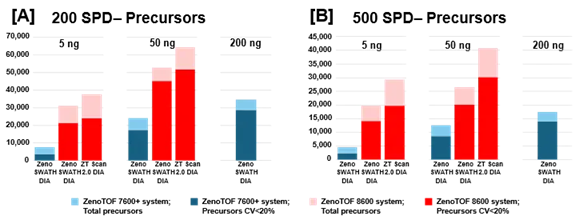
Figure 3. Summary of precursors identified and quantified from K562 digest using the ZenoTOF 8600 system. K562 sample loadings of 5 ng or 50 ng were analyzed at 200 SPD (A) or 500 SPD (B), with either Zeno SWATH DIA or ZT Scan 2.0 DIA on the ZenoTOF 8600 system (red bars). Results were compared against data acquired on the ZenoTOF 7600+ system (blue bars). Data were processed using DIA-NN software. Notably, more protein groups were identified at 5 ng loadings on the ZenoTOF 8600 system than at 200 ng loadings on the ZenoTOF 7600+ system. Using ZT Scan DIA 2.0 resulted in further gains in identifications compared to using Zeno SWATH DIA. Image Credit: SCIEX
Sample loadings of 5 and 50 ng K562 digest were evaluated with 200, 300, or 500 SPD on the Evosep One and ZenoTOF 8600 equipment.
Zeno SWATH DIA techniques used 60 variable-width windows and MS/MS accumulation times of 7 milliseconds. ZT Scan DIA 2.0 methods were also examined for these loadings, with a focus on acquisitions using the stated SPD method (Table 1).
Protein groups and precursors were compared to earlier data obtained using the ZenoTOF 7600+ technology and commercially available Evosep 200 SPD, 300 SPD, and 500 SPD techniques.3
Figure 2 summarizes the protein group identifications obtained from data processing using DIA-NN software.
The graph reveals that the ZenoTOF 8600 system outperforms the ZenoTOF 7600+ system for total protein groups and protein groups with CV <20% across replicates, at 5 ng and 50 ng loadings with 200 or 500 SPD. Supplemental Tables 1-3 summarize the protein groups for all investigations.
Similar increases were reported for precursor identifications, summarized in Figure 3. Significant gains were achieved for total precursors and those with CV <20% (Supplemental Tables 1-3).
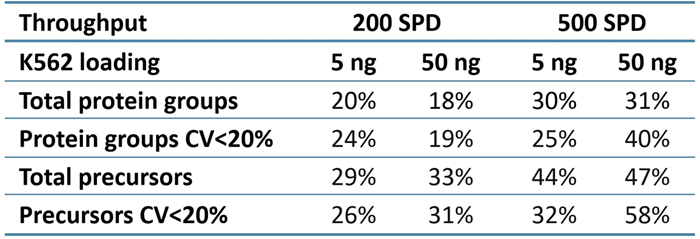
ZT Scan DIA 2.0 increased overall and quantitative identifications for sample loadings and throughputs (Table 2). The improvements were most noticeable at 500 SPD, with protein group gains of up to 40% and precursor gains of up to 58%.
This trend of ZT Scan DIA 2.0 providing improved benefits for combinations of higher loadings and throughputs is consistent with prior findings on the ZenoTOF 7600+ system.3,4 Figure 4 summarizes the CV distributions of protein groups discovered using ZT Scan DIA 2.0 on the ZenoTOF 8600 instrument.
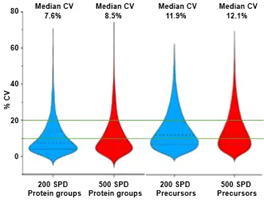
Figure 4. CV distributions for protein groups identified using ZT Scan DIA 2.0 on the ZenoTOF 8600 system. The median and quartile values are indicated in the graphs with dashed lines. The CV levels of 10% and 20% (generally accepted as thresholds for quantitative reproducibility) are indicated with green lines. Image Credit: SCIEX
Table 2. Improvements in protein group and precursor identifications using ZT Scan DIA 2.0 relative to Zeno SWATH DIA. Source: SCIEX
The direct comparison between identifications at 200 ng loadings on the ZenoTOF 7600+ system and lower loadings on the ZenoTOF 8600 system is worth noting.
Figures 2 and 3, as well as Supplemental Tables 1-3, reveal that the ZenoTOF 8600 system had a higher number of identifications at 5 ng loadings than the ZenoTOF 7600+ system at 200 ng loadings, owing to the ZenoTOF 8600 system's increased sensitivity.
Data files were also examined with PEAKS Studio software, which yielded fewer protein group identifications but more precursor identifications than DIA-NN software (Supplemental Figures 1 and 2, as well as Supplemental Tables 4-6).
Overall, the same overall trends were observed as with the DIA-NN software processing results, namely:
- Substantial improvements in total and quantitative protein groups and precursors using the ZenoTOF 8600 system relative to the ZenoTOF 7600+ system for a given loading and throughput
- ZT Scan DIA 2.0 improved the number of total and quantifiable protein groups and precursors over Zeno SWATH DIA on the ZenoTOF 8600 system
- More protein groups and precursors were identified and quantified from 5 ng loads on the ZenoTOF 8600 system than from 200 ng loads on the ZenoTOF 7600+ system
The discrepancies in the number of protein groups found using DIA-NN and PEAKS Studio software are most likely attributable to variances in protein inference conducted by the various software methods.
The higher number of precursors found using PEAKS Studio software is most likely due to the increased efficiency of identifications when employing a combination of spectral library and FASTA searches.
Sensitivity gains of the ZenoTOF 8600 system at the LC-MS peak and spectral level
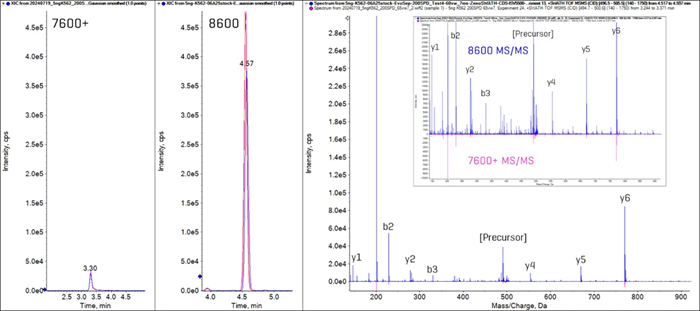
Figure 5. Sensitivity gains with the ZenoTOF 8600 system for peptide DLTFYLMK from cytoplasmic actin protein ACTB_HUMAN. Overlaid extracted ion chromatograms (XICs) of the y5 fragment ion from the 2+ precursor (499.75 Da → 669.33 Da) from triplicate injections of 200 ng K562 digest run at 200 SPD on the ZenoTOF 7600+ and prototype 200 SPD method on the ZenoTOF 8600 systems are shown in the left panels. The XIC peak areas increase 10-fold on the ZenoTOF 8600 system. The right panel shows the MS/MS spectrum for this peptide on the ZenoTOF 8600 system (blue trace) and the inverted MS/MS spectrum from the ZenoTOF 7600+ system (pink), demonstrating the difference in signal intensities. The inset is a zoomed-in view of the MS/MS spectra comparison. Image Credit: SCIEX
Figure 5 shows the sensitivity differences between the ZenoTOF 7600+ and 8600 systems, for example, peptides (DLTFYLMK from the cytoplasmic actin protein ACTB_HUMAN).
The Zeno SWATH DIA experiments for the ZenoTOF 7600+ and 8600 systems produce extracted ion chromatograms (XICs) for the y5 fragment ion from the 2+ charged precursor. The XIC peak area is ten times higher on the ZenoTOF 8600 system.
An overlay comparison of this peptide's MS/MS spectra reveals the degree of signal intensity changes across the fragment ion mass range between different systems.
Quantitation is heavily influenced by the quality of the LC-MS peak shape, which is determined by chromatographic separation. To investigate this further, fragment ion XICs were analyzed for two peptides from Zeno SWATH DIA studies done on the ZenoTOF 8600 system.
Figure 6 shows XICs for peptide fragment ions H2A1C_HUMAN.AGLQFPVGR.2+.y5 and H2B1L_HUMAN.LLLPGELAK.2+.y7 obtained from a 50 ng K562 digest conducted at 200, 300, and 500 SPD.
As expected, the number of data points at half-height falls as the LC technique accelerates, as peak widths narrow with sharper active gradients.
Even at 500 SPD throughput, at least three spots spanning the chromatographic peaks at half-height are obtained. This highlights the rapid acquisition speeds of the DIA techniques on the ZenoTOF 8600 system, which allow for robust quantification with great precision and accuracy.
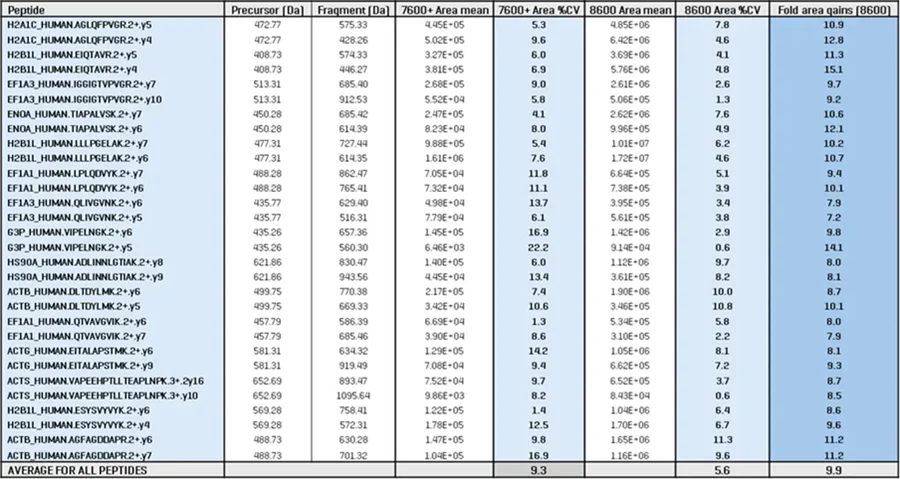
A panel of 15 peptides was chosen for a rigorous quantitative investigation of sensitivity increases using the ZenoTOF 8600 instrument (Table 3). Two fragment ions were selected for each peptide for the 5 ng K562 loadings at 200 SPD, and XIC peak area differences were evaluated between the ZenoTOF 7600+ and 8600 systems.
The repeatability (%CV) of triplicate injections was also compared. The table demonstrates that the average XIC peak area gain was 10-fold throughout this peptide panel, while the CVs across replicates improved from 9.3% on the ZenoTOF 7600+ system to 5.6% on the ZenoTOF 8600 system.
This indicates the effect of increased sensitivity on the quantitative reproducibility of the results, which is an important factor in total data quality.
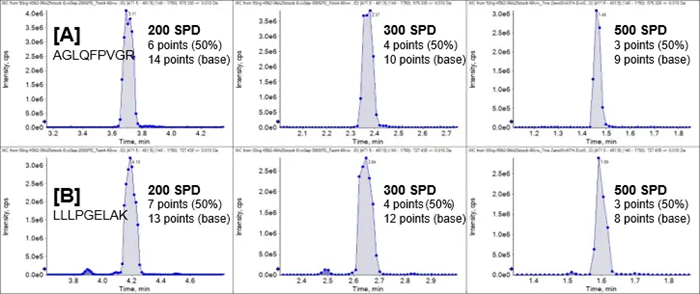
Figure 6. LC-MS peak shape and quality for reliable peptide quantitation at high throughput. K562 digest (50 ng) was run at 200 SPD, 300 SPD, and 500 SPD using Zeno SWATH DIA on the ZenoTOF 8600 system. Extracted ion chromatograms were generated for fragment ions from two peptides. (A, top panels) Peptide H2A1C_HUMAN.AGLQFPVGR.2+.y5, 472.77 Da → 575.33 Da. (B, bottom panels) Peptide H2B1L_HUMAN.LLLPGELAK.2+.y7, 477.31 Da → 727.44 Da. The number of data points at half-height and base is indicated for each peptide at each throughput level. Image Credit: SCIEX
Table 3. Quantitative analysis of a panel of peptides identified from 5 ng K562 digest run at 200 SPD using Zeno SWATH DIA on either the ZenoTOF 7600+ or ZenoTOF 8600 systems. Source: SCIEX
Overall, the ZenoTOF 8600 system is a substantial advancement in HR-MS mass spectrometry.
The OptiFlow Pro ion source, higher-efficiency ion capture, and an enhanced optical detector, along with the adaptability of the Zeno trap-enabled QTOF, result in >10-fold sensitivity enhancements in MS1 and MS2 compared to previous-generation HR-MS instrumentation.
Conclusions
The ZenoTOF 8600 system identified over 5x more precursors and 3x more protein groups at sample throughputs of up to 500 SPD compared to prior generation QTOF systems.
The ZenoTOF 8600 system identifies more precursors and protein groups in 5 ng sample loads than the ZenoTOF 7600+ system in 200 ng sample loads.
ZT Scan DIA 2.0 on the ZenoTOF 8600 system improves quantitative protein group and precursor identification by up to 58%.
Acknowledgments
The authors would like to acknowledge Evosep (Denmark) for their contributions to this work.
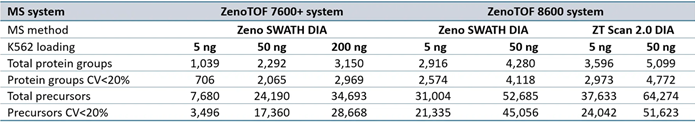
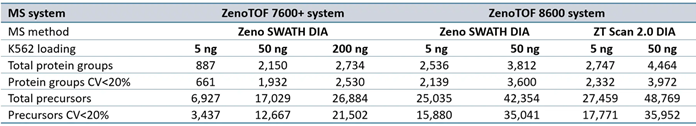
Supplemental Table 1. Summary of protein groups and precursors identified from DIA-NN software processing for data acquired at 200 SPD. Source: SCIEX
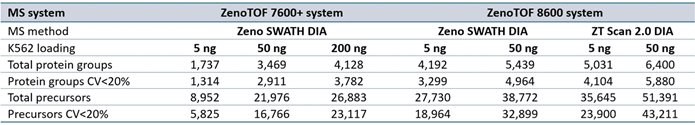
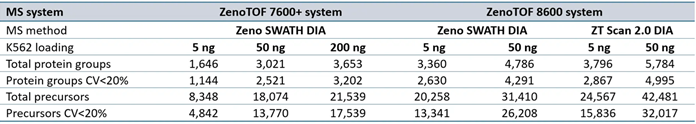
Supplemental Table 2. Summary of protein groups and precursors identified from DIA-NN software processing for data acquired at 300 SPD. Source: SCIEX
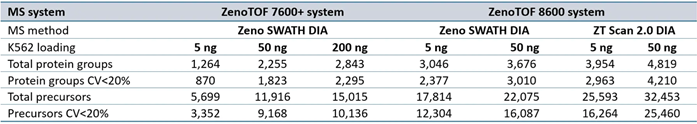
Supplemental Table 3. Summary of protein groups and precursors identified from DIA-NN software processing for data acquired at 500 SPD. Source: SCIEX
Supplemental Figure 1. Summary of protein groups identified and quantified from K562 digest using the ZenoTOF 8600 system with data processing using PEAKS Studio software. K562 sample loadings of 5 ng or 50 ng were analyzed at 200 SPD (A) or 500 SPD (B), with either Zeno SWATH DIA or ZT Scan DIA 2.0 on the ZenoTOF 8600 system (red bars). Results were compared against data acquired on the ZenoTOF 7600+ system (blue bars). Notably, more protein groups were identified at 5 ng loadings on the ZenoTOF 8600 system than at 200 ng loadings on the ZenoTOF 7600+ system. Using ZT Scan DIA 2.0 resulted in further gains in identifications compared to using Zeno SWATH DIA. Image Credit: SCIEX
Supplemental Figure 2. Summary of precursors identified and quantified from K562 digest using the ZenoTOF 8600 system with data processing using PEAKS Studio software. K562 sample loadings of 5 ng or 50 ng were analyzed at 200 SPD (A) or 500 SPD (B), with either Zeno SWATH DIA or ZT Scan DIA 2.0 on the ZenoTOF 8600 system (red bars). Results were compared against data acquired on the ZenoTOF 7600+ system (blue bars). Notably, more precursors were identified at 5 ng loadings on the ZenoTOF 8600 system than at 200 ng loadings on the ZenoTOF 7600+ system. Using ZT Scan DIA 2.0 resulted in further gains in identifications compared to using Zeno SWATH DIA. Image Credit: SCIEX
Supplemental Table 4. Summary of protein groups and precursors identified from PEAKS Studio software processing for data acquired at 200 SPD. Source: SCIEX
Supplemental Table 5. Summary of protein groups and precursors identified from PEAKS Studio software processing for data acquired at 300 SPD. Source: SCIEX
Supplemental Table 6. Summary of protein groups and precursors identified from PEAKS Studio software processing for data acquired at 500 SPD. Source: SCIEX
References
- Demichev, V., et al. (2019). DIA-NN: neural networks and interference correction enable deep proteome coverage in high throughput. Nature Methods, 17(1), pp.41–44. https://doi.org/10.1038/s41592-019-0638-x.
- Antonoplis, A., Morrice, N. and Hunter, C. p 1 Large-scale protein identification using microflow chromatography on the ZenoTOF 7600 system Cloud-based processing with the ProteinPilot application in OneOmics suite. (online) Available at: https://sciex.com/content/dam/SCIEX/tech-notes/life-science-research/proteomics/ruo-mkt-02-14415-a/Large-library_Protein-ID_7600_OneOmics_RUO-MKT-02-14415-A.pdf (Accessed 12 Jul. 2025).
- SCIEX. (2025). Selecting optimal ZT Scan DIA acquisition methods on the ZenoTOF 7600+ system for quantitative proteomics. (online) Available at: https://sciex.com/tech-notes/life-science-research/proteomics/Selecting-optimal-ZT-Scan-DIA-acquisition-methods-on-the-ZenoTOF-7600--system-for-quantitative-proteomics (Accessed 12 Jul. 2025).
- SCIEX. (2022). Improved proteomics performance at high throughput using ZT Scan DIA on the ZenoTOF 7600+ system. (online) Available at: https://sciex.com/tech-notes/life-science-research/proteomics/improved-proteomics-performance-at-high-throughput-using-zt-scan (Accessed 12 Jul. 2025).
About SCIEX
SCIEX mission is to deliver solutions for the precision detection and quantitation of molecules, empowering their customers to protect and advance the wellness and safety of all.
SCIEX has led the field of mass spectrometry for 50 years. From the moment we launched the first ever commercially successful triple quad in 1981, they have developed groundbreaking technologies and solutions that influence life-changing research and outcomes.
Today, as part of the Danaher family of global life science and technology innovators, they continue to pioneer robust solutions in mass spectrometry and capillary electrophoresis. But they don’t just develop products. It is what they do together with their customers that sets them apart. That’s why thousands of life science experts around the world choose SCIEX to get the answers they can trust to better inform critical decisions. Decisions that positively impact lives.
They proudly stand behind our tagline: The Power of Precision.
Sponsored Content Policy: News-Medical.net publishes articles and related content that may be derived from sources where we have existing commercial relationships, provided such content adds value to the core editorial ethos of News-Medical.Net which is to educate and inform site visitors interested in medical research, science, medical devices and treatments.