Widefield O-PTIR™ achieves sub-500 nm multimodal infrared microscopy using widefield fluorescence detection. The system achieves:
- High-speed chemical imaging of fluorescently labeled and autofluorescent samples
- Dynamic chemical imaging at up to five frames per second (fps)
- Single-wavelength chemical images captured in seconds, with hyperspectral arrays captured in minutes
About Widefield O-PTIR
Widefield O-PTIR™ is a new sub-micron IR, high-speed widefield chemical imaging approach designed to measure a wide variety of labeled and autofluorescent samples. It covers cellular, bacterial, and tissue applications.
A key advantage of widefield O-PTIR is its fast snapshot acquisition for single IR wavenumber and hyperspectral imaging. It can be up to 50× faster than standard O-PTIR, with typical acquisition times of one to 10 seconds for single-wavelength IR images and minutes for hyperspectral IR arrays. Measurement speeds can reach up to five fps for dynamic single-frequency chemical IR imaging.
FL-PTIR Interview With Craig Prater CTO 2024
Video Credit: Photothermal Spectroscopy Corp
Fluorescently labeled, autofluorescence, IR tagged, or label-free experiments
With mIRage-LS and Fluorescence based widefield O-PTIR, a wide range of experimental setups and sample types are supported; the options for life sciences measurements are endless.
Whether samples are fluorescently labeled, label-free, autofluorescent, or whether molecules with IR tags are being detected, mIRage-LS supports virtually all biological image contrast enhancement tools. As a result, the system offers a highly flexible vibrational spectroscopy platform for a broad range of life science research.
Label-free chemical imaging
For experiments where fluorescence labeling is not desired or when autofluorescence is absent, sub-500 nm O-PTIR enables true label-free chemical imaging. This relies on inherent chemical contrast obtained through direct detection of macromolecules such as proteins (including secondary structure), nucleic acids, lipids, carbohydrates, and more.
IR tags for enhanced molecular specificity
As researchers increasingly require the spatial specificity that labeling provides, IR tags are becoming more popular. IR tags offer the spatial specificity researchers want, while their lower molecular weight and size enable tracking and studying small-molecule metabolism without the perturbations that can occur with bulky conventional fluorescent labels.
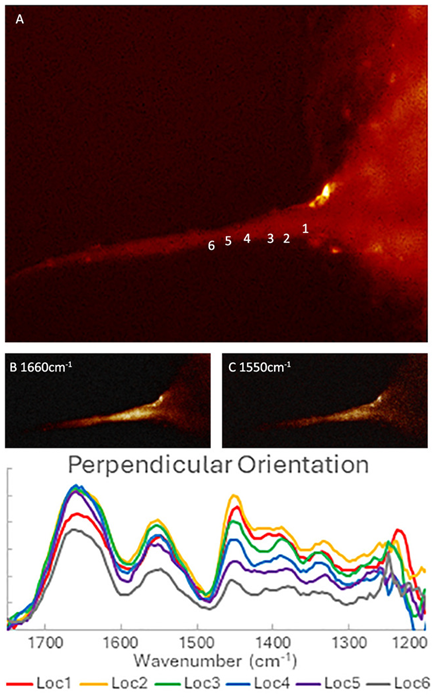
Widefield OPTIR measurements on an autofluorescent collagen fibril at different orientations. (A) Autofluorescent emission image of collagen fibril excited at 365 nm. (B-C) FL-PTIR absorption images at 1660 cm-1 and 1550 cm-1, respectively. (D) FL-PTIR spectra extracted from an IR hyperspectral image stack from the indicated regions of interest for IR radiation oriented substantially perpendicular (E) to the fibril. (Sample courtesy of Prof. K Gough, University of Manitoba). Image Credit: Photothermal Spectroscopy Corp
Want to know more? Get in touch here
Label-free measurement of autofluorescent samples
Autofluorescence: Researchers' new best friend
Until now, people using vibrational spectroscopy with Raman and fluorescence microscopy have often had to work around unwanted sample autofluorescence, which can be a significant interfering factor. With FL-PTIR, autofluorescence becomes an enabling factor and a sensitivity enhancer, providing a route to label-free chemical imaging across many biological sample types.
The video below shows the widefield O-PTIR imaging of live yeast cells in water:
- IR absorption at 1035 cm-1
- Fluorescently labeled using fluorescein diacetate, a living cell indicator
- Measurement of dynamics over 15 minutes (speed up 450×): two seconds per image
Video Credit: Photothermal Spectroscopy Corp
High-resolution and -quality spectroscopy and chemical imaging
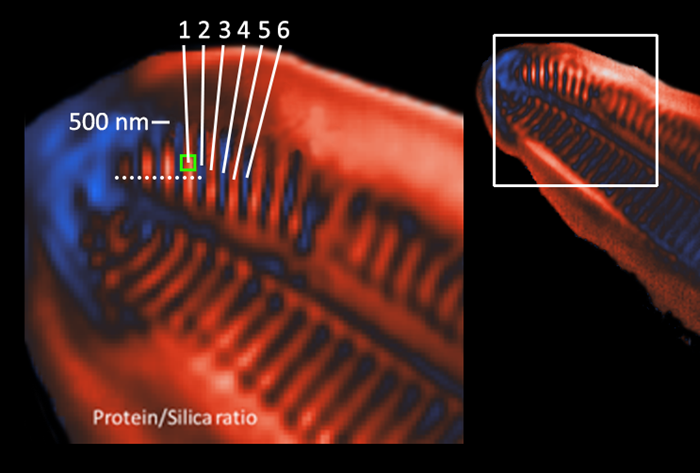
Diatom Image above: Image ratio at 1200/1072 cm-1 with an 80 cm-1 peak integration width. Green box shows size of 260 nm 2 × 2 pixel ROI used to calculate spectra below. The dashed line shows the approximate location of cross-section measurements. Image Credit: Photothermal Spectroscopy Corp
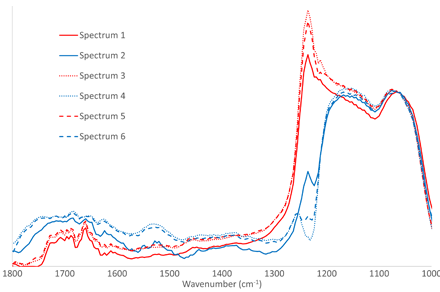
The IR spectra above are from 260 nm regions of interest with the positions indicated. Note both the substantial spectral variation over 260 nm length scales and spectral similarity in the alternating regions of the periodic structures (striae) in the diatom frustule. Spectra are normalized to 1072 cm-1. Image Credit: Photothermal Spectroscopy Corp
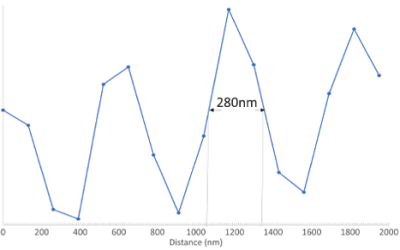
Demonstration of sub-500 nm spatial resolution. The plot above shows the intensity of the 1260 cm-1 IR band measured at single pixels along the white dashed line. Image Credit: Photothermal Spectroscopy Corp