This article is based on a poster originally authored by Xiaomin Du, Zhaozhao Wu, Jiawen Xu, Lingling Jiang, Xuyang Wang, and Fang He.
Drug-induced nephrotoxicity is a major cause of clinical trial failures and post-market withdrawals. Renal proximal tubule epithelial cells (RPTECs) are especially sensitive due to their function in drug secretion and reabsorption.
Cell painting, a multiplex fluorescence microscopy technique, captures hundreds of cellular features, including morphology, organelle distribution, and cytoskeletal architecture, to generate "phenotypic fingerprints" of drug-induced effects. Researchers used this approach to evaluate drug-induced nephrotoxicity in human RPTECs and combined the resulting phenotypic data with cell viability assays in renal tubuloids to develop predictive nephrotoxicity models. Together, these methods paint a more complete picture of nephrotoxicity than conventional viability assays alone.
Methods
- The cell painting assay involved treating human RPTEC cells with compounds for 48 hours. The cells were then stained with a panel of six fluorescent dyes to target specific cellular compartments: nuclei (Hoechst 33342), plasma membrane + Golgi apparatus (PhenoVue Fluor 555 - WGA), mitochondria (PhenoVue 641 Mitochondrial Stain), endoplasmic reticulum (PhenoVue Fluor 488 - Concanavalin A), nucleoli (PhenoVue 512 nucleic acid stain), and actin filaments (PhenoVue Fluor 568 - Phalloidin).
- Fluorescent pictures were captured using a high-content imaging system (Operetta CLS, PerkinElmer) at 40x magnification.
- Tubuloids from human adult kidneys were grown and treated with compounds for seven days. Cell viability assays (CellTiter-Glo) were performed, and IC50 values (concentrations causing 50% cell death) were calculated.
1. General workflow for cell painting assay
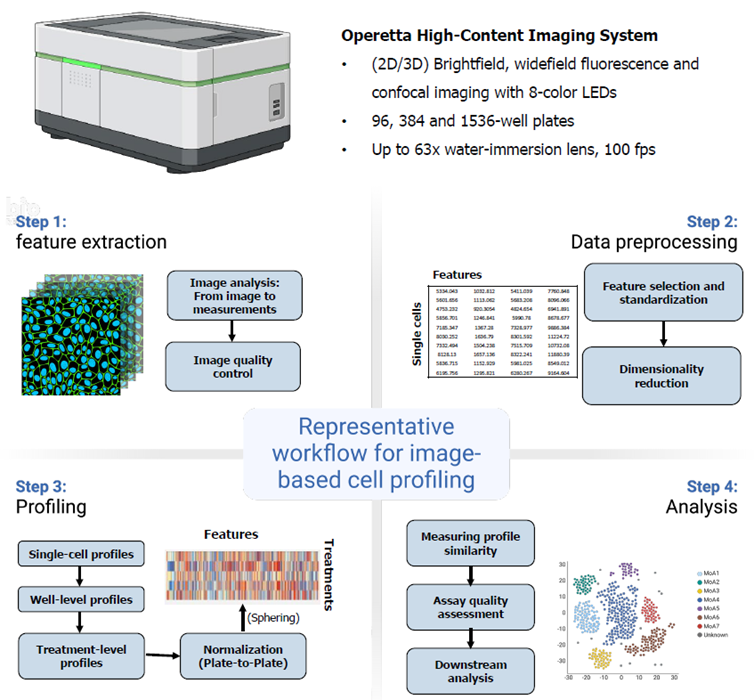
Image Credit: Pharmaron
2. Cell painting panel on human RPTEC cells and representative images
Source: Pharmaron
| Target |
Dye |
| Mitochondria |
PhenoVue 641 Mitochondrial Stain |
| Plasma membrane + Golgi apparatus |
PhenoVue Fluor 555 - WGA |
| Endoplasmic Reticulum |
PhenoVue Fluor 488 - Concanavalin A |
| Actin filaments |
PhenoVue Fluor 568 - Phalloidin |
| Nucleus |
PhenoVue Hoechst 33342 nuclear stain |
| Nucleoli |
PhenoVue 512 nucleic acid stain |
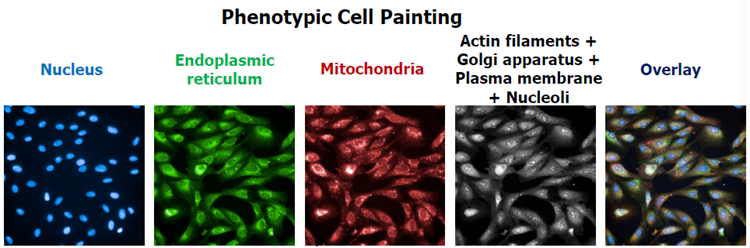
Image Credit: Pharmaron
The following is a summary of the fluorescent dyes used in the cell painting assay, as well as typical photos of vehicle (H2O)-treated RPTECs. The table shows each dye, its major cellular target, and the channel collected using the Operetta CLS high-content imaging equipment.
The panel of photos above shows the unique subcellular characteristics captured under basal conditions, which correlate to the fluorescent channels employed for phenotypic profiling.
3. Dose-dependent morphological feature changes of six compounds in RPTEC cells
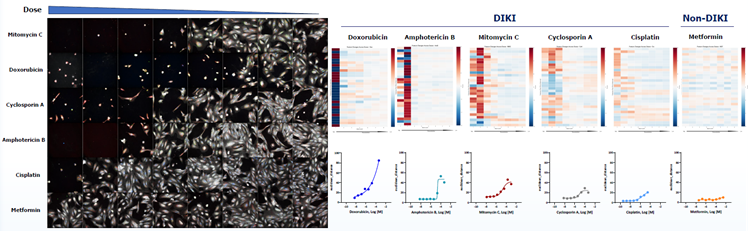
Dose-response analysis of six compounds using the cell painting assay. Image Credit: Pharmaron
- Left panel: Fluorescence images of RPTECs treated with six compounds in escalating doses over 48 hours. The images overlay multi-channel views from the cell painting experiment, demonstrating phenotypic alterations throughout a toxicity spectrum from powerful nephrotoxins.
- Right panel: The heatmap shows the top 30 most variable phenotypic traits across compound concentrations (from high to low, left to right). Values are row-normalized to show relative change. For each compound, the corresponding dose-response graphs show the aggregate phenotypic change (Euclidean distance) relative to vehicle control. DIKI: drug-induced kidney injury
4. Clustering of compounds by phenotypic profile similarity
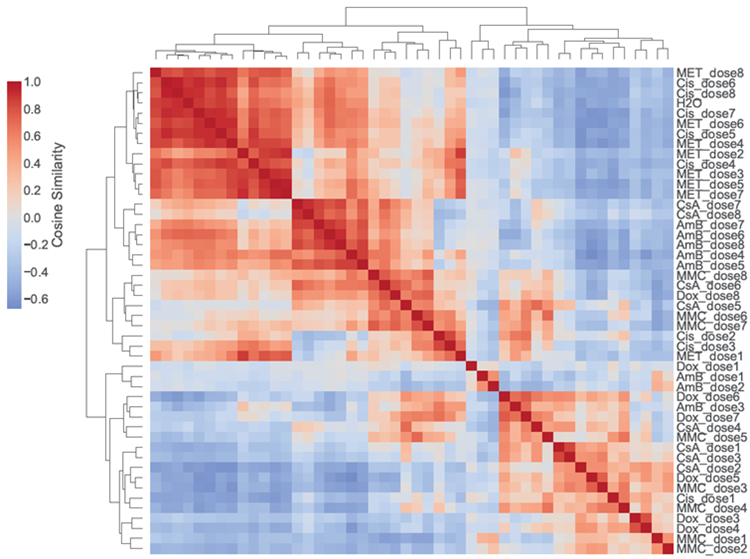
Heatmap of compounds clustered according to comparable cellular responses in human RPTEC. Image Credit: Pharmaron
The color scale represents the pairwise similarity between the phenotypic profiles of each compound-dose combination determined using cosine similarity. The dendrogram shows the clustering of conditions that exhibit similar multiparametric phenotypic responses.
5. The human tubuloid assay can predict DIKI risk
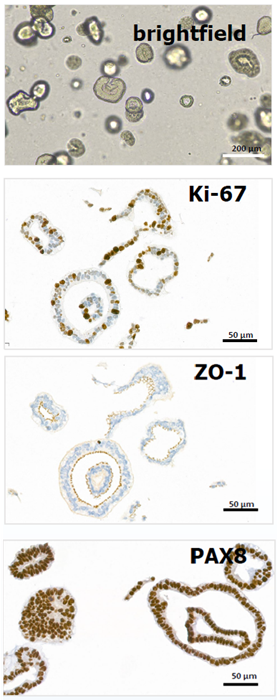
Image Credit: Pharmaron
Source: Pharmaron
| Compound |
Literature |
Experimental |
| Category |
Cmax' µM* |
IC50' µM |
IC50/Cmax |
| Mitomycin C |
DIKI |
1.77 |
0.016 |
0.009 |
| Carboplatin |
DIKI |
67.3 |
15.7 |
0.2 |
| Oxaliplatin |
DIKI |
4.37 |
3.6 |
0.8 |
| Cisplatin |
DIKI |
7.47 |
2.4 |
0.3 |
| Rifampicin |
DIKI |
12.2 |
14.8 |
1.2 |
| Pentamidine |
DIKI |
0.9 |
3.0 |
3.3 |
| Zoledronic acid |
DIKI |
0.97 |
8.6 |
8.8 |
| Vancomycin |
DIKI |
38 |
150 |
3.9 |
| Tenofovir |
DIKI |
0.93 |
>125 |
>100 |
| Gentamicin |
DIKI |
15.7 |
2045.5 |
130.3 |
| Omeprazole |
DIKI |
3.18 |
83.9 |
26.4 |
| Tetracycline |
DIKI |
3.67 |
46.8 |
12.7 |
| Doxorubicin |
DIKI |
0.04 |
0.004 |
0.1 |
| Cyclosporin A |
DIKI |
0.21 |
4.0 |
18.8 |
| Amphotericin B |
DIKI |
1.52 |
4.8 |
3.1 |
| Ifosfamide |
DIKI |
199 |
5143.0 |
25.8 |
| Adefovir |
DIKI |
0.07 |
>250 |
>100 |
| Tacrolimus |
DIKI |
0.03 |
20.2 |
673.2 |
| Phenacetin |
Non-DIKI |
38.4 |
1290.5 |
33.6 |
| Ciprofloxacin |
Non-DIKI |
12.1 |
>200 |
>100 |
| Lisinopril |
Non-DIKI |
0.09 |
>1000 |
>100 |
| Isoproterenol HCl |
Non-DIKI |
0.95 |
245.5 |
258.4 |
| Mannitol |
Non-DIKI |
43.1 |
>1000 |
>100 |
| Metformin |
Non-DIKI |
12.4 |
>3000 |
>100 |
| Thiamine |
Non-DIKI |
6.8 |
>2000 |
>100 |
| Dexamethasone |
Non-DIKI |
0.68 |
>1000 |
>100 |
| Atropine |
Non-DIKI |
0.09 |
375.4 |
4171.4 |
| Pindolol |
Non-DIKI |
0.2 |
>1000 |
>100 |
*Cmax values are from Schulz. M. et al., Crit Care.(2012)16: R136
Sensitivity: 77.8%
Specificity: 90.0%
- Left panel: Human adult kidney tubuloids expressed epithelial markers such as Ki-67, ZO-1, and PAX8.
- Right panel: The CellTiter-Glo assay was used to assess cell viability in human tubuloids after seven days of compound exposure. Compounds having an IC50/Cmax ratio <100 were considered DIKI positive.
Conclusion
- The cell painting assay detects subtle phenotypic changes, including altered mitochondrial intensity, endoplasmic reticulum fragmentation, and actin cytoskeleton disorganization.
- Cell painting revealed distinct clustering of nephrotoxic and non-nephrotoxic compounds based on their phenotypic profiles. Aggregate phenotypic changes were assessed using Euclidean distance to support compound profiling.
- 3D human tubuloid models demonstrated good sensitivity and specificity for distinguishing between nephrotoxic and non-nephrotoxic compounds.
Acknowledgments
Produced using materials originally authored by Xiaomin Du, Zhaozhao Wu, Jiawen Xu, Lingling Jiang, Xuyang Wang, and Fang He from Pharmaron Beijing Co., Ltd.
About Pharmaron
Pharmaron is a premier R&D service provider for the life sciences industry. Founded in 2004, Pharmaron has invested in its people and facilities, and established a broad spectrum of research, development and manufacturing service capabilities throughout the entire drug discovery, preclinical and clinical development process across multiple therapeutic modalities, including small molecules, biologics and CGT products. With over 17,000 employees and operations in China, the U.S., and the U.K., Pharmaron has an excellent track record in the delivery of R&D solutions to its partners in North America, Europe, Japan and China.
Sponsored Content Policy: News-Medical.net publishes articles and related content that may be derived from sources where we have existing commercial relationships, provided such content adds value to the core editorial ethos of News-Medical.net, which is to educate and inform site visitors interested in medical research, science, medical devices and treatments.
Last Updated: Oct 27, 2026