This article is based on a poster originally authored by Jiawen Xu, Zhaozhao Wu, Bei Hu, Ruting Feng, Yuhui Wang, Pengwei Pan, and Fang He.
Drug-induced liver injury (DILI) remains a major challenge in pharmaceutical development, demonstrating the need for more predictive and physiologically relevant testing approaches.
While standard 2D primary human hepatocyte (PHH) cultures are commonly used for high-throughput toxicity screening, they quickly lose key characteristics of mature human liver cells, making them less physiologically relevant. In contrast, 3D PHH spheroid models more closely resemble the native liver, supporting long-term phenotypic stability and enhanced metabolic performance. However, conventional approaches in both 2D and 3D liver models focus on viability endpoints, which provide minimal insights into cellular morphological changes.
In this article, the authors explore how cell painting can complement viability assays in 2D and 3D PHH models used to predict drug-induced liver injury.
Methods
- PHHs were cultured as 2D monolayers and self-assembled 3D spheroids. Both models were treated with a panel of FDA-categorized DILI compounds, representing different concern levels across six concentrations ranging from sub-cytotoxic to cytotoxic.
- The CellTiter-Glo (CTG) assay was used to test cytotoxicity and determine IC50 values.
- The cell painting test used a multiplexed staining panel. The Operetta CLS system was used to collect high-content images, and quantitative morphological features were extracted to generate phenotypic profiles for both culture types.
1. Workflow of cell painting experiment
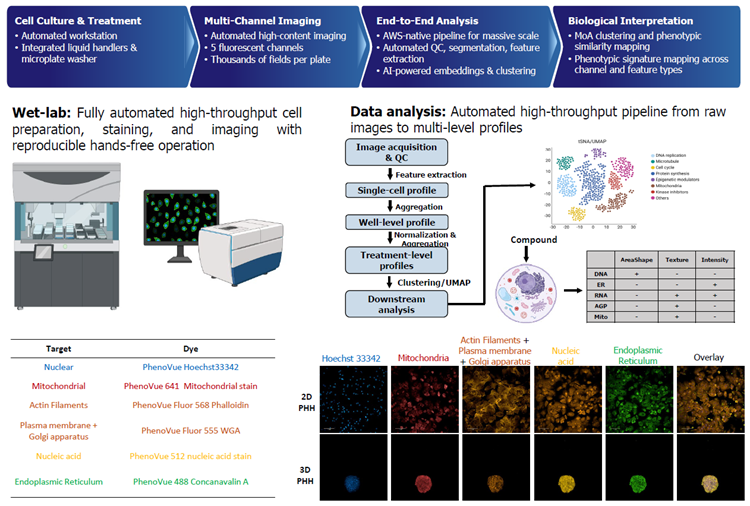
Image Credit: Pharmaron
2. 3D PHHs outperform 2D PHHs in DILI sensitivity using the CellTiter-Glo assay
Source: Pharmaron
| No. |
Compound
ID |
Cmax (µM) |
DILI
Positive/ Negative1 |
vDILIConcern2 |
Severity Class2 |
2D PHH (24 hrs) |
Prediction Outcome (MOS=50*)2 |
3D PHH (7 days) |
Prediction
Outcome
(MOS=50*)2 |
Sensitivity
in 3D
vs 2D |
A_IC50
(µM) |
Max %
Inh |
IC50/
Cmax |
A_IC50
(µM) |
Max %
Inh |
IC50/
Cmax |
| 1 |
Amiodarone |
5 |
POS |
vMost-DILI-Concern |
8 |
382.97 |
40.9 |
76.59 |
FN |
8.51 |
92.16 |
1.70 |
TP |
3D>2D |
| 2 |
Ketoconazole |
11.29 |
POS |
vMost-DILI-Concern |
8 |
195.2 |
29.96 |
17.29 |
TP |
8.88 |
100.02 |
0.79 |
TP |
3D>2D |
| 3 |
Tolcapone |
47.58 |
POS |
vMost-DILI-Concern |
8 |
107.79 |
86.23 |
2.27 |
TP |
31.78 |
100.77 |
0.67 |
TP |
3D>2D |
| 4 |
Sitaxsentan |
30 |
POS |
vMost-DILI-Concern |
8 |
372.7 |
99.55 |
12.42 |
TP |
91.6 |
100 |
3.05 |
TP |
3D>2D |
| 5 |
Flutamide |
5.43 |
POS |
vMost-DILI-Concern |
8 |
>200 |
13.04 |
>36.83 |
FN |
54.16 |
100.02 |
9.97 |
TP |
3D>2D |
| 6 |
Troglitazone |
6.4 |
POS |
vMost-DILI-Concern |
8 |
33.88 |
100.19 |
5.29 |
TP |
38.06 |
98.24 |
5.95 |
TP |
3D≈2D |
| 7 |
Paroxetine |
0.2 |
POS |
vLess-DILI-Concern |
8 |
3.99 |
99.82 |
19.95 |
TP |
2.26 |
100.07 |
11.30 |
TP |
3D≈2D |
| 8 |
Bosentan |
7.43 |
POS |
vMost-DILI-Concern |
7 |
423.15 |
92.22 |
56.95 |
FN |
40.88 |
100.09 |
5.50 |
TP |
3D>2D |
| 9 |
Acetaminophen |
136 |
POS |
vMost-DILI-Concern |
5 |
3629.13 |
16.25 |
26.68 |
TP |
1221.99 |
60.77 |
8.99 |
TP |
3D>2D |
| 10 |
Mexiletine |
35 |
POS |
vMost-DILI-Concern |
3 |
176.48 |
93.24 |
5.04 |
TP |
187.08 |
97.29 |
5.35 |
TP |
3D≈2D |
| 11 |
Bepridil |
2 |
POS |
Not listed |
/ |
45.77 |
46.89 |
22.89 |
TP |
16.19 |
99.97 |
8.09 |
TP |
3D>2D |
| 12 |
Pioglitazone |
3.3 |
POS |
vLess-DILI-Concern |
3 |
>150 |
7.57 |
>45 |
FN |
>150 |
31.24 |
>45 |
FN |
3D=2D |
| 13 |
Quinidine |
8.66 |
POS |
vLess-DILI-Concern |
3 |
202.87 |
88.52 |
23.43 |
TP |
79.23 |
100.02 |
9.15 |
TP |
3D>2D |
| 14 |
Chlorpromazine |
0.94 |
POS |
vLess-DILI-Concern |
2 |
38.52 |
92.24 |
40.98 |
TP |
27.2 |
100 |
28.94 |
TP |
3D>2D |
| 15 |
Bumetanide |
0.08 |
NEG |
Ambiguous DILI-concern |
3 |
>20 |
5.57 |
>250 |
TN |
>20 |
24.7 |
>250 |
TN |
3D=2D |
| 16 |
Propranolol |
0.2 |
NEG |
Ambiguous DILI-concern |
3 |
>20 |
8.57 |
>100 |
TN |
>20 |
26.56 |
>100 |
TN |
3D=2D |
| 17 |
Hydrocortisone |
0.84 |
NEG |
vNo-DILI-Concern |
0 |
>100 |
3 |
>119 |
TN |
>100 |
-1.47 |
>119 |
TN |
3D=2D |
| 18 |
Acetylcysteine |
2.45 |
NEG |
vNo-DILI-Concern |
0 |
>500 |
0.45 |
>204 |
TN |
>500 |
-21.61 |
>204 |
TN |
3D=2D |
| 19 |
Digoxin |
0.005 |
NEG |
vNo-DILI-Concern |
0 |
0.12 |
90.1 |
24.00 |
FP |
0.15 |
99.92 |
30.00 |
FP |
3D≈2D |
|
|
|
|
|
|
|
|
Sensitivity |
71.4% |
|
|
Sensitivity |
92.9% |
|
|
|
|
|
|
|
|
|
Specificity |
80.0% |
|
|
Specificity |
80.0% |
|
Cell viability was evaluated by the CellTiter-Glo assay in 2D PHHs (24 hours) and 3D PHHs (seven days)
Drugs were designated as DILI-positive or DILI-negative according to the FDA’s drug-induced liver injury severity and toxicity classification1,2. True positives (TP) are DILI-positive drugs correctly predicted to be hepatotoxic using the cell viability assay. False positives (FP) are DILI-negative drugs incorrectly predicted to be hepatotoxic. True negatives (TN) are DILI-negative drugs correctly predicted to be non-hepatotoxic. False negatives (FN) are DILI-positive drugs incorrectly predicted to be non-hepatotoxic. *MOS: Margin of safety; IC50/Cmax ratio = 50.
- The FDA's drug-induced liver injury severity and toxicity (DILIst) categorization determines whether DILI is considered positive or negative. This dataset is available at https://www.fda.gov/science-research/liver-toxicity-knowledge-base-ltkb/drug-induced-liver-injury-severity-and-toxicity-dilist-dataset.
- The level of DILI concern is described by the FDA's drug-induced liver injury rank (DILIrank 2.0). The dataset is available at https://www.fda.gov/science-research/liver-toxicity-knowledge-base-ltkb/drug-induced-liver-injury-rank-dilirank-20-dataset.
3. Dose-dependent morphological changes and phenotypic profile similarity of DILI-positive and DILI-negative compounds in 2D PHHs
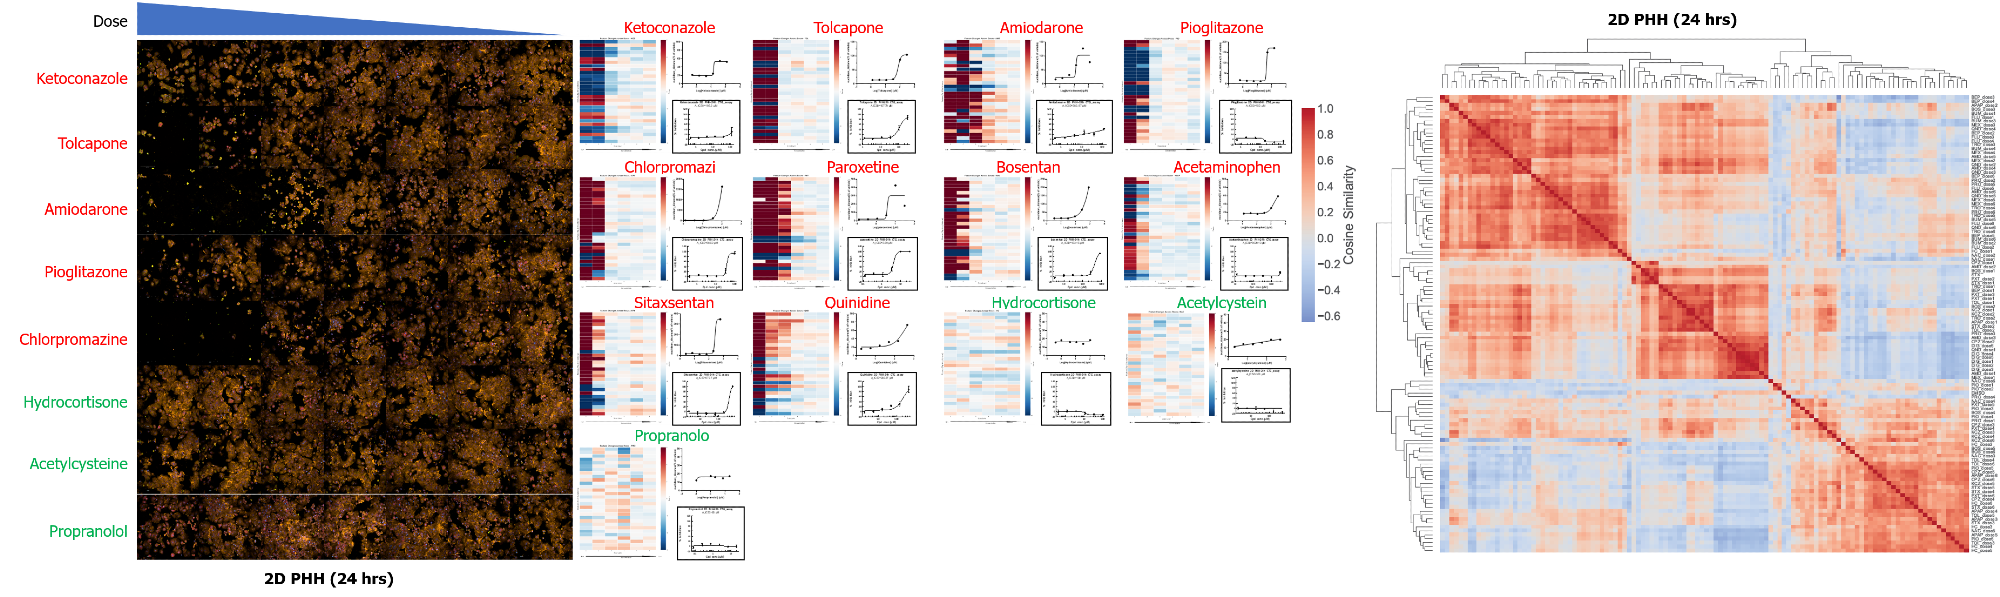
Phenotypic profiling matches or exceeds viability assay in detecting DILI. Image Credit: Pharmaron
- Left panel: The cell painting assay revealed dose-dependent morphological alterations in 2D PHHs after 24-hour treatment with DILI-positive (red) and DILI-negative (green) drugs.
- Middle panel: The heatmap (right) shows the top 30 most variable phenotypic characteristics across compound concentrations (high to low, left to right), with row-normalized data to visualize relative changes.
The corresponding dose-response graphs depict aggregate phenotypic changes (Euclidean distance; upper right) and cell viability (CTG assay; bottom right). In this example, phenotypic changes revealed sensitivity for DILI detection comparable to, or exceeding, the cell viability assay in 2D PHHs (e.g., tolcapone and pioglitazone).
- Right panel: Hierarchical clustering of compound-dose combinations based on similar phenotypic profiles. The color scale shows pairwise cosine similarity, while dendrograms group conditions with similar multiparametric responses.
DMSO and most non-hepatotoxic drugs (HC, PRO, NAC) clustered together across doses, while a few high-dose treatments grouped with hepatotoxic drugs, suggesting nonspecific effects. Known hepatotoxic drugs formed a separate toxic cluster at higher doses, with lower doses clustering closer to the non-toxic controls. These patterns reflect dose-dependent responses, while sub-clustering within the toxic cluster suggests underlying differences in mechanism of action.
4. Clustering of compounds by phenotypic profile similarity in 3D PHHs
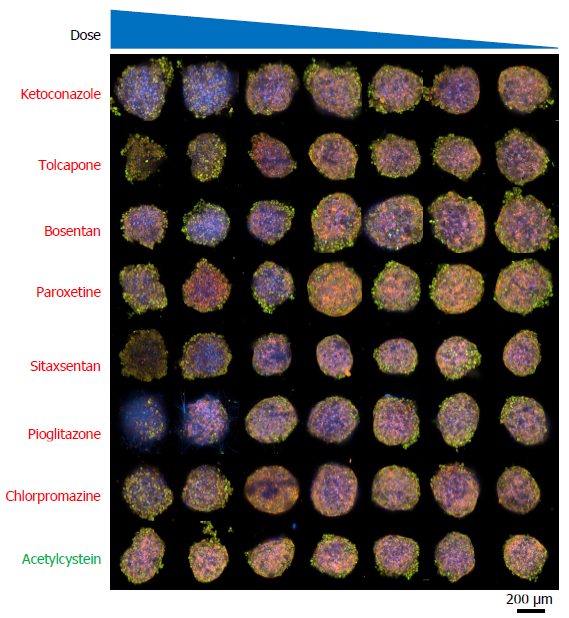
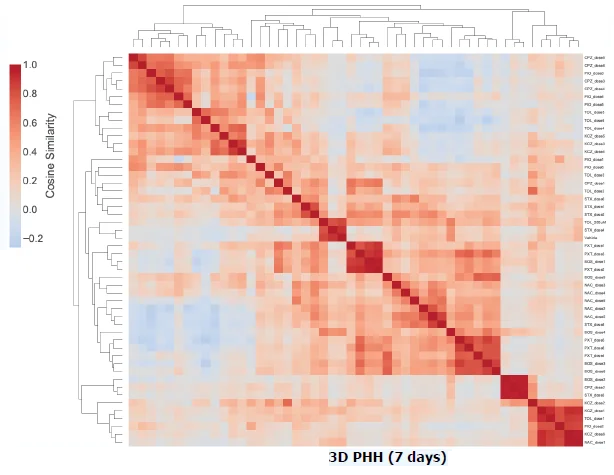
Image Credit: Pharmaron
- Upper panel: Cell painting assay imagesreveal dose-dependent morphological alterations in 3D PHHs following seven days of treatment with DILI-positive (red) and DILI-negative (green) drugs.
- Bottom panel: Compound-dose combinations clustered by phenotypic profile similarity in 3D PHHs. The color scale represents pairwise cosine similarity, while dendrograms group circumstances that display related multiparametric phenotypic responses.
Conclusion
- Cell painting can identify morphological changes at or below cytotoxic concentrations, complementing traditional viability assays by offering additional biological context and mechanistic understanding (e.g., mitochondrial damage).
- Phenotypic profiling in 2D PHHs has comparable or higher sensitivity for drug-induced liver injury (DILI) than viability readouts (e.g., tolcapone, pioglitazone), supporting its potential as an early and informative toxicity screen.
- Integrating cell painting with viability data allows for multi-dimensional assessment. The 2D vs. 3D comparison emphasizes the significance of physiologically relevant models in capturing complicated toxicological responses.
Acknowledgments
Produced using materials originally authored by Jiawen Xu, Zhaozhao Wu, Bei Hu, Ruting Feng, Yuhui Wang, Pengwei Pan, and Fang He from Pharmaron Beijing Co., Ltd.
About Pharmaron
Pharmaron is a premier R&D service provider for the life sciences industry. Founded in 2004, Pharmaron has invested in its people and facilities, and established a broad spectrum of research, development and manufacturing service capabilities throughout the entire drug discovery, preclinical and clinical development process across multiple therapeutic modalities, including small molecules, biologics and CGT products. With over 17,000 employees and operations in China, the U.S., and the U.K., Pharmaron has an excellent track record in the delivery of R&D solutions to its partners in North America, Europe, Japan and China.
Sponsored Content Policy: News-Medical.net publishes articles and related content that may be derived from sources where we have existing commercial relationships, provided such content adds value to the core editorial ethos of News-Medical.net, which is to educate and inform site visitors interested in medical research, science, medical devices and treatments.
Last Updated: Oct 27, 2026