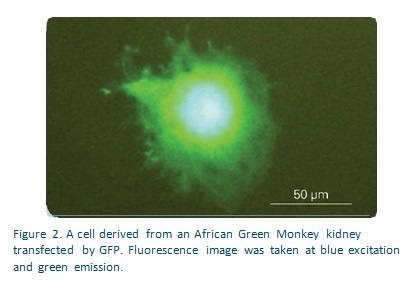
Living cells frequently show altered mechanical properties following infection and disease. It is possible to detect whether and how any given cell is affected using quantitative tests of the mechanical stiffness of the cell membrane on a nanoscale. The Bruker Hysitron® TI Series TriboIndenter® has a fluorescent microscope option which allows the user to detect transfected cells containing green fluorescent protein (GFP) placed into phosphate buffered saline (PBS) solution.
It is difficult to detect the first contact between the flat end of the probe with the soft cell membrane. The force of contact is quite small compared to the meniscus forces of the PBS and the membrane adhesion forces acting on the probe. Thus, it is necessary to monitor the phase shift during oscillatory approach to detect the point of initial contact clearly.
Bruker’s transducer is lightweight and its high sensitivity and dynamic properties enable minute high-frequency oscillatory forces to be superposed on the approach signal caused by a quasi-static force. If the phase shift shows discontinuity the signal indicates that contact conditions have been altered.
Procedure
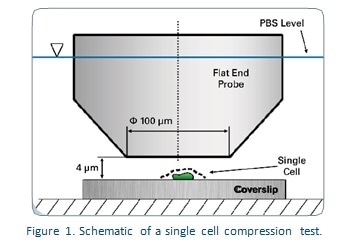
For this experiment a single cell was tested using a Hysitron TI Series TriboIndenter to apply compression tests using a diamond fluid cell 90° conical probe with a 100 μm flat end. The tested cells were kept in PBS to ensure that the conditions conformed to nature. The transducer was calibrated to ensure constant dynamic characteristics throughout the whole range of displacement when it remained in contact with the PBS. Individual cells were detected by integrated fluorescence microscopy. They were then placed about 1-2 microns from the lower surface of the flat end probe as shown in Figure 1.
The nanoDMA® III technique used in the Hysitron was chosen to allow even very low frequencies of oscillatory probe approaches. As the flat end probe moves towards the cell membrane, the phase shift of the force of oscillation and the amplitude of displacement are monitored by the lock-in amplifier. The accuracy of the data depends upon detecting this initial contact, because it is the basis on which the compressive force-displacement curve is offset. Test compression is produced by force-controlled nanoDMA indentation, beginning from an out-of-contact point.
Results
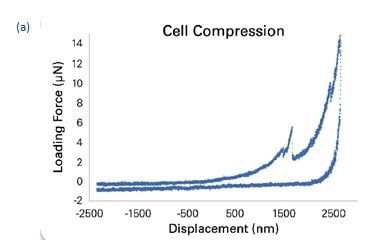
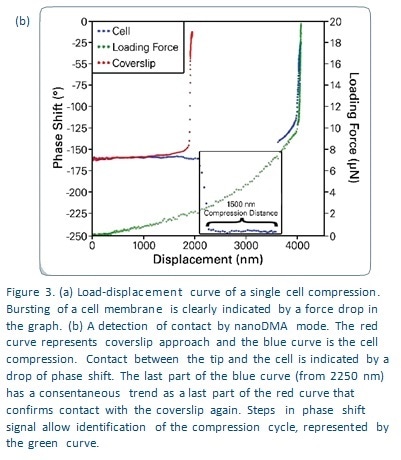
Compressive loading was measured at 0.5 μN/s with an AC load amplitude of 0.3 μN at 200 Hz. To ensure that contact with the cell membrane was distinguished from contact with the glass coverslip, an approach to the latter was made while independently measuring the phase shift signal, as shown in Figure 3b. It is seen that the transducer’s dynamic calibration in PBS correlates with a phase shift of about -160°, which increases to -15° when contact is made with the coverslip, as shown on the red curve. On the other hand a reduction in phase shift to -250° indicates contact with adhesion to the cell membrane following cell compression, as seen in the blue curve. The phase shift difference is used to calculate both the start and the end of cell compression with accuracy. This allows the total deformation of the membrane to be calculated. In the current experiment it was 1500 nm as seen in Figure 3b. When the cell bursts, it can be detected by the force drop in the load/displacement data which is shown in Figure 3a.
Conclusions
The initial contact between the probe and cell membrane must be identified accurately to allow load-displacement data to be interpreted rightly. This is done in this case by using the quasi-static approach force on which is superimposed a minute dynamic oscillation. Bruker has a transducer technology that is actuated by electrostatic force to give high sensitivity to force and a low noise floor, which lets it operate accurately even when the load is only a few micronewtons. The device also has a directly fitted fluorescence microscope which can allow single cells to be visualized and positioned precisely. The bursting force and stiffness of the cell membrane were measured by the generated load-displacement curves. These curves are also useful in quantifying these parameters for comparison in any future studies.
References
- Sepitka, J., Grznarova, P., Fuzik, T., and Lukeš, J., Computer Methods in Biomechanics and Biomedical Engineering (2014).
About Bruker Nano Surfaces and Metrology

Bruker’s suite of fluorescence microscopy systems provides a full range of solutions for life science researchers. Their multiphoton imaging systems provide the imaging depth, speed and resolution required for intravital imaging applications, and their confocal systems enable cell biologists to study function and structure using live-cell imaging at speeds and durations previously not possible. Bruker’s super-resolution microscopes are setting new standards with quantitative single molecule localization that allows for the direct investigation of the molecular positions and distribution of proteins within the cellular environment. And their Luxendo light-sheet microscopes, are revolutionizing long-term studies in developmental biology and investigation of dynamic processes in cell culture and small animal models.
Sponsored Content Policy: News-Medical.net publishes articles and related content that may be derived from sources where we have existing commercial relationships, provided such content adds value to the core editorial ethos of News-Medical.Net which is to educate and inform site visitors interested in medical research, science, medical devices and treatments.