For any monoclonal antibody to be effective and safe, it is vital that the molecule remains stable from the time of its production to the time of its use.
Despite freezing being the preferred storage method of proteins in bioprocessing industries,1,2 it has now been recognized that it may lead to ice-water surface denaturation, cold denaturation, and cryoconcentration of proteins over time.3
The drug substances are occasionally required to be stored for lengthy periods before they are converted into a drug product. Proteins undergo glass transition at around 200 K, with temperatures below this altering most of the protein's functions.4
Glass transition is an event that happens at lower temperatures because of changes in the dynamic behavior of individual proteins and viscosity during glass formation.
Applications of mass spectrometry (MS) in the pharmaceutical industry are well known. The new demands of modern bioprocessing and the implementation of QbD and PAT methods require a deeper understanding of these processes, and MS is well-positioned to provide the information-rich data required.
However, conventional mass spectrometers are expensive, sizable, and necessitate specialists to operate them in centralized labs. Being decentralized and at the point of need, integrated real-time MS delivers valuable process information rapidly and at a cheaper cost.
This article outlines the employment of an innovative point-of-need microscale electrospray ionization mass spectrometer (ESI-MS) to analyze the impact of storage conditions and time, as well as feeding strategies and medium-type, on the quality of lgG obtained from Perfusion (Frozen) and Fed-Batch (Fresh) CHO cell cultures.
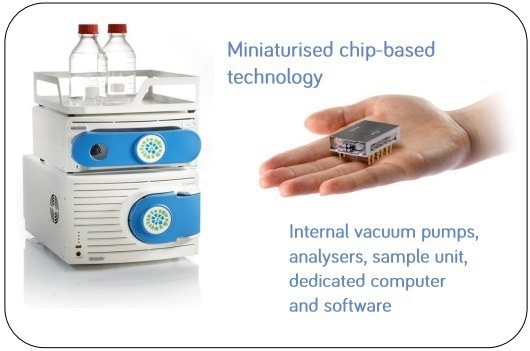
Figure 1. MiD®ProteinID mass spectrometer and MiDasTM sampling interface unit. Image Credit: Microsaic Systems plc
Focus
Analysis of the impact of various storage conditions on lgG samples and assessment of the use of MiD®ProteinlD for bioprocessing operations.
Experiment
Table 1. Experimental samples. Source: Microsaic Systems plc
| Conditions |
Frozen Perfusion IgG sample |
Fresh Fed Batch IgG sample |
| Culture Duration |
18 days |
12 days |
| Sampling Time |
Everyday |
On 12th day |
| Medium Type |
OptiCHOTM (Thermo Fisher) |
DynamisTM (Thermo Fisher) |
| Feed Supplements |
None |
Feed A and Feed C |
| Storage Time and Temp |
2 years at -20 °C |
A week at -20 °C |
All samples were clarified using a 0.2-micron filter and purified using Pure Proteome Protein A magnetic beads (Sigma-Millipore). The elution was conducted using 1% (v/v) formic acid.
A 2 µL loop was utilized to inject the samples into the MS. All injections were carried out in triplicates.
Cell media were spiked with standard lgG to result in spiked recovery controls. The mobile phase employed was Water:MeCN at a 60:40 ratio and 0.5% (v/ v) formic acid.
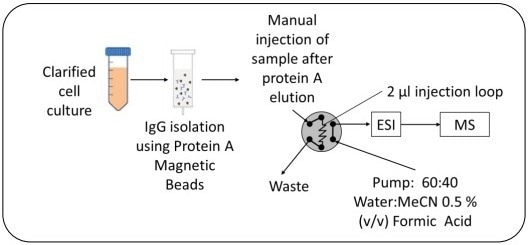
Figure 2. Overview of sample preparation and workflow. Image Credit: Microsaic Systems plc
Results and discussion
Figure 3 shows that the spiked recovery control sample of standard lgG exhibited a consistent mass of 148.2 kDa across the injection. Similarly, the Fresh Fed-Batch lgG sample demonstrated a consistent mass of 147.2 kDa.
However, the Frozen Perfusion lgG sample displayed significant variation of masses over the injection, with lgG of mass 146.5 kDa undergoing elution early in the injection while there is an lgG of mass 148 kDa undergoing elution towards the end of the injection.
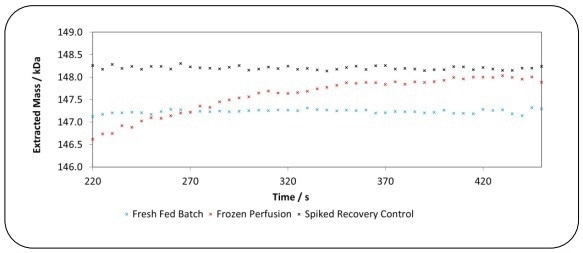
Figure 3. Spiked recovery control IgG, Fresh Fed Batch IgG and Frozen Perfusion IgG mass distribution across the injection. Image Credit: Microsaic Systems plc
The lgG created in Fresh Fed-Batch and Frozen Perfusion samples had different mass distributions. The injection of the Frozen Perfusion and the Fresh Fed-Batch samples are displayed in Figure 4. Distinct injection profiles can clearly be observed for the Total Ion Chromatogram (TIC).
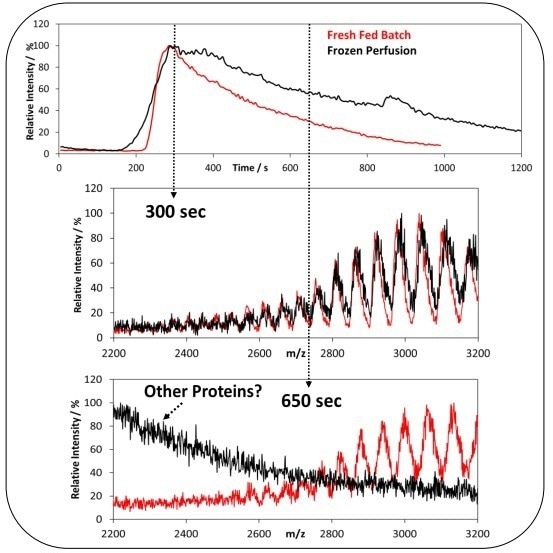
Figure 4. Total Ion Chromatogram (TIC) of Fresh Fed Batch and Frozen Perfusion Samples (top). Corresponding mass-to-charge spectra (bottom) for the TIC at 300 to 650 seconds. Image Credit: Microsaic Systems plc
At different time points, differences between the samples can be seen regarding the mass-to-charge spectra. At the peak maximum (at 300 seconds), there are clear lgG spectra present for both samples.
However, in the peak tail (at 650 seconds), minimal lgG is observed in the Frozen perfusion samples, which is dominated by other multiply charged species.
As shown in Figure 5, a heterogenous distribution of the masses can be observed across the TIC in the Frozen Perfusion sample. Different lgG masses are present at the peak front and middle of the injection (146.6 kDa and 147.4 kDa).
With an increase in signal in the peak tail between 750 and 1750 m/z, the presence of extra multiply charged species can be seen.
Across the Fresh Fed-Batch injection, there is a uniform distribution of the lgG mass, while across that of the Frozen Perfusion, there are uneven masses of the lgG sample. This indicates that the Fresh lgG from the Fed-Batch was superior in quality.
Storage of Perfusion samples for a long period is considered to be the key source of lgG deterioration.
The presence of this heterogenous population of lgGs can be examined further by glycan profiling the samples.
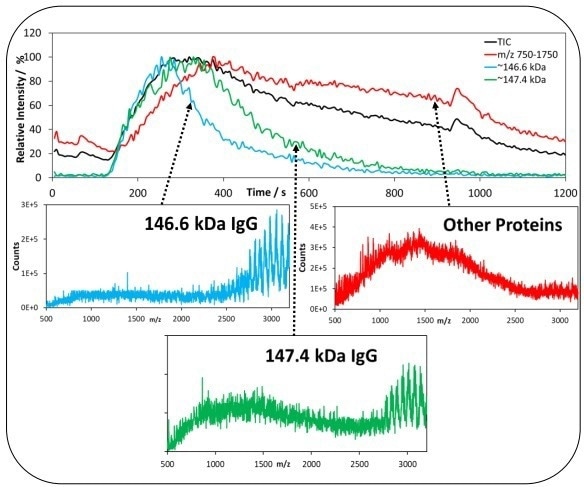
Figure 5. IgG mass distribution in the Frozen Perfusion sample. Top shows the Extracted Ion Chromatogram (EIC) during the injection of Frozen sample. Blue represents the intensity of IgG species with mass-146.6 kDa over the injection and green represents the intensity of IgG species with mass of 147.4 kDa over the injection. Red represents the intensity of signal between 750-1,750 m/z for other observed multiply charged species. Image Credit: Microsaic Systems plc
Conclusion
The experiment presented in this article proves that the novel miniaturized point-of-need MS can monitor lgG and protein fragments and provide the opportunity to determine the quality of the products.
Significant variations in the mass distributions of Frozen Perfusion (stored for two years) and Fresh Fed-Batch (stored for one week) lgG samples were observed. The substantial difference in the masses is indicative of protein deterioration over time.
The ice-water surface denaturation and cryoconcentration (which are consequences of storage conditions over time) could have contributed to the observed heterogeneous mass distribution.
However, further investigation is required to identify which medium or feeding strategy is more beneficial for optimizing lgG production.
Acknowledgments
Produced from materials originally authored by Kala Tamang and Dr. Jean François Hamel from Microsaic Systems. The original authors wish to thank Taehong Kwon and lronie Nagasena from MIT.
References and further reading
- Singh S, et al., (2009) Bioprocess Intl. 9, 32-44
- Escalante-Minakata, P. et al (2014) J Int Food. 4, 1-11 4
- Rayfield W. J, et al., (2017) J Pharm Sci. 8, 1944-1951
- Ringe D., et al., (2003) Biophys Chem, 2-3, 667-680
About Microsaic Systems
Founded in 2001, Microsaic Systems plc (AIM: MSYS) develops real-time, point-of-need mass spectrometers. Microsaic offers fast, accurate cutting-edge solutions to multiple industries across the world.
Core products, such as the compact MiD series of mass detectors, are designed to integrate seamlessly with a wide range of third-party OEM equipment or used as a standalone system. At the forefront of our design ethos is to deliver fast, easy to use, powerful mass spectrometry (MS) performance.
Patented chip-based MS technology and intuitive software enables real-time data generation at the point-of-need, not just in a centralised laboratory. Designed for both pharmaceutical and biopharmaceutical applications, continuous data is accessible at any stage of your workflow.
Over 20 years’ experience in mass spectrometry, microfluidics, vacuum systems, analytical processes, and miniaturised instrumentation has led to the development of our outsourced services. Laboratory, engineering, and monitoring issues can now be solved with a world-class team of chemists, physicists, and engineers by your side.
Sponsored Content Policy: News-Medical.net publishes articles and related content that may be derived from sources where we have existing commercial relationships, provided such content adds value to the core editorial ethos of News-Medical.Net which is to educate and inform site visitors interested in medical research, science, medical devices and treatments.