The manufacturing of biologics is complex, and with the drive for Quality by Design (QbD) processes, the demand for well-timed, information-rich process data is crucial for improvements in the efficiency, safety, and economics of processes.
Effective monitoring and control during upstream manufacturing are fundamental to the philosophy of QbD. However, upstream processes are currently monitored using multiple analytical methods to monitor a few Critical Process Parameters (CPPs).
Only a few methods directly monitor the product Critical Quality Attributes (CQAs), which are frequently indirectly inferred from the monitoring of CPPs.
The use of mass spectrometry (MS) provides a powerful tool capable of monitoring both key CPPs and CQAs with a single technology.
MS provides an information-rich and comprehensive view of the process, enabling a better understanding of how CPPs affect CQAs which is critical for the full implementation of Process Analytical Technology (PAT) for process monitoring and control.
The size, cost, and complexity of MS instruments have frequently restricted the use of MS in centralized labs. This has hindered the implementation of MS for real-time monitoring of upstream processes at the point of need.
This article discusses the development of a miniaturized ESI-MS, the MiD® ProteinlD (shown in Figure 1), coupled with Proof-of-Concept (PoC) workflows to facilitate the monitoring of both metabolites and lgG in upstream cell cultures and at the point of need.
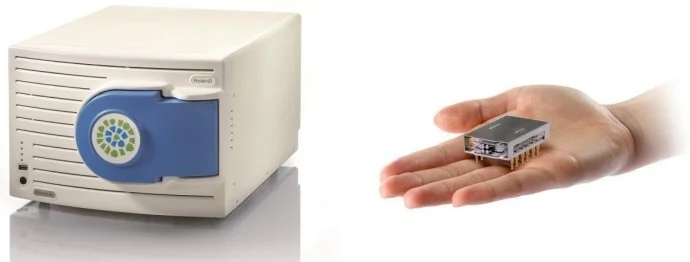
Figure 1. Microsaic MiD® ProteinID mass spectrometer based on miniaturized chip-based technology with an adjustable mass range between 50 and 3200 m/z the monitoring of small molecules in cell culture media and intact IgG is possible with this mass spectrometer. The MS features a miniaturized quadrupole mass filter and microflow electrospray source. The resulting small footprint (55 x 35 25 cm), low maintenance and ease of use allows it to be easily used at-line and at the point-of-need. Image Credit: Microsaic Systems
Methodology
A total of four shake flask cultures of anti-Her2 lgG1 expressing CHO cells were cultivated for 14 days at the Centre for Process Innovation (CPI) under favorable and unfavorable conditions in duplicate.
Favorable conditions were comprised of tight glucose limits, while unfavorable conditions were comprised of broader glucose limits and a higher addition of feed, as displayed in Table 1.
Samples were harvested from the culture at the start and at days 3, 5, 7, 9, 11, 13, and 14 to undergo analysis. Before analysis, the samples were clarified via centrifugation.
Table 1. Experimental samples. Source: Microsaic Systems
| |
Unfavorable |
Favorable |
| Lower glucose limit (g/L) |
4 |
2 |
| Upper glucose limit (g/L) |
8 |
3 |
| Feed added on alternate days (% volume) |
8 |
4 |
1. lgG product analysis
Filtered cell culture samples were directly injected onto a Protein A column with no other sample preparation taking place. Automated bind and elution from Protein A took place by employing volatile buffers to enable direct connection to the MiDTM ProteinlD.
The utilization of volatile buffers also enabled the direct observation of both intact lgG and non-binding components during the elution and bind phases, respectively. Post-software processing was used to automate the deconvolution and extraction of intact lgG masses from the mass-to-charge spectra.
2. Cell media metabolite monitoring
Cell media metabolite monitoring was conducted with the use of hydrophilic interaction chromatography (HILIC) to facilitate the direct observation of cell media components with minimal sample preparation. Before being injected, the samples were mixed with buffer and subsequently clarified to remove any precipitates.
Sample analysis was performed by employing a gradient separation. Analytes of interest were monitored utilizing Selected Ion Monitoring (SIM) in negative mode.
A PoC quantitation technique was examined to enable the measurement of metabolite concentrations without needing to use costly isotopically-labeled standards.
Results and discussion
1. lgG product analysis
The intact molecular weight of an lgG is an important physicochemical CQA, and the determination of intact mass forms part of the ICH 06B guidelines for the analysis of biological products. The use of the MiD® ProteinlD in conjunction with online Protein A separation allowed the monitoring of these intact lgG masses during the course of these cell cultures.
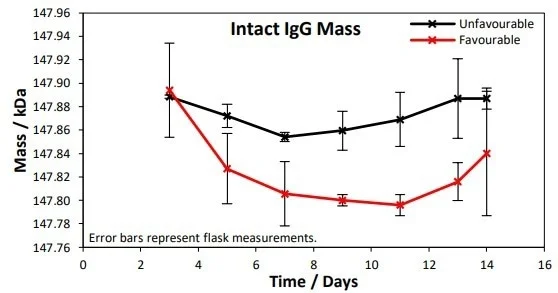
Figure 2. Intact IgG masses were measured at 3, 5, 7, 9, 11, 13 and 14 days. A 50 Da difference in IgG mass between the favorable and unfavorable conditions was observed at the 1% significance level. Image Credit: Microsaic Systems
Figure 2 presents the monitoring of the lgG masses across the 14-day culture for favorable and unfavorable conditions. A mean difference between the unfavorable and favorable across the time points of 50 Da was observed at a significance level of 1%.
Other species in the mass spectra may also be observed from additional peaks in the mass-to-charge spectra, as displayed in Figure 3. These peaks can be attributed to lgG fragments, especially the HHL fragment at a mass of ~122 kDa.
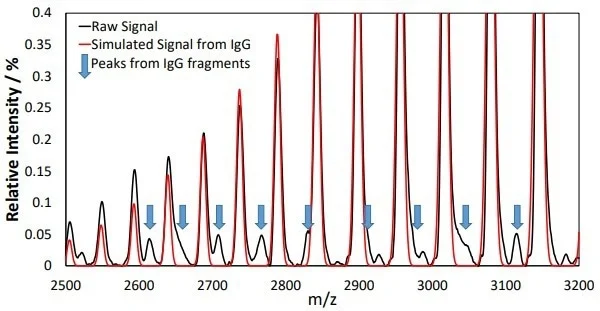
Figure 3. Additional peaks in the mass-to-charge spectra could be observed following elution from the Protein A column. Peaks from the IgG product at different charge states dominate the spectra and their positions can be seen from the simulated IgG spectrum overlaid in red. Additional peaks that do not match with the red spectrum can be observed and are highlighted with blue arrows. These peaks can be assigned to masses indicative of IgG fragments. Image Credit: Microsaic Systems
Monitoring these additional peaks in the mass-to-charge spectra enabled this fragment to be tracked relative to the main lgG product during the culture, as seen in Figure 4.
Similar kinetics were observed across the conditions for the lgG and 122 kDa fragments, and the relative ratios of these species appeared to be identical under both unfavorable and favorable conditions.
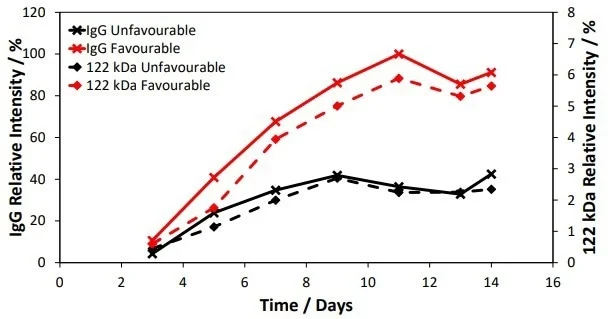
Figure 4. Tracking of the 122 kDa species (HHL fragment) relative to IgG with time. Image Credit: Microsaic Systems
2. Cell media metabolite monitoring
Monitoring metabolites within a cell culture is fundamental to the optimization of the health of the cells and enhancing titer and product quality. Monitoring of glutamine, glutamate, lactate, and glucose is regularly carried out.
Figure 5 presents the measurements for these four metabolites utilizing the PoC HILIC-MS methodology, alongside measurements taken with a photometric analyzer for comparison.
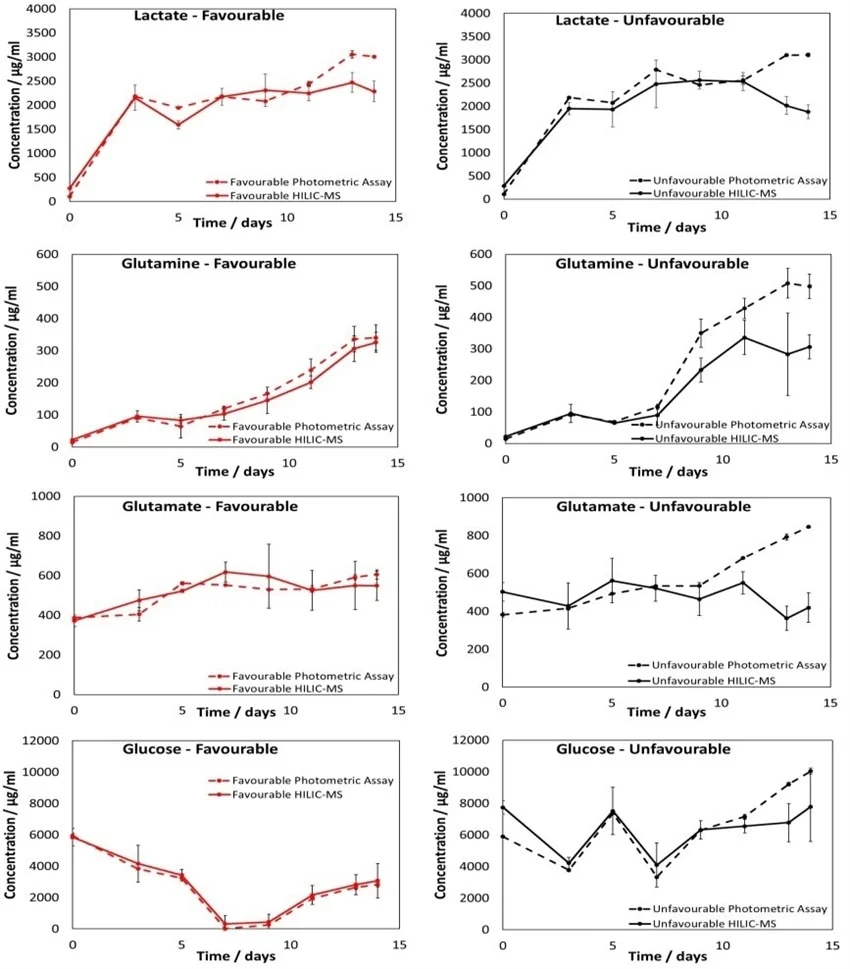
Figure 5. Results from the PoC HILIC-MS methodology quantifying lactact, glucose, glutamin, and glutamate in the favorable and unfavorable samples. Measurements from the photometric analyzer are also shown. Error bars represent the 95% CL across flask measurements. Image Credit: Microsaic System
A good correlation was observed between the photometric analyzer and MS measurements. However, deviations between these measurements were observed after about 11 days for the unfavorable samples.
This inconsistency in behavior between the favorable and unfavorable conditions can be observed using a heat map of z-scores for the difference between HILIC-MS and photometric analyzer measurements across time points and conditions, as presented in Figure 6.
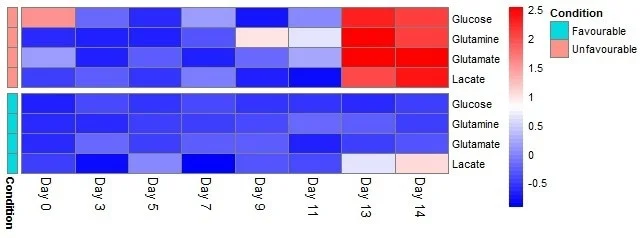
Figure 6. Heat map of z-scores for the difference between photometric analyzer and HILIC-MS measurements across time-points and conditions. Large deviations between measurements are observed after ∼11 days for the unfavorable samples. This is represented as the red area in the top right of the heat map. Image Credit: Microsaic Systems
The reason for this result is unknown and requires further study, but it is theorized that more by-products are likely to occur from cell death in unfavorable samples, particularly toward the end of the cell culture. This rise in by-products may result in interference in the photometric assays.
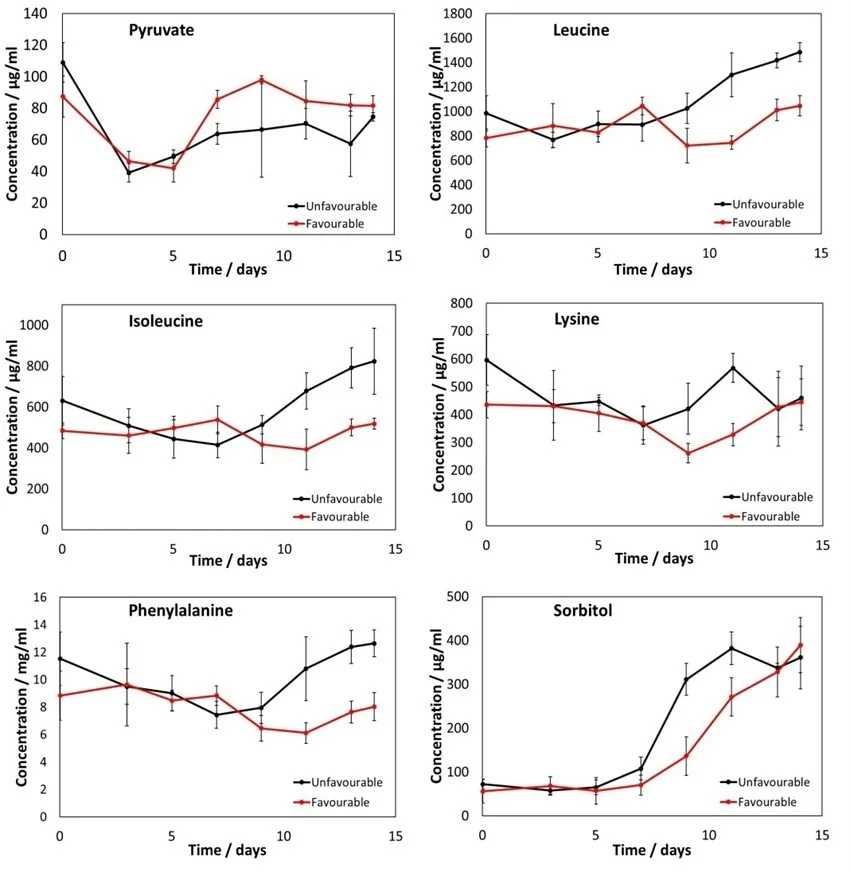
Figure 7. Metabolite profiles for pyruvate, leucine, isoleucine, lysine, phenylalanine and sorbitol for both favorable and unfavorable conditions. Clear differences between the unfavorable and favorable conditions can be seen. Error bars represent 95% CL across flask measurements. Image Credit: Microsaic Systems
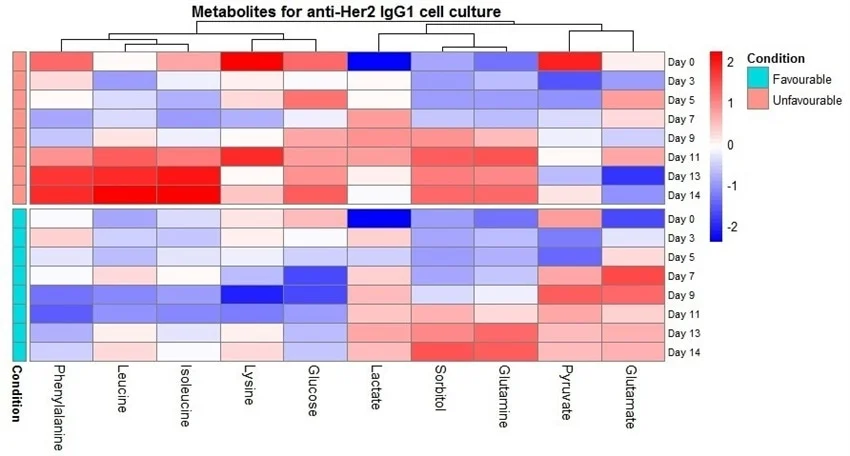
Figure 8. Heatmap of metabolite z-scores across time points and conditions. Clustering is from Euclidean distance. Image Credit: Microsaic Systems
MS can also monitor other metabolites, delivering a much more detailed picture of cell culture health. In this experiment, six further metabolites were monitored concurrently using the PoC HILIC methodology, as presented in Figure 7.
These metabolite profiles exhibit clear differences between the cultures grown in favorable and unfavorable conditions. Utilizing MS enables a vast number of analytes to be monitored and a large quantity of data to be collected, providing a more complete understanding of cell culture health.
However, collecting more data can frequently result in the end user being burdened with increased and more complex data interpretation. This is particularly the case when MS is employed at the point of need and by non-MS specialists.
As a result, a methodology for simplifying this data interpretation is vital for using MS at the point of need.
To simplify the collected data in these tests, a metabolite heatmap was produced, which is shown in Figure 8. This heatmap allows information to be extracted more easily and rapidly from the large data set. There are clear differences in temporal profiles between the conditions in the heatmap.
Distinct behavior for leucine, isoleucine, and phenylalanine, over the duration of the culture led to the clustering of these species. This clustering behavior is indicative of the opposing behavior of pyruvate and glutamate to leucine, isoleucine, and phenylalanine.
Conclusions
Employing the Microsaic MiDTM ProteinlD in combination with an automated protein A workflow enabled the simplification of measurements and the monitoring of intact lgG directly from the cell culture.
The utilization of a PoC HILIC-MS assay permitted measurements on metabolites in cell media to be taken with minimal sample preparation. The metabolite measurements exhibited a good correlation with photometric assay measurements that were taken in parallel.
However, deviations from the photometric assays towards the end of the cell culture under unfavorable conditions demand further research.
The measurement speed, precision, and accuracy would be expected to improve with additional automation of sample preparation. The utilization of bespoke protein A and HILIC configurations would also permit lower flow rates and smaller sample volumes to be used.
Acknowledgments
Produced from materials originally authored by Microsaic Systems Plc. The original authors wish to thank the Centre for Process Innovation (Darlington, UK) for undertaking shake flask cultures, providing photometric assay data, and assisting in data interpretation.
About Microsaic Systems
Founded in 2001, Microsaic Systems plc (AIM: MSYS) develops real-time, point-of-need mass spectrometers. Microsaic offers fast, accurate cutting-edge solutions to multiple industries across the world.
Core products, such as the compact MiD series of mass detectors, are designed to integrate seamlessly with a wide range of third-party OEM equipment or used as a standalone system. At the forefront of our design ethos is to deliver fast, easy to use, powerful mass spectrometry (MS) performance.
Patented chip-based MS technology and intuitive software enables real-time data generation at the point-of-need, not just in a centralised laboratory. Designed for both pharmaceutical and biopharmaceutical applications, continuous data is accessible at any stage of your workflow.
Over 20 years’ experience in mass spectrometry, microfluidics, vacuum systems, analytical processes, and miniaturised instrumentation has led to the development of our outsourced services. Laboratory, engineering, and monitoring issues can now be solved with a world-class team of chemists, physicists, and engineers by your side.
Sponsored Content Policy: News-Medical.net publishes articles and related content that may be derived from sources where we have existing commercial relationships, provided such content adds value to the core editorial ethos of News-Medical.Net which is to educate and inform site visitors interested in medical research, science, medical devices and treatments.