Sample preparation plays a crucial role in bioanalytical analysis involving chromatography. Insufficient sample preparation, such as skipping protein precipitation, phospholipid removal (PLR), liquid-liquid extraction (LLE), or solid phase extraction (SPE), negatively impacts system performance.
Typical complications include blockages in High Performance Liquid Chromatography (HPLC) tubing, column fouling, dirtying of the mass spectrometer source, and decreased sensitivity.
Among the available sample preparation techniques, protein precipitation is one of the most widely used for preparing biological samples, such as plasma or serum, for chromatographic analysis. The procedure is rapid and straightforward: a solvent is added to the sample, causing protein to precipitate, and liquid is drawn through a filter, yielding a protein-free sample.
Although protein precipitation eliminates proteins, it fails to remove other matrix components, such as phospholipids. These substances can cause numerous issues during LC-MS/MS analysis:
- Phospholipids are known to affect ionization within the mass spectrometer source, leading to either ion enhancement or, more commonly, ion suppression, undermining analytical robustness.1
- They contaminate the mass spectrometer source, increasing maintenance expenses and instrument downtime.
- Phospholipids accumulate on HPLC columns, causing elevated backpressures over time and reduced column lifespan.2
To address these difficulties, phospholipid removal (PLR) has emerged as an alternative approach for preparing a biological sample for analysis. PLR follows the same protocol as a protein precipitation plate but incorporates an active component into the product, designed to capture phospholipids without retaining analytes of interest (Figure 1). As a result, PLR offers a more comprehensive solution for biological sample preparation.
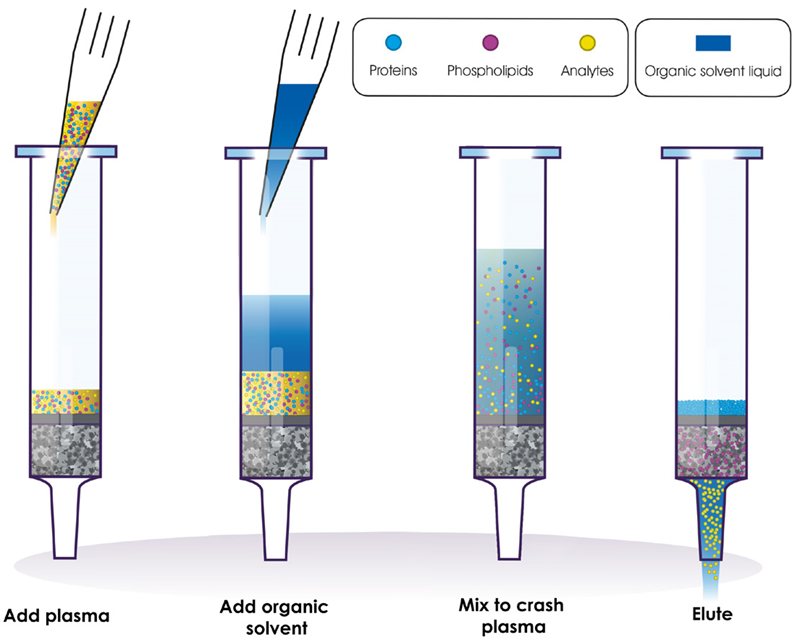
Figure 1. The simple PLR protocol for preparing plasma for LC-MS analysis. Image Credit: Porvair Sciences Limited
This study compares phospholipid removal efficiency and analyte recovery between two commonly employed sample preparation techniques, PLR and protein precipitation, for LC-MS/MS analysis using bovine plasma. The Microlute® PLR plate was utilized for the PLR sample preparation.
The Microlute® range employs a distinctive composite technology shown in Figure 2. This technology integrates an active phospholipid-capturing material with an inert polyethylene structure. This design improves sample preparation reproducibility by enhancing the consistency of sample flow into the collection plate.
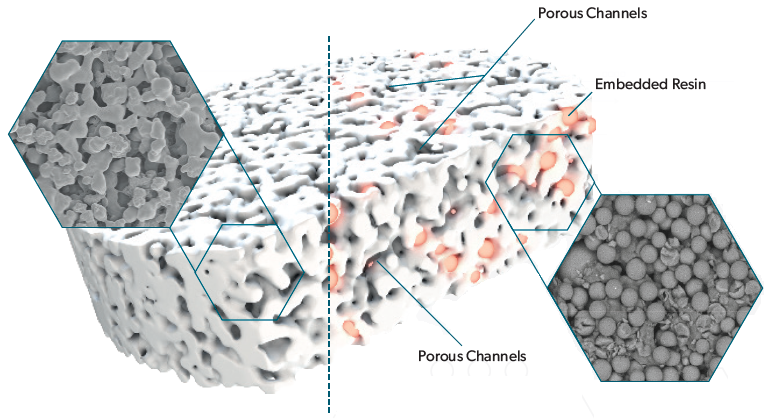
Figure 2. Diagrammatic representation of the Microlute® composite technology. Image Credit: Porvair Sciences Limited
Experimental
Preparation of spiked plasma
Bovine plasma was spiked with procainamide at three different concentration levels: 25 ng/mL, 250 ng/mL, and 1250 ng/mL. The solutions were mixed and allowed to equilibrate for one hour.
Calibration curve standards
To prepare calibration standards, 100 μL of blank unspiked plasma was added to four wells of a Microlute® PLR plate, followed by 300 μL of acetonitrile with 1% formic acid (v/v). Each well was aspirated five times using a pipette to ensure adequate mixing and complete protein precipitation.
The resulting solution was eluted into a 1.1 mL collection plate (Porvair Sciences product code: 219250) using positive pressure at an approximate flow rate of one drop per second.
All processed plasma was pooled into a 1.5 mL microcentrifuge tube and vortexed for 10 seconds. Then, 100 μL of the combined processed plasma was added to six wells to prepare one blank sample and five calibration standards. The five calibration standards were spiked to create the following standards: 10, 100, 200, 500, and 1500 ng/mL.
Dilution step
The eluate's high organic strength presented a poor peak shape, so the processed spiked plasma and standard solutions were diluted 1:10 with water containing 0.1% formic acid (v/v).
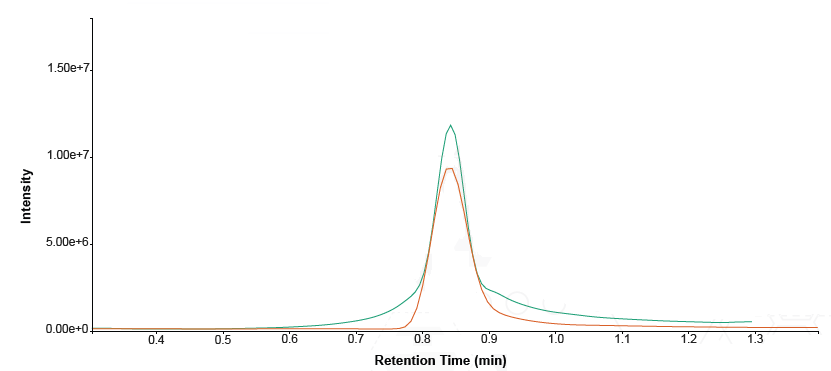
Figure 3. Overlaid comparison of procainamide peak shape – undiluted (green trace) versus 1:10 diluted (orange trace). Image Credit: Porvair Sciences Limited
LC-MS/MS method for post-column infusion
The following technique was employed to screen for common phospholipids present within the protein precipitated and Microlute® PLR samples, and monitor for any matrix effects such as ion enhancement or suppression through post-column infusion.3 The infused solution consisted of a 100 ng/mL procainamide solution in H2O + 0.1% formic acid, infused at a rate of 10 μL/min.
HPLC conditions. Source: Porvair Sciences Limited
| . |
. |
| System: ACQUITY Premier BSM/FTN |
Column: Thermo Fisher Hypersil GOLD™ C18 (2.1 mm x 50 mm, 1.9 μm) |
| Solvent A1 H2O + 0.1% formic acid |
Injection Volume 2 μL |
| Solvent B1 MeOH + 0.1% formic acid |
Column Temperature 40 °C |
| Gradient |
Sample Temperature 10 °C |
| Time |
A1 (%) |
B1 (%) |
| 0.00 |
20 |
80 |
| 0.50 |
20 |
80 |
| 1.00 |
0 |
100 |
| 3.00 |
0 |
100 |
| 3.01 |
20 |
80 |
| 4.00 |
20 |
80 |
|
Flow rate 400 μL/min |
Mass Spectrometer Conditions. Source: Porvair Sciences Limited
| . |
. |
| System: |
Xevo TQ-S micro |
| Ionization mode: |
Positive ESI |
| MRM transitions: |
See table below |
| Capillary voltage: |
2.5 kV |
| Source temperature: |
150 °C |
| Desolvation temperature: |
550 °C |
| Procainamide post-column infusion rate: |
10 μL/min |
| Infusions concentration: |
100 ng/mL |
MRM transitions. Source: Porvair Sciences Limited
| Analyte name |
Precursor (m/z) |
Product (m/z) |
Core voltage (V) |
Collision energy (V) |
| Procainamide |
235.92 |
163 |
23 |
15 |
| 18:0 LPC |
524.3 |
148.1 |
80 |
90 |
| 34.2 PC |
758.6 |
184.1 |
80 |
90 |
| 38.4 PC |
810.7 |
184.1 |
80 |
90 |
| 36.2 PC |
786.5 |
184.1 |
80 |
90 |
| 34.1 SM |
703.5 |
184.1 |
80 |
90 |
| 16:0 LPC |
496.3 |
184.1 |
80 |
90 |
LPC = Lysophophatidylcholines, PC = Phosphatidylcholine, SM = Sphingomyelin
LC-MS/MS Method for Procainamide. Source: Porvair Sciences Limited
| System: ACQUITY Premier BSM/FTN |
Column: Restek Biphenyl (2.1 mm x 30 mm, 1.8 μm) |
| Solvent A1 H2O + 0.1% formic acid |
Injection Volume 2 μL |
| Solvent B1 MeOH + 0.1% formic acid |
Column Temperature 45 °C |
| Gradient |
Sample Temperature 10 °C |
| Time |
A1 (%) |
B1 (%) |
| 0.00 |
90 |
10 |
| 1.20 |
90 |
10 |
| 1.21 |
0 |
100 |
| 5.00 |
0 |
100 |
| 5.01 |
90 |
10 |
| 10.00 |
90 |
10 |
|
Flow rate 400 μL/min |
Mass Spectrometer Conditions. Source: Porvair Sciences Limited
| System: |
Xevo TQ-S micro |
| Ionization Mode: |
Positive ESI |
| MRM Transitions: |
Procainamide 235.92 -> 163 |
| Capillary Voltage: |
0.5 kV |
| Source Temperature: |
150 °C |
| Desolvation Temperature: |
550 °C |
| Desolvation Gas Flow: |
1000 L/h |
| Cone Voltage: |
23 V |
| Collision Energy: |
15 V |
Results and discussion
Phospholipid removal
Phospholipid content in the plasma samples processed through the two sample preparation techniques was analyzed using an MRM LC-MS/MS scan for common phospholipids.
Chromatograms from the phospholipid removal plate exhibited minimal phospholipid signal, primarily baseline noise. This indicates that all phospholipids interfering with the analysis were eliminated from the sample (Figure 4). In contrast, the samples prepared by protein precipitation displayed larger peak areas, confirming their persistence in the sample and incomplete clean-up.
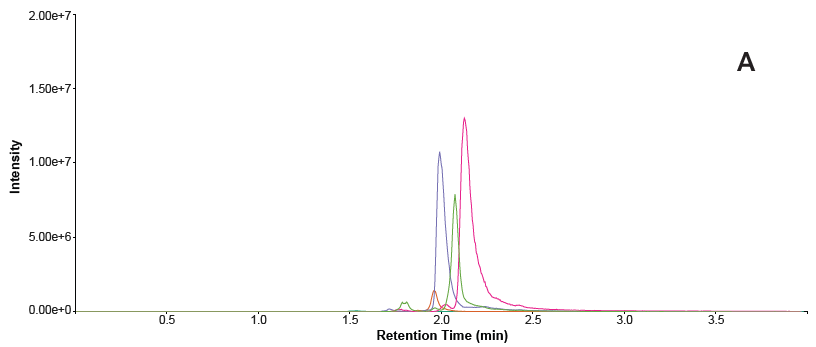
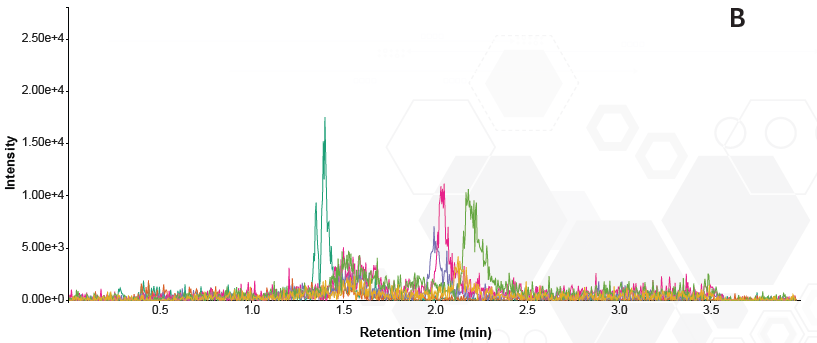
Figure 4. Overlaid traces of phospholipid MRMs in each sample. A = protein precipitated sample B = phospholipid removal plate. Image Credit: Porvair Sciences Limited
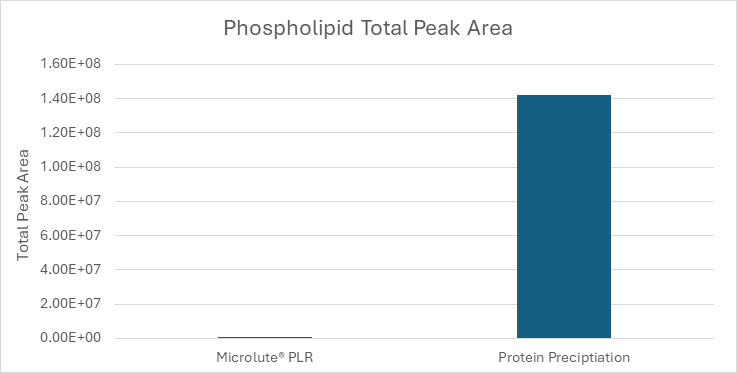
Figure 5. Comparison of total phospholipid peak areas in samples prepared using a Microlute® PLR plate and a protein precipitation plate. Total peak area for Microlute® PLR = 5.47 x 10⁴ and protein precipitation = 1.42 x 10⁸. Image Credit: Porvair Sciences Limited
The comparison of total peak areas of the phospholipid traces (Figure 5) revealed a striking difference. Phospholipids in the Microlute® PLR sample responded minimally (5.47 x 10⁴), whereas the protein precipitation sample exhibited a significantly larger total peak area (1.42 x 10⁸).
Matrix effects – ion suppression
To assess the influence of phospholipids on ionization, procainamide was infused post-column while injecting a blank sample prepared using both techniques.
The phospholipid removal plate (blue trace) showed that ionization was unaffected throughout the run when compared to the control infusion (green trace). In contrast, the protein-precipitated solution (black trace) exhibited a baseline dip caused by ion suppression from phospholipids between 1.5 and 2.5 minutes.
This is illustrated in Figure 6, showing a substantial decrease in signal where phospholipids co-elute (red trace). The greatest observed reduction in signal was approximately 75% for the procainamide at a retention time of around two minutes.
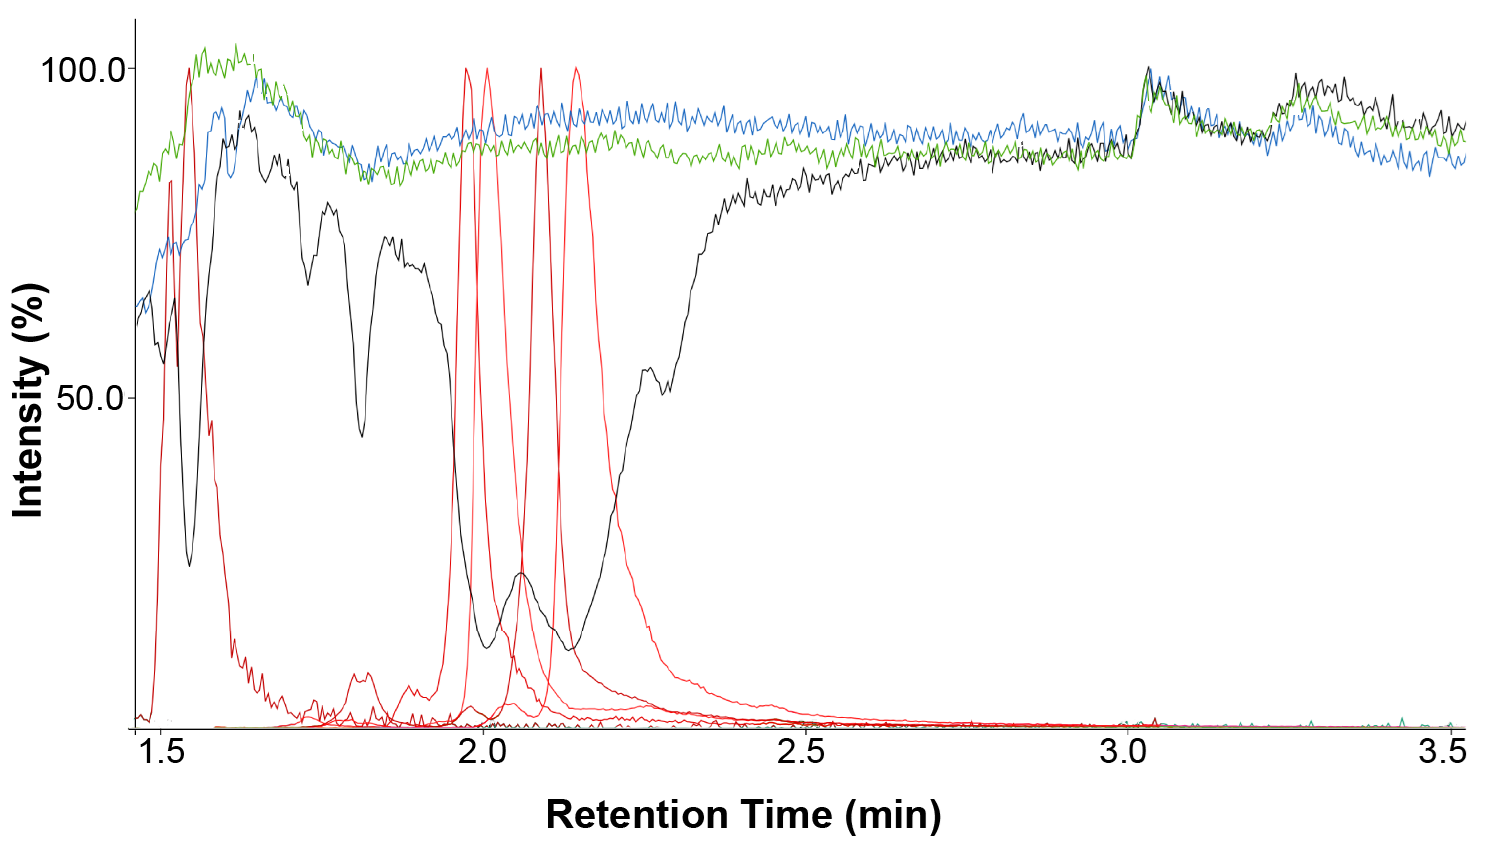
Figure 6. An overlay of the infusion traces of procainamide with an injection of a solvent blank (green), Microlute® PLR prepared sample (blue) and protein precipitated samples (black). The phospholipid trace for the protein precipitated sample is also overlaid (red). Image Credit: Porvair Sciences Limited
Procainamide calibration curve
A calibration curve generated using the Microlute® PLR-prepared samples (Figure 7) demonstrated clear linearity across the range of 10ng/mL to 1500ng/mL, with a correlation coefficient (r2) of 0.9995.
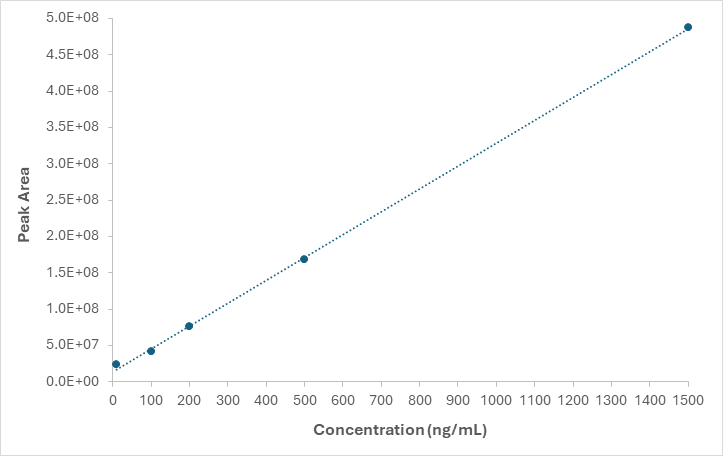
Figure 7. A matrix matched standard calibration curve ranging from 10 – 1500 ng/mL r2 value = 0.9995. Image Credit: Porvair Sciences Limited
Comparison of procainamide preparation methods – protein precipitation versus PLR
To simulate quality control (QC) conditions, plasma samples were prepared at three different concentrations: low QC (25 μg/mL), medium QC (250 μg/mL), and high QC (1,250 μg/mL), using both methods.
The samples were analyzed by LC-MS/MS. The peak areas varied by 9.6% (Table 1) at the lowest and most challenging concentration, showing that both preparation techniques were equally effective in recovering procainamide from plasma.
Table 1. Peak areas for procainamide in plasma prepared at the three concentrations levels in duplicate. The percentage difference between the peak areas at
each concentration for the two techniques. Source: Porvair Sciences Limited
| Technique |
Concentration (ng/mL) |
| 25 |
250 |
1250 |
| R1 |
R2 |
Mean |
R1 |
R2 |
Mean |
R1 |
R2 |
Mean |
| Protein Precipitation |
1.0E+07 |
1.1E+07 |
1.0E+07 |
8.2E+07 |
8.5E+07 |
8.4E+07 |
3.8E+08 |
4.0E+08 |
3.9E+08 |
| Phospholipid Removal |
9.7E+06 |
9.4E+06 |
9.5E+06 |
7.9E+07 |
7.8E+07 |
7.9E+07 |
3.7E+08 |
3.7E+08 |
3.7E+08 |
| Percentage Difference |
9.6 |
5.9 |
4.5 |
Conclusion
This study highlights the importance of effective sample preparation prior to chromatographic analysis of biological samples. Sample preparation prevents ion suppression, which can reduce signal and sensitivity, while also minimizing instrument maintenance requirements.
In the study, both preparation methods achieved similar analyte recovery, but the Microlute® PLR plate demonstrated superior phospholipid removal and reduced matrix effects. These findings highlight PLR as a more robust and reproducible approach for LC-MS/MS bioanalysis.
Acknowledgments
Produced from materials originally authored by James Edwards, Chromatography Manager at Porvair Sciences.
References and further reading
- Ismaiel, O.A., et al. (2008). Monitoring phospholipids for assessment of ion enhancement and ion suppression in ESI and APCI LC/MS/MS for chlorpheniramine in human plasma and the importance of multiple source matrix effect evaluations. Journal of Chromatography B, 875(2), pp.333–343. https://doi.org/10.1016/j.jchromb.2008.08.032. .
- Carmical, J., and Brown, S. (2016). The impact of phospholipids and phospholipid removal on bioanalytical method performance. Biomedical Chromatography, 30(5), 710–720. https://doi.org/10.1002/bmc.3686 .
- Phillips, G.B. and Dodge, J.T. (1967). Composition of phospholipids and of phospholipid fatty acids of human plasma. Journal of Lipid Research, 8(6), pp.676–681. https://doi.org/10.1016/s0022-2275(20)38891-x. .
About Porvair Sciences Limited

Porvair Sciences
Porvair Sciences are global leaders in the manufacturing and development of cutting-edge porous plastic materials and microplate technologies for the biotechnology and life science industries. From microplates and assay kits to automated laboratory equipment, our company is committed to the creation of workflow solutions with high quality products for improved analysis. Offering customers a diverse portfolio dedicated to high quality sample preparation, our innovative products are designed to increase productivity and accelerate scientific discovery with integrity.
Microlute®
The Microlute® range of sample preparation products were designed with reproducibility in mind. At the heart of the range are products with a unique hybrid structure, comprising a porous plastic disc with embedded active materials to enhance sample cleanup and analyte recovery. Discover the range of sample preparation solutions including solid phase extraction (SPE), phospholipid removal (PLR) and supported liquid extraction (SLE).
Sponsored Content Policy: News-Medical.net publishes articles and related content that may be derived from sources where we have existing commercial relationships, provided such content adds value to the core editorial ethos of News-Medical.Net which is to educate and inform site visitors interested in medical research, science, medical devices and treatments.