Sponsored Content by Gatan, Inc.Reviewed by Olivia FrostDec 3 2025
The chemical composition of cryogenically frozen materials that have remained hydrated is technically challenging to investigate due to the limited radiation resistance of hydrated living cells.
A typical dosage for single-particle tomography is around 40 e-/Å2. This dose is far lower than what is generally necessary to obtain an electron energy loss spectroscopy (EELS) spectrum image (SI) from an inorganic sample, which can range from ~107 to 108 e-/Å2.
This is due in part to the ionization of edges, which have smaller inelastic scattering cross-sections than elastic scattering cross-sections. Previous scintillator/CCD EELS detectors were inefficient in converting rapid electrons into readable signals, requiring a larger dose to obtain adequate signal-to-noise ratio (SNR).
Integrating the direct detection technology with the GIF Continuum® K3® improves collection efficiency while lowering the overall dose of the EELS test. This article demonstrates how the GIF Continuum and K3 can be used together to assess Ca distribution within a biological cell.
Materials, methods, and results
Human retinal ganglion cells were cultivated on carbon grids and treated with an organic calcium phosphate solution.
The hydrated samples were plunge-frozen in liquid N2 and cryogenically transported to the transmission electron microscopy (TEM) using the 626 cryo-transfer holder. The (S)TEM was operated at 200 kV. Latitude® S was utilized to examine the TEM grid for mitochondria.
Once the mitochondria were detected, the microscope's illumination mode was changed to STEM. EELS SI were obtained at a dispersion of 0.9 eV/ch and a total energy range of 3,000 eV.
DualEELS™ was employed to reduce multiple scattering from the core-loss edges, as the majority of the sample region was ≥1.5 t/λ.
The EELS SI were obtained with the in-situ SI tool in DigitalMicrograph®, which stores each SI pass separately. Following the acquisition, each pass was examined for H+ bubble production in the mitochondria.
Using a pixel dwell duration of 1.0 ms and an 8 × 8 subpixel scan array, the total dosage per pass was maintained at 18.37 e-/Å2. H+ bubbles appeared after a total dose of ~300 e-/Å2, saving the first 15 runs of the data set.
Using the in-situ technique, the first 15 passes were spatially aligned (drift corrected) and added together.
Due to the sample's limited dosage limits, principal component analysis (PCA) was used to denoise the spectra. A model for dealing with overlapping C K and Ca L2,3 edges, as well as plural scattering, was developed using multiple linear least squares fitting.
Figure 1a shows an aligned and summed annular dark-field (ADF) picture of the mitochondria. Bright, white contrasts represent places in the mitochondria where calcium is thought to concentrate. Figure 1b shows that Ca accumulates in the purple regions, which correlate with the bright regions in the ADF image.
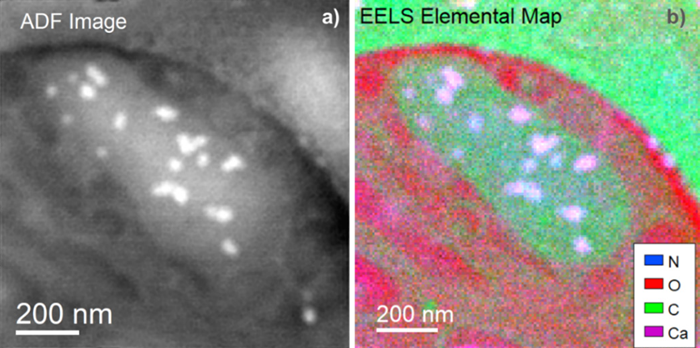
Figure 1. a) Simultaneous annular dark field (ADF) image of the mitochondria. b) EELS elemental map showing that the areas in purple correspond to the presence of Ca. Image Credit: Gatan, Inc.
Summary
Combining the sensitivity of the K3 camera with the high-performance GIF Continuum optics, it was demonstrated that the stark contrast in the ADF STEM image corresponds to Ca buildup within the mitochondria.
Given the highly limited dosage budget, a typical scintillator-based detector would have been unable to perform this measurement on this scale.
The ability to save passes separately using in-situ spectrum imaging showed how the mitochondria behaved with cumulative dosage and to exclude SI passes from the data that were contaminated by H+ bubbles.
Latitude S enabled a preliminary survey of the TEM grid using bright-field TEM imaging, reducing the time required to find potential mitochondria. For more details on this subject, please visit the publication in Structure.1
Acknowledgments
A special thanks to Dr. Wah Chu and Dr. Gong-Her Wu for their collaboration, providing samples, and their knowledge and expertise in cryo-EM.
Reference
- Wu, G.-H. et al. (2025). Cryogenic electron tomography and elemental analysis of mitochondrial granules in human retinal ganglion cells, Structure, 33(10), pp. 1771-1780.e3. DOI: 10.1016/j.str.2025.07.010. https://www.cell.com/structure/abstract/S0969-2126(25)00258-8?_returnURL=https%3A%2F%2Flinkinghub.elsevier.com%2Fretrieve%2Fpii%2FS0969212625002588%3Fshowall%3Dtrue.
About Gatan, Inc.
Gatan, Inc. is the world's leading manufacturer of instrumentation and software used to enhance and extend the operation and performance of electron microscopes.
Gatan's products, which are fully compatible with all brands of electron microscopes, cover the entire range of the analytical process from specimen preparation and manipulation to imaging and analysis.
Our customer base spans the complete spectrum of end users of analytical instrumentation typically found in industrial, governmental and academic laboratories.
The applications addressed by these scientists and researchers include metallurgy, semiconductors, electronics, biological science, new materials research and biotechnology.
The Gatan brand name is recognized and respected throughout the worldwide scientific community and has been synonymous with high-quality products and the industry's leading technology.
Sponsored Content Policy: News-Medical.net publishes articles and related content that may be derived from sources where we have existing commercial relationships, provided such content adds value to the core editorial ethos of News-Medical.Net which is to educate and inform site visitors interested in medical research, science, medical devices and treatments.