This article is based on a poster originally authored by Sanaz Koosha, Manpreet Singh, Eva Van Lombergen, Bieke Soen, Matthias De Decker, Leen Catrysse and Nithianandan Selliah.
Precise immunophenotyping of γδ T-cell populations relies on refined, high-parameter flow cytometry panels. These panels necessitate careful fluorochrome selection to prevent unintended molecular interactions. Given that these panels frequently target proteins situated in close proximity within the same macromolecular TCR/CD3 complex, the tight spatial arrangement of fluorochromes significantly elevates the risk of fluorescence artifacts.
During the development of a γδ T-cell panel (which included CD3, TCR γδ, TCR Vδ2, TCR Vγ9, and CD56), an unusual signal was observed in the RB780 channel when a FITC-conjugated TCR Vδ2 antibody was utilized. Although this artifact resembled typical under-compensation, spectral analysis confirmed the absence of conventional emission overlap between FITC and RB780, ruling out standard fluorescence spillover. To pinpoint the source of this signal, troubleshooting experiments were conducted, including single-stain controls, fluorescence-minus-one (FMO) controls, and modified panel configurations.
The objective was to characterize the aberrant signal and ascertain whether it was caused by a proximity-dependent interaction. The exclusion of CD3 APC-Cy7 from the panel eliminated the RB780-associated signal. This finding strongly supports the hypothesis of macromolecular Förster Resonance Energy Transfer (FRET) occurring naturally within the TCR/CD3 complex.
In this phenomenon, TCR Vδ2 FITC acts as the donor fluorochrome, non-radiatively transferring energy across the close molecular distance to the CD3 APC-Cy7 acceptor, which subsequently emits a false-positive signal near 780 nm (RB780 channel). Ultimately, these data emphasize the importance of assessing non-spectral fluorochrome interactions during high-parameter panel design, particularly when targeting tightly clustered receptor complexes. This also reinforces the crucial role of FMO controls in differentiating genuine biological phenotypes from physical fluorochrome interaction artifacts.
FRET hypothesis
During panel validation on the BD FACSLyric™ instrument, an unexpected compensation artifact was identified between CD56-RB780 and TCR Vδ2-FITC (Fig. 1). A FITC-associated signal was reproducibly detected in the RB780 channel despite minimal predicted spectral overlap, and it could not be resolved through standard compensation.
A review of the instrument filter configuration (Fig. 2) confirmed that FITC emission (∼500-550nm, blue laser) does not directly overlap with the RB780 detector (∼750-800 nm). However, the RB780 detection window coincides with the emission range of APC-Cy7 in the red laser path.
These observations support a non-conventional mechanism wherein excitation of FITC results in indirect energy transfer to APC-Cy7, leading to emission within the RB780 detection window.
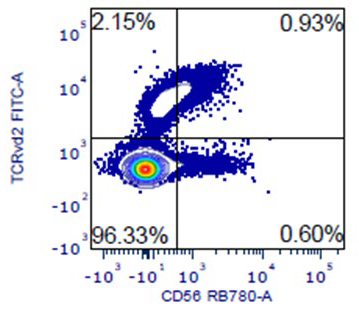
Fig 1. TCR Vδ2/CD56 compensation artifact. Image Credit: Cerba Research
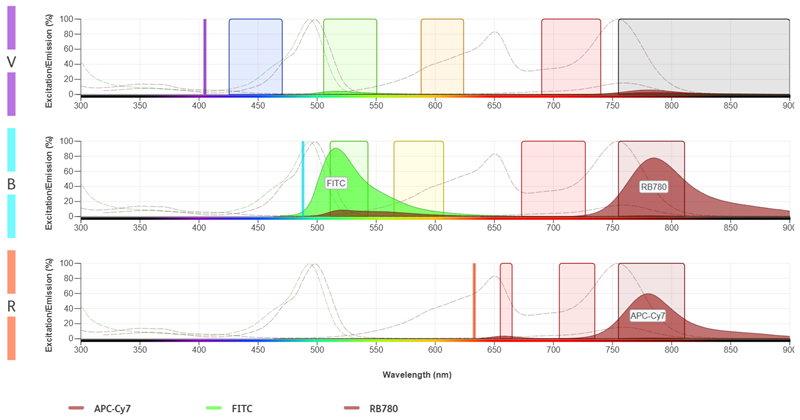
Fig 2. FITC, RB780, and APC-Cy7 Excitation/emission. Image Credit: Image acquired through BD® Spectrum Viewer
NOTE: filters for the Violet laser are shown for informational purposes only
Detection of the CD3/TCR complex in this panel involved CD3-APC-Cy7, TCR Vγ9-APC, TCR Vδ2-FITC, and TCRγδ-BV711, raising the possibility of FRET between fluorochromes located in close molecular proximity within the same receptor complex. Because CD3 and TCR molecules are physically associated on the cell surface, fluorochromes conjugated to antibodies targeting these markers can be positioned within nanometer-scale distances of each other. In this configuration, FITC conjugated to TCR Vδ2 can function as a donor fluorochrome, while APC-Cy7 conjugated to CD3 can function as an acceptor fluorochrome.
As depicted in the figure below, excitation of FITC by the Blue laser (488 nm) raises FITC to an excited energy state. Instead of releasing this energy solely through its normal FITC emission pathway, FITC can transfer energy directly to the nearby APC-Cy7 fluorochrome via non-radiative dipole–dipole coupling. This energy transfer occurs only when donor and acceptor fluorochromes are within approximately 1–10 nm of each other and when their spectral properties are compatible for FRET interaction.
Following energy transfer, APC-Cy7 emits fluorescence near 780 nm, which overlaps with the RB780 detection channel, resulting in an apparent signal in the RB780 parameter despite the absence of direct FITC-to-RB780 spectral spillover.
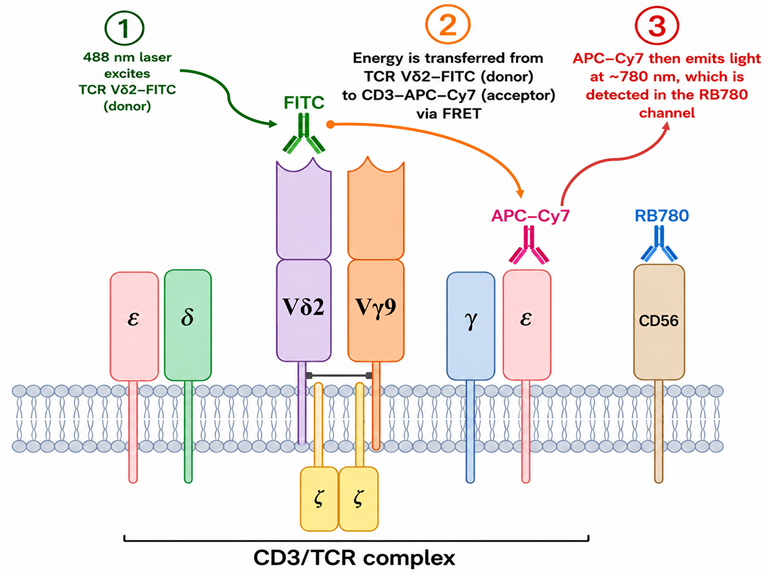
Fig 3. Proposed mechanism of apparent RB780 signal from FITC to APC-Cy7 Energy Transfer. Image Credit: Image generated by Google Gemini
Method
To evaluate the FRET hypothesis, a series of experiments was performed using T cells stained according to the panel configurations detailed in the table below. Modified panel configurations, fluorescence-minus-one (FMO) controls, and single-stain controls were employed to assess whether the abnormal RB780 signal was caused by a FRET-mediated fluorochrome interaction.
Experiment setup. Source: Cerba Research
Detector
(laser) |
FL1
405 |
FL2
405 |
FL3
405 |
FL4
405 |
FL5
405 |
FL6
488 |
FL7
488 |
FL8
488 |
FL9
488 |
FL10
640 |
FL11
640 |
FL12
640 |
(Filter)
Fluorochrome |
(448/
45) |
(528/
45) |
(606/
36) |
(715/50)
BV711 |
(755
LP) |
(527/32)
FITC |
(586/
42) |
(700/
54) |
(783/56)
RB780 |
(660/10)
APC |
|
(783/56)
APC-Cy7 |
| Full stain-1 |
|
|
|
TCRγδ |
|
CD3 |
|
|
CD56 |
TCR Vγ9 |
|
|
| Full stain-2 |
|
|
|
TCRγδ |
|
TCR Vδ2 |
|
|
CD56 |
TCR Vγ9 |
|
CD3 |
| TCRγδ-BV711-FMO |
|
|
|
|
|
TCR Vδ2 |
|
|
CD56 |
TCR Vγ9 |
|
CD3 |
| TCRδ2-FITC-FMO |
|
|
|
TCRγδ |
|
|
|
|
CD56 |
TCR Vγ9 |
|
CD3 |
| TCRγ9-APC-FMO |
|
|
|
TCRγδ |
|
TCR Vδ2 |
|
|
CD56 |
|
|
CD3 |
| CD56-RB780-FMO |
|
|
|
TCRγδ |
|
TCR Vδ2 |
|
|
|
TCR Vγ9 |
|
CD3 |
| CD3-APC-Cy7-FMO |
|
|
|
TCRγδ |
|
TCR Vδ2 |
|
|
CD56 |
TCR Vγ9 |
|
|
Single stain
TCRδ2-FITC |
|
|
|
|
|
TCR Vδ2 |
|
|
|
|
|
|
Single stain
CD56-RB780 |
|
|
|
|
|
|
|
|
CD56 |
|
|
|
Results
Fig 4A (Full stain-2) displays an abnormal signal profile in the CD56 RB780 channel (TCR Vδ2-FITC/CD56 RB780). A similar profile was observed when plotted with TCR γδ BV711/CD56 RB780 and TCR Vγ9/CD56 RB780 (data not shown). To investigate the apparent FITC signal detected in the RB780 channel, TCR Vδ2-FITC was substituted with CD3-FITC while maintaining CD56-RB780 staining (no TCR Vδ2 antibody, Full stain-1). Replacing TCR Vδ2-FITC with CD3-FITC eliminated the abnormal signal previously observed in the CD56-RB780 versus TCR Vδ2-FITC plot (compare Fig. 4A: TCR Vδ2/CD56 and Fig. 4C: CD3/CD56 plots), as well as in TCR γδ BV711/CD56 RB780 and TCR Vγ9/CD56 RB780 (Fig. 4B and Fig. 4D, respectively). These findings suggest that the apparent RB780-associated signal may arise from the combined presence of CD3 APC-Cy7 and TCR Vδ2-FITC within the CD3/TCR complex, potentially due to a FRET-associated interaction between these fluorochromes.
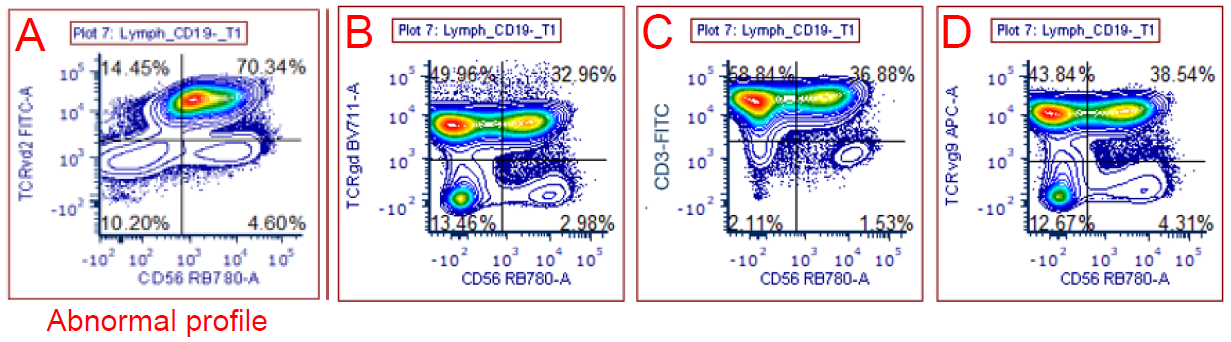
Fig 4. TCR Vδ2 FITC was replaced with CD3 FITC. Image Credit: Cerba Research
For each experimental condition, full-stain, FMO, and single-stain controls were analyzed by plotting TCR Vδ2, TCR Vγ9, and TCRγδ against CD56-RB780. As illustrated in the figure below, the full-stain condition exhibited an apparent abnormal signal in the CD56-RB780 channel (Full stain-2). Similarly, various FMO tubes (as per the Experiment setup table) continued to show an abnormal signal in the RB780 channel, with the exception of the condition where CD3 APC-Cy7 was absent (CD3-APC-Cy7 FMO tube, indicated by the *). As anticipated under the FRET hypothesis, the single-stain control for TCR Vδ2 FITC did not exhibit an abnormal profile in the RB780 channel. The CD56 RB780 single stain shows a normal CD56-positive profile (last column at the top). These findings suggest that the apparent RB780-associated abnormal signal resulted from FRET when CD3 APC-Cy7 and TCR Vδ2-FITC were present within the CD3/TCR complex.
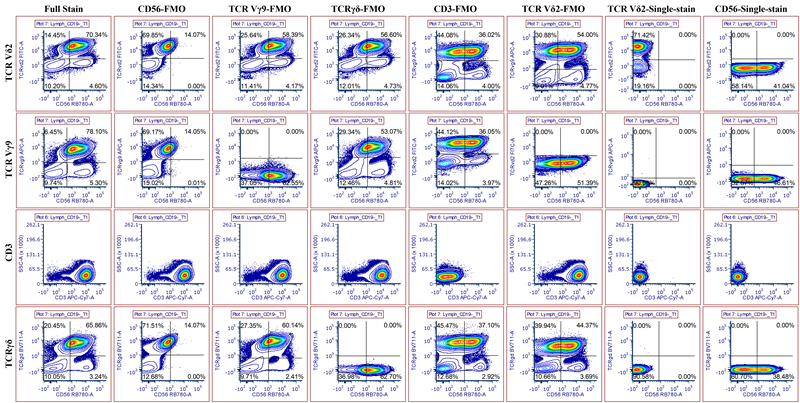
CD56-RB780 and TCR Vδ2-FITC Interaction Across Experimental Conditions. Image Credit: Cerba Research
Conclusion
The findings presented demonstrate that the abnormal RB780-associated signal is not attributable to spectral spillover or compensation error. Instead, it originates from a particular fluorochrome interaction within the CD3/TCR complex, consistent with FRET. This interpretation is directly supported by control experiments where substituting TCR Vδ2-FITC with CD3-FITC, as well as performing FMOs for either TCR Vδ2-FITC or CD3 APC-Cy7, totally abolished the aberrant signal. Furthermore, the RB780 signal was observed consistently across various staining conditions, including both full-stain and FMO controls, thus confirming the reproducibility of this effect.
Collectively, these results highlight a critical technical consideration in multiparametric flow cytometry, particularly when targeting multiple components of a single receptor complex. To ensure data integrity, meticulous panel design and strategic utilization of FMO controls are essential for accurately distinguishing genuine biological signals from fluorescence artifacts.
About Cerba Research
Mission
Cerba Research provides innovative laboratory solutions for clinical research to support their customers in bringing improved treatments to patients.
Vision
To be the world leading, specialty laboratory solution provider in clinical research, supporting their customers with faster diagnosis, development, and delivery of patient treatments.
Company profile
Cerba Research is a leading specialty laboratory services provider with the capacity and breadth of a global central laboratory network. Their highly qualified scientists provide insight on the latest biomarkers, assays and testing approaches and develop innovative solutions for unique challenges across all research phases, to pharmaceutical, biotechnology, medical device, government, public health, and CRO organizations.
Cerba Research’s extensive capability in laboratory testing and global logistics including Bioanalysis, Flow Cytometry, HistoCytopathology, and Next-Generation Sequencing, enables them to drive operational agility at scale in a wide range of therapeutic areas, with recognized expertise in Virology, Immunology, Oncology and Cell & Gene Therapy.
Cerba Research is part of the Cerba HealthCare Group with 15,000 employees on five continents, driven to advance diagnosis and health.
For more information about Cerba Research, please visit cerbaresearch.com.
Sponsored Content Policy: News-Medical.net publishes articles and related content that may be derived from sources where we have existing commercial relationships, provided such content adds value to the core editorial ethos of News-Medical.net, which is to educate and inform site visitors interested in medical research, science, medical devices and treatments.
Last Updated: Jun 25, 2026
 ESGCT Conference Takeaways: A specialty laboratory perspective