This article is based on a poster originally authored by Rania Gaspo, Xavier Pichon, Maroua Tliba, Sabine Iglesias, Darshan Kumar, Renaud Burrer, Amanda Finan-Marchi, and Marie Gérus-Durand.
Ki67 is an important proliferation marker in solid tumors, especially useful for guiding adjuvant therapy to treat HR+/HER2- breast cancer. Despite this clinical importance, there is a lack of standardized methods for Ki67 immunohistochemistry (IHC) scoring.
As international guidelines try to limit any variability among pathologists, AI-driven image analysis solutions are now emerging as rapid and reliable alternatives.1,2 Through a comparative analysis of Ki67 scoring using Aiforia® (an AI platform) and Halo® (supervised image analysis software), this study measures the results against three independent pathologists across a large solid tumor cohort.
Method
First, 192 tumors taken from a variety of tissue origins (Figure 1), including breast and prostate, were stained using the CONFIRM anti-Ki67 [30-9] monoclonal primary antibody (IVD) on the Ventana Benchmark Ultra platform. Three pathologists, trained to adhere to the International Ki67 Working Group (IKWG) guidelines, scored the tissues in accordance with these recommendations.3
Using deep learning, the Aiforia® platform automatically quantified Ki67-positive tumor cells (Ki67+) within minutes. Meanwhile, the images were categorized using the Halo® software random forest classifier into tumor, non-tumor, and background regions; a pathologist then verified these classifications independently.
Following cell segmentation, thresholding was applied to determine Ki67. A matched-pairs statistical analysis was subsequently run using JMP® software.
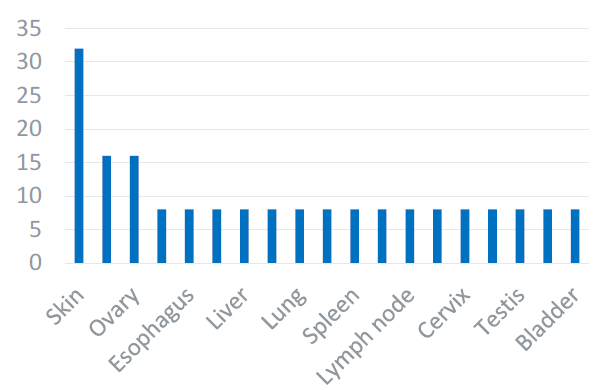
Fig 1. Sample size by solid tumor type from the multiple organ tumor tissue microarray (TMA) (n=192). Image Credit: Cerba Research
Workflow
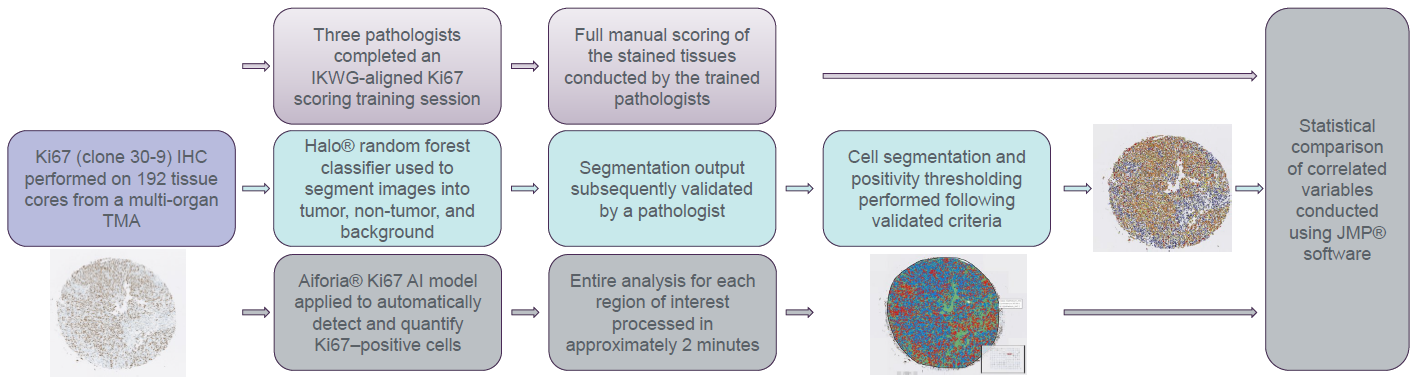
Fig 2. Workflow description with an example of an IHC Ki67 staining using a lung cancer specimen (papillary adenocarcinoma). Image Credit: Cerba Research
Results
Ki67 quantification by solid tumor type
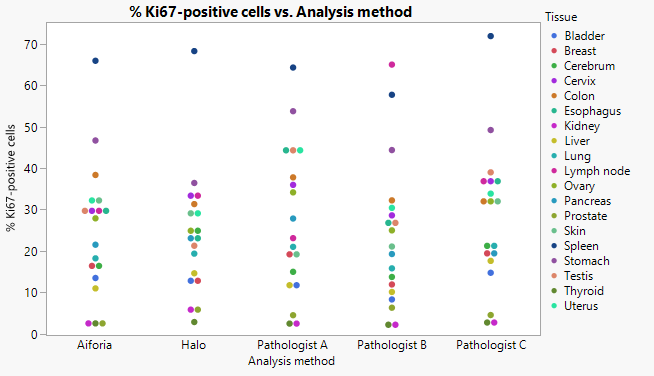
Fig 3. Mean percentage of Ki67-positive cells by tissue type analyzed by different methods. Graph prepared using JMP®. Image Credit: Cerba Research
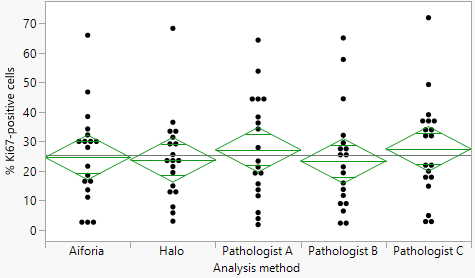
Fig 4. Difference between mean percentage of Ki67-positive cells. No significant difference in overall mean % of Ki-67 positive cells between different analysis methods. Graph prepared using JMP®. Image Credit: Cerba Research
Matched-pairs analysis of Ki67 quantification in solid tumors
Correlation analyses enable comparative analysis of Ki67 scoring outputs generated by the two image-analysis platforms (Aiforia® and Halo®) and by three pathologists.
The closest matches were observed between Aiforia® and Halo® (r=0.95). Correlation between Aiforia® and individual pathologists (A, B, C) was in the fair to strong range (r=0.83, 0.82, and 0.94). Conversely, when comparing Halo® with the pathologist scoring, the results exhibited predominantly fair agreement (r=0.76, 0.80, and 0.89).
Overall, inter-pathologist correlation was weaker (r =0.78 for B–A, r=0.86 for C–A, and r =0.85 for C–B). The lowest correlation seen in the dataset was between Pathologist A and Halo® (r=0.76) (Figure 5).
Matched pairs analysis of Ki67 quantification results in various solid tumors (n=158)
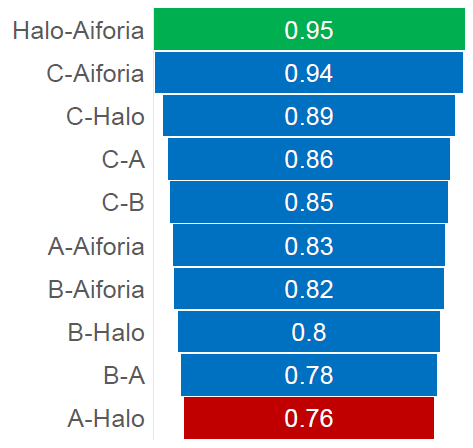
Fig 5. Aiforia® and Halo® demonstrated the highest correlation in Ki67 quantification (green), while the poorest agreement was observed between Pathologist A and Halo® (red). R values indicated on the graph bars. Matched pair analysis performed using JMP®. Image Credit: Cerba Research
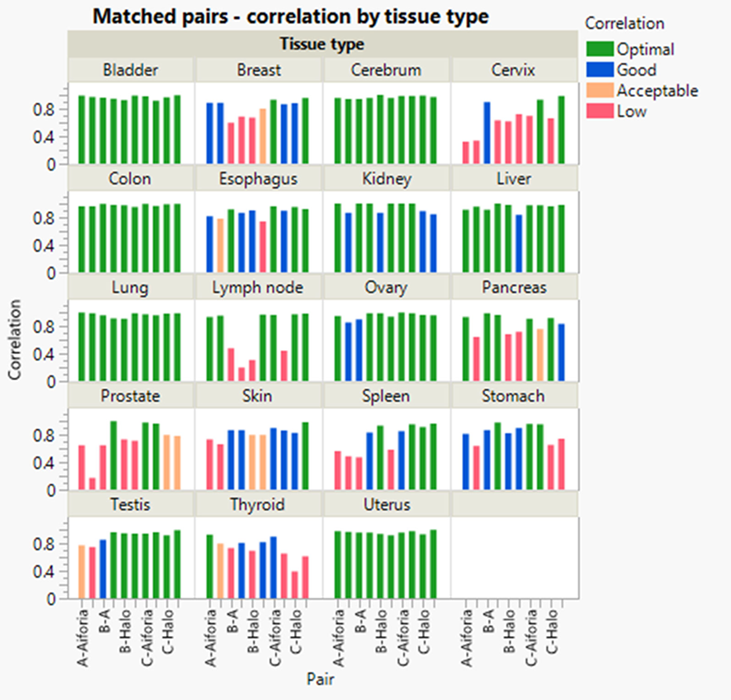
Fig 6. (On the right). Results of Ki67 quantification by solid tumor type with corresponding matched-pairs analysis. Cell color coding for r-values: green (optimal) ≥ 0.90; blue (good) = 0.90–0.80; orange (acceptable) = 0.80–0.75; red (low) = below 0.75. Matched pair analysis performed using JMP®. Image Credit: Cerba Research
Conclusion
The results demonstrate a consistently high correlation between Aiforia® and Halo®, as well as between inter-pathologist comparisons (r >0.90). While there was more variation in inter-pathologist agreement according to tumor type, the two image-analysis platforms generated consistent results regardless of tissue origin.
For example, in lymph node Ki67 scoring, Aiforia® and Halo® demonstrated high similarity (r=0.98), whereas the corresponding inter-pathologist correlation was demonstrably lower (r =0.44 for C–B). Across the 19 primary tumor types assessed, a correlation below 0.75 only occurred in relation to stomach cells between the two software platforms (r=0.74), whereas inter-pathologist agreement remained high (r = 0.86–0.95).
These results reveal consistency among automated image-analysis tools relative to the variability that may occur with manual pathologist scoring. AI-based platforms like Aiforia® and supervised image analysis tools such as Halo® offer highly reproducible Ki67 scoring and can considerably help reduce inter-observer variability.
These technologies are valuable for IHC-based clinical analysis and can be used as arbitration tools or to standardize Ki67 assessment in solid tumors.
References and further reading
- Yin, M., et al. (2015). An international study to increase concordance in Ki67 scoring. Modern Pathology, 28(6), pp.778–786. DOI: 10.1038/modpathol.2015.38. https://www.modernpathology.org/article/S0893-3952(22)01413-2/fulltext.
- Nielsen, T.O., et al. (2020). Assessment of Ki67 in Breast Cancer: Updated Recommendations From the International Ki67 in Breast Cancer Working Group. JNCI: Journal of the National Cancer Institute, 113(7). DOI: 10.1093/jnci/djaa201. https://academic.oup.com/jnci/article/113/7/808/6053794?__cf_chl_f_tk=nDuqProMtg2cHLaR5zzBZa3sP1OLjOnoTnduWe9yUWA-1783049759-1.0.1.1-RxnN15ixH4BFeNbrswrVGndcDofunSqjTsmjaSMh9Y8.
- Genetic Pathology Evaluation Centre (2026). Welcome to Ki67-QC calibrator. Available at: http://www.gpec.ubc.ca:8080/tmadb-0.1/calibrator/index.
About Cerba Research

Cerba Research is a leading specialty laboratory services provider with the capacity and breadth of a global central laboratory network. Their highly qualified scientists provide insight on the latest biomarkers, assays and testing approaches and develop innovative solutions for unique challenges across all research phases, to pharmaceutical, biotechnology, medical device, government, public health, and CRO organizations.
Cerba Research’s extensive capability in laboratory testing and global logistics including Bioanalysis, Flow Cytometry, Histopathology, and Next-Generation Sequencing, enables them to drive operational agility at scale in a wide range of therapeutic areas, with recognized expertise in Virology, Immunology, Oncology and Cell & Gene Therapy.
Cerba Research is part of the Cerba HealthCare Group with 15,000 employees on five continents, driven to advance diagnosis and health.
For more information about Cerba Research, please visit cerbaresearch.com.
Sponsored Content Policy: News-Medical.net publishes articles and related content that may be derived from sources where we have existing commercial relationships, provided such content adds value to the core editorial ethos of News-Medical.net, which is to educate and inform site visitors interested in medical research, science, medical devices and treatments.
Last Updated: Jul 16, 2026
 ESGCT Conference Takeaways: A specialty laboratory perspective