From SelvitaReviewed by Olivia Frost
This article and associated images are based on a poster originally authored by Leśniak, K., Płonka, A., Kruczek, Sz., Zaremba, K., Hooks, K. B., and Olszewski, M. B. and presented at ELRIG Drug Discovery 2026 in affiliation with Selvita.
This poster is being hosted on this website in its raw form, without modifications. It has not undergone peer review but has been reviewed to meet AZoNetwork's editorial quality standards. The information contained is for informational purposes only and should not be considered validated by independent peer assessment.

Background
- Cell painting captures cellular responses using multiplexed fluorescence imaging.
- Thousands of morphological features can be transformed into phenotypic signatures and biological maps.
- In this study, researchers established an end-to-end Cell Painting workflow integrating automated image acquisition, large-scale feature extraction, advanced dimensionality reduction (PHATE/t-SNE), and machine-learning-driven phenotypic analysis.
Assay facts
- 384-well format
- Microscope: Revvity Operetta CLS, 20x Obj, 9 FOV/well
- PhenoVue CellPainting Assay
- Whole wet lab work automated (Tecan Fluent station for automated liquid handling)
- U2OS cells treated with compounds at 3 µM for 48 hours
- 79 perturbators + eight JUMP reference compounds
Workflow
How does a cellular perturbation become a phenotypic fingerprint and eventually a biological insight?
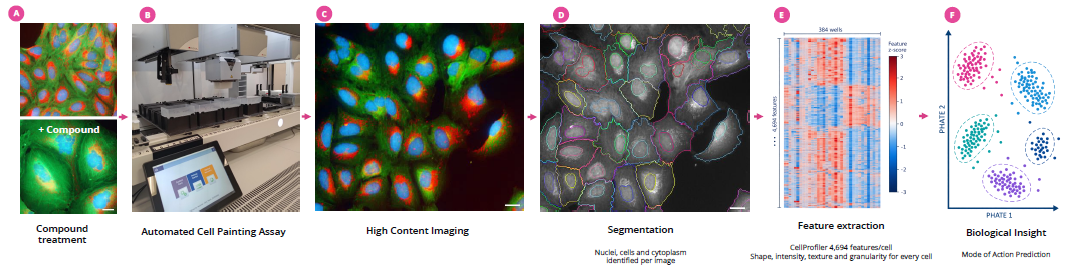
Image Credit: Image courtesy of Leśniak, K., et al., in partnership with ELRIG (UK) Ltd.
Four-step quality assessment
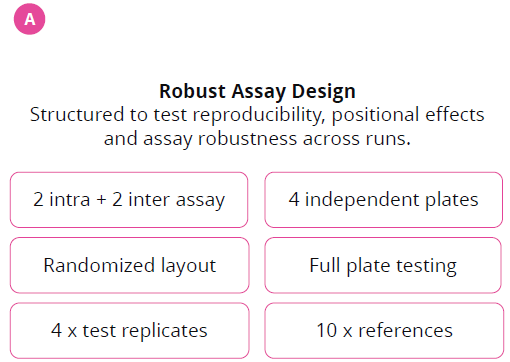
Robust assay design. Image Credit: Image courtesy of Leśniak, K., et al., in partnership with ELRIG (UK) Ltd.
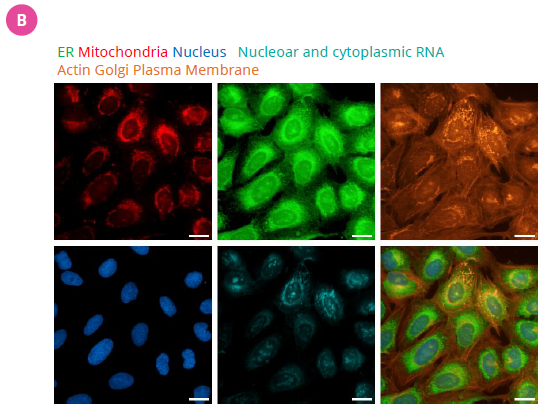
Figure 1. Image quality. Image Credit: Image courtesy of Leśniak, K., et al., in partnership with ELRIG (UK) Ltd.
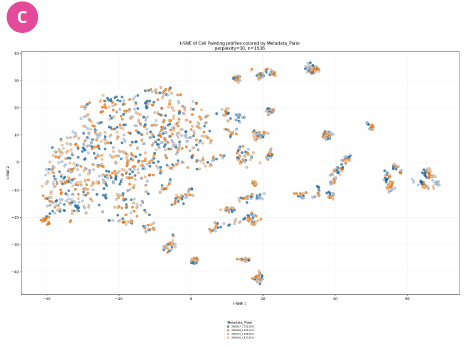
Figure 2. t-SNE projection colored by Metadata_Plate. The four plate labels overlap extensively in the main cloud and in multiple peripheral groups. Samples are grouped because of biology, not because they were run on different plates. Image Credit: Image courtesy of Leśniak, K., et al., in partnership with ELRIG (UK) Ltd.
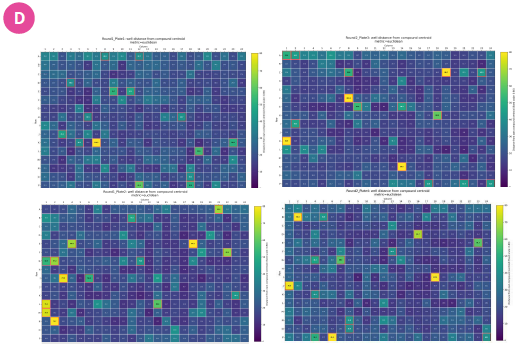
Figure 3. The plate-level QC plots visualize the Euclidean distance of each well from the centroid calculated across replicate profiles of the same compound. Outlier wells occurred sporadically and showed no spatial clustering, indicating minimal technical plate effects. Image Credit: Image courtesy of Leśniak, K., et al., in partnership with ELRIG (UK) Ltd.
Thanks to ideal wet-lab work, additional batch-correction or feature-alignment procedures were unnecessary.
Phenotypic landscape
Compound-specific morphology profiles cluster reproducibly across independent assay plates.
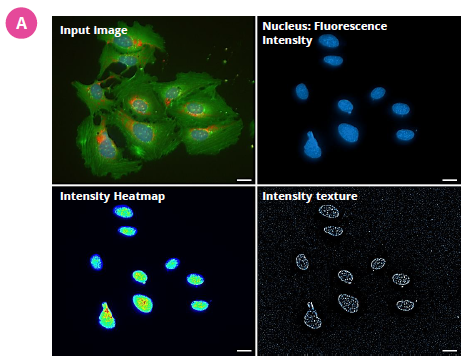
Figure 4. Effect of the DNA damage-inducing compound gemcitabine. Feature extraction converts compound-induced morphological descriptors encompassing intensity, texture, shape, and spatial organization. These multidimensional measurements enable sensitive detection and characterization of DNA damage-associated cellular phenotypes. Image Credit: Image courtesy of Leśniak, K., et al., in partnership with ELRIG (UK) Ltd.
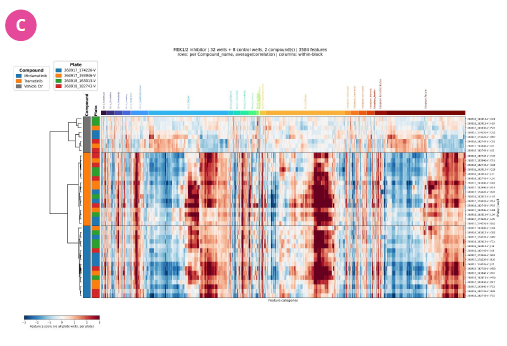
Figure 5. Heatmap and hierarchical clustering of Cell Painting feature Z-scores reveal consistent and reproducible morphological signatures induced by the MEK1/2 inhibitors Mirademetinib and Trametinib across four independent assay plates, thereby enabling the definition of MoA-related phenotypic profile changes. Image Credit: Image courtesy of Leśniak, K., et al., in partnership with ELRIG (UK) Ltd.
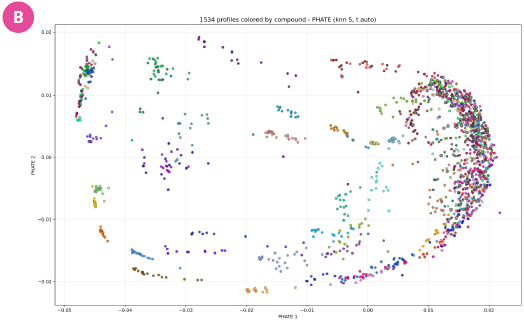
Figure 6. PHATE embedding reveals reproducible clustering of compound profiles across independent assay plates and separation of morphology signatures in feature space. Image Credit: Image courtesy of Leśniak, K., et al., in partnership with ELRIG (UK) Ltd.
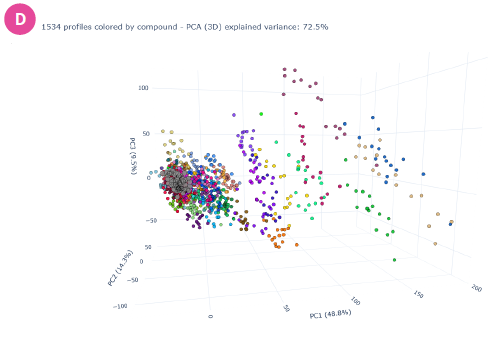
Figure 7. PCA independently confirms clustering of compound-specific morphology profiles and consistent separation of compounds across assay plates. Image Credit: Image courtesy of Leśniak, K., et al., in partnership with ELRIG (UK) Ltd.
Phenotypic family discovery
High-dimensional phenotypic maps uncover biologically relevant compound families
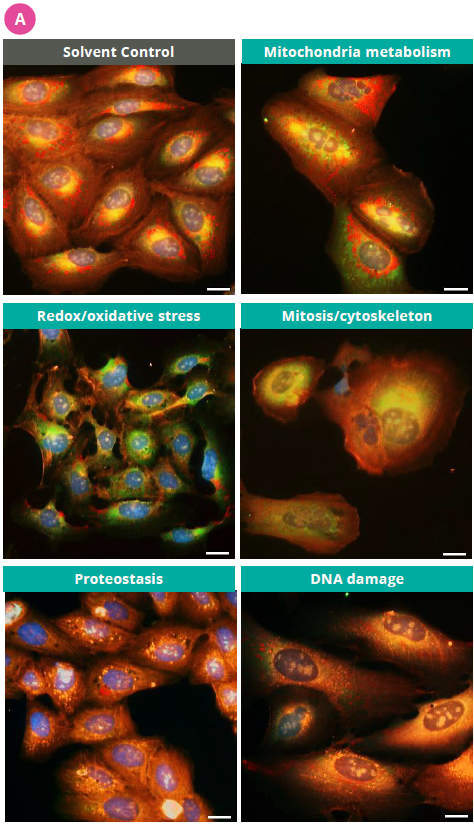
Figure 8. Illustration of distinct morphological signatures associated with selected MoA families. Image Credit: Image courtesy of Leśniak, K., et al., in partnership with ELRIG (UK) Ltd.
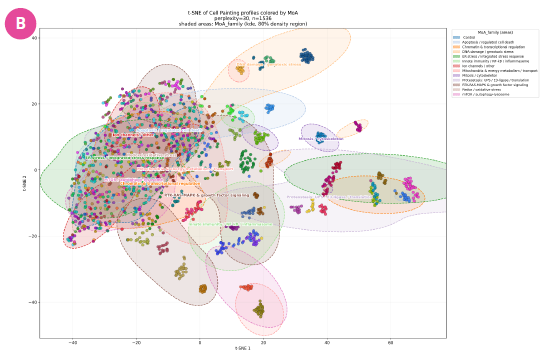
Figure 9. MoA-family organization in phenotypic space. t-SNE embedding of compound profiles grouped by biological mechanism, revealing separation of major phenotypic families. Image Credit: Image courtesy of Leśniak, K., et al., in partnership with ELRIG (UK) Ltd.
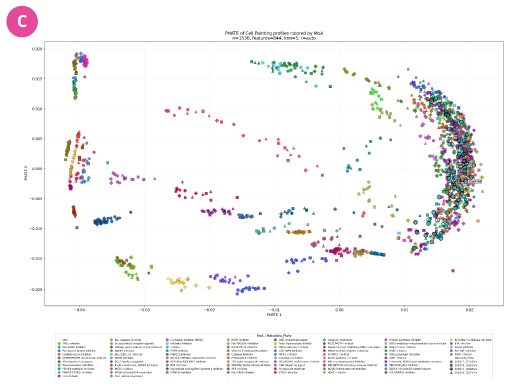
Figure 10. Global PHATE map of compound responses. Compounds occupy distinct yet interconnected regions, highlighting both discrete MoA clusters and gradual transitions between related biological processes. Image Credit: Image courtesy of Leśniak, K., et al., in partnership with ELRIG (UK) Ltd.
Classification results: Prediction
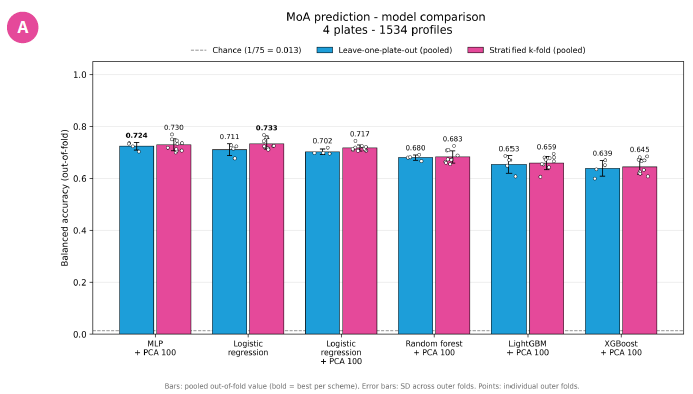
Figure 11. Comparison of classifiers for MoA prediction from Cell Painting profiles. Balanced accuracy of six classifiers predicting 75 MoA classes, evaluated with two nested cross-validation schemes: leave-one-plate-out (blue) and stratified 10-fold (magenta). Bars show the pooled out-of-fold balanced accuracy.
The dashed line marks the chance level (1/75 = 0.013). "+ PCA 100" means the model was trained on the first 100 principal components instead of the raw features. Control wells were excluded from classification. Image Credit: Image courtesy of Leśniak, K., et al., in partnership with ELRIG (UK) Ltd.
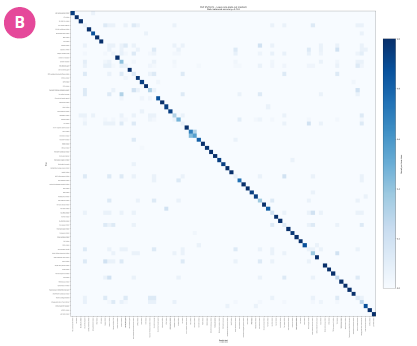
Figure 12. Leave-one-plate-out classification: 33 of 75 MoAs are classified perfectly on unseen plates. These are mechanisms with strong, reproducible phenotypes (DNA damage, p53, kinase signaling, ion homeostasis). Poorly classified MoAs are mainly antioxidants and caspase/inflammasome inhibitors, which likely have no visible phenotype in unstimulated cells and are confused with each other. Image Credit: Image courtesy of Leśniak, K., et al., in partnership with ELRIG (UK) Ltd.
Conclusions
- An end-to-end Cell Painting platform was successfully established, encompassing assay execution, acquisition, automated feature extraction, and phenotypic data analysis.
- Robust and reproducible morphological profiles were generated across independent assay plates, supporting the reliability of the workflow.
- Advanced analytical approaches, including PHATE, t-SNE, and machine-learning-based classification, enabled high-resolution exploration of the phenotypic landscape.
- The next step is integration of Cell Painting data with transcriptomic profiling for multimodal phenotypic characterization.
About Selvita
Selvita is a leading European CRO supporting pharma and biotech companies with flexible, science-driven R&D services. We offer integrated or standalone solutions in drug discovery, preclinical studies, and GMP/GLP-compliant analytical development. With strong expertise across early to late development stages, we help accelerate new therapies by delivering high-quality data that enables smart decisions and faster time to market.
About ELRIG (UK) Ltd.
The European Laboratory Research & Innovation Group (ELRIG) is a leading European not-for-profit organization that exists to provide outstanding scientific content to the life science community. The foundation of the organization is based on the use and application of automation, robotics and instrumentation in life science laboratories, but over time, we have evolved to respond to the needs of biopharma by developing scientific programmes that focus on cutting-edge research areas that have the potential to revolutionize drug discovery.
Comprised of a global community of over 12,000 life science professionals, participating in our events, whether it be at one of our scientific conferences or one of our networking meetings, will enable any of our community to exchange information, within disciplines and across academic and biopharmaceutical organizations, on an open access basis, as all our events are free-of-charge to attend!
Our values
Our values are to always ensure the highest quality of content and that content will be made readily accessible to all, and that we will always be an inclusive organization, serving a diverse scientific network. In addition, ELRIG will always be a volunteer led organization, run by and for the life sciences community, on a not-for-profit basis.
Our purpose
ELRIG is a company whose purpose is to bring the life science and drug discovery communities together to learn, share, connect, innovate and collaborate, on an open access basis. We achieve this through the provision of world class conferences, networking events, webinars and digital content.
Sponsored Content Policy: News-Medical.net publishes articles and related content that may be derived from sources where we have existing commercial relationships, provided such content adds value to the core editorial ethos of News-Medical.Net which is to educate and inform site visitors interested in medical research, science, medical devices and treatments.
Last Updated: Nov 3, 2026