This article and associated images are based on a poster originally authored by Daisy Maiden, Erin Hedges and Will Stebbeds and presented at ELRIG Drug Discovery 2025 in affiliation with LifeArc and University of York.
This poster is being hosted on this website in its raw form, without modifications. It has not undergone peer review but has been reviewed to meet AZoNetwork's editorial quality standards. The information contained is for informational purposes only and should not be considered validated by independent peer assessment.

Background
Motor neuron disease (MND) is a key focus within one of LifeArc’s Translational Challenges. MND is characterized by the degeneration of both upper and lower motor neurons, and current treatment options are limited.1
Stress granules (SGs) are small membraneless organelles that transiently form in response to stress. SGs mediate cellular response to external stress (e.g. heat, oxidative, osmotic, organelle stress1,2,3), in conjunction with the integrated stress response (ISR). SG formation is necessary for the survival of stressed cells and functions by sequestering ribonucleoproteins (RNPs), mRNA, and translation factors. Many of the sequestered mRNAs encode proteins involved in apoptotic signalling cascades, demonstrating the role of SGs in cell survival. 3,4,5
Cellular models of neurodegenerative diseases, as well as chronic stress and cancer, show dysregulated SG and ISR recovery. A prominent phenotype in cellular genetic models of MND is the formation of persistent SGs that do not disassemble once stress-inducing stimuli are removed, highlighting dysregulated stress recovery in MND5.
TDP-43 pathology is seen in >95 % of MND cases, and TDP-43 is a hallmark of the ISR. TDP-43 is essential for SG regulation; action, formation, and disassembly are all negatively affected by TDP-43 depletion6. Therefore, interrogation of TDP-43 in response to stress can aid cellular phenotyping in MND drug discovery.
Methods
Immunocytochemistry was used to detect the core stress granule protein G3BP1 and the MND-relevant protein TDP-43. Signals Image Artist was used to establish robust quantification pipelines, detecting a broad range of potential stress phenotypes. Data generated include nuclear and cytoplasmic texture, spot analysis to measure SGs, and nucleocytoplasmic ratio of proteins.
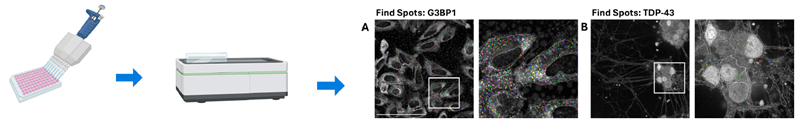
Figure 1. Quantitative imaging protocol for interrogation of stress response pathways. U-2 OS cells and iPSC-derived motor neurons were plated on 96-well plates and incubated with inducers of cell stress. Cells were subject to immunocytochemistry and imaged using an Opera Phenix High Content Screening System. (A) U-2 OS cells immunolabelled for G3BP1 and (B) iPSC-derived motor neurons immunolabelled for TDP-43 (Scale bar = 100 uM). Spot detection software identifies and quantifies G3BP1 and TDP-43 spots. Created in https://BioRender.com. Image Credit: Image courtesy of Daisy Maiden et al., in partnership with ELRIG (UK) Ltd.
Sorbitol is a more effective stress-inducer than thapsigargin in U-2 OS cells
ER stress was induced with the Ca2+ pump inhibitor thapsigargin, which did not consistently induce either SG formation or a clear ISR in U-2 OS cells. Osmotic stress was induced with the sugar alcohol sorbitol, which induced SG formation at 400 mM.
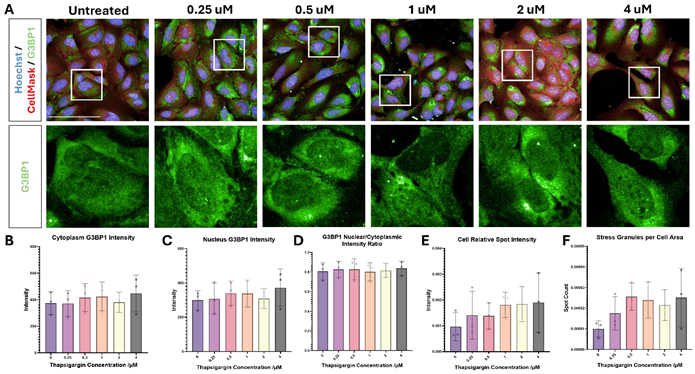
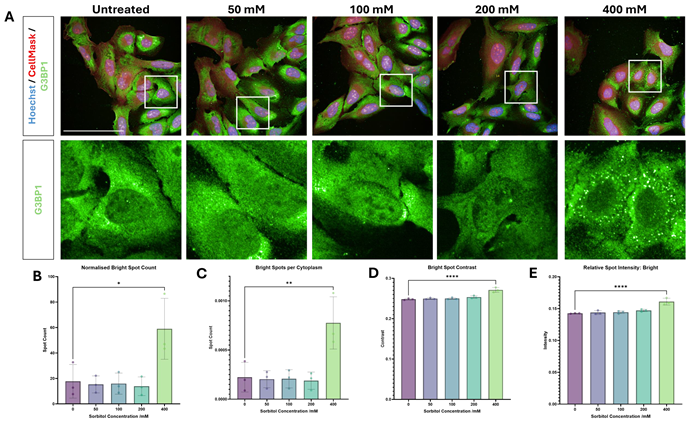
Figure 2. Thapsigargin- and sorbitol-induced stress response in U-2 OS. U-2 OS cells were treated with (A) 0.25 μM – 4 μM thapsigargin for 2 hours, or (B) 50 mM - 400 mM sorbitol for 1 hour, and immunolabelled for G3BP1 (green) and dyed with Hoechst (blue) and CellMask (red) (scale bars = 100 μM). Thapsigargin did not induce a consistent stress response, as evidenced in quantification of (C) G3BP1 intensity in the cytoplasm, (D) G3BP1 intensity in the nucleus, (E) G3BP1 nuclear/cytoplasmic intensity ratio, (F) relative G3BP1 spot intensity, and (G) G3BP1 spot count per cytoplasm area. Stress granule formation was induced with 400 mM sorbitol, as shown in quantification of (H) G3BP1 bright spot count, (I) G3BP1 spot count per cytoplasm area, (J) G3BP1 spot contrast, and (K) relative G3BP1 spot intensity. Statistical analysis: one-way ANOVA with Dunnett’s multiple comparisons test (* = p< 0.05, ** = p< 0.01, **** = p< 0.0001). Image Credit: Image courtesy of Daisy Maiden et al., in partnership with ELRIG (UK) Ltd.
G3BP1 stress granule disassembly is rapid in U-2 OS cells
Optimized sorbitol conditions were used to induce SG formation (400 mM, 1 hour), followed by assessment of SG disassembly following removal of sorbitol.
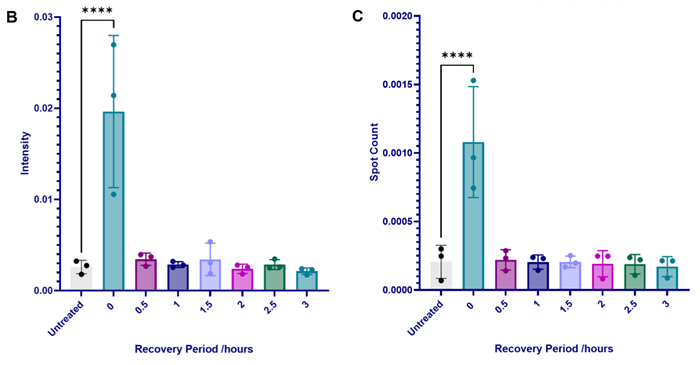
Figure 3. Sorbitol SG disassembly dynamics in U-2 OS cells. (A) U-2 OS cells were treated with sorbitol (400 mM, 1 hour), after which the media was replaced to return cells to basal conditions for 0.5 – 3 hours. Cells were immunolabelled with G3BP1 (green) and dyed with Hoechst (blue) and CellMask (red) (scale bar = 100 μM). Stress granules were induced and subsequently disassembled within 0.5 hours of sorbitol removal. This is shown in quantification of (B) relative G3BP1 spot intensity, (C) average number of G3BP1 spots per cytoplasm area, and cytoplasmic G3BP1 spot area (not shown). Statistical analysis: one-way ANOVA with Dunnett’s multiple comparisons test (**** = p< 0.0001). Image Credit: Image courtesy of Daisy Maiden et al., in partnership with ELRIG (UK) Ltd.
Sorbitol-induced stress response in iPSC-derived motor neurons
Incubation with sorbitol induced an ISR response in motor neurons, as evidenced by an altered nucleocytoplasmic ratio of both G3BP1 and TDP-43, with the strongest effect observed at 300 mM. Formation of SGs was variable, and a robust response could not be quantified using spot detection analysis.
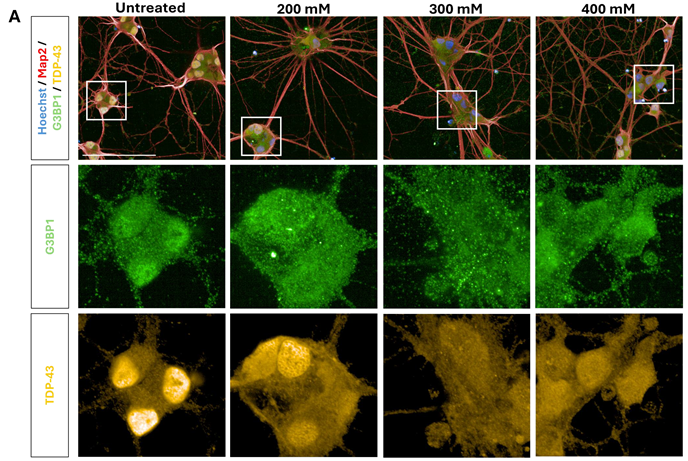
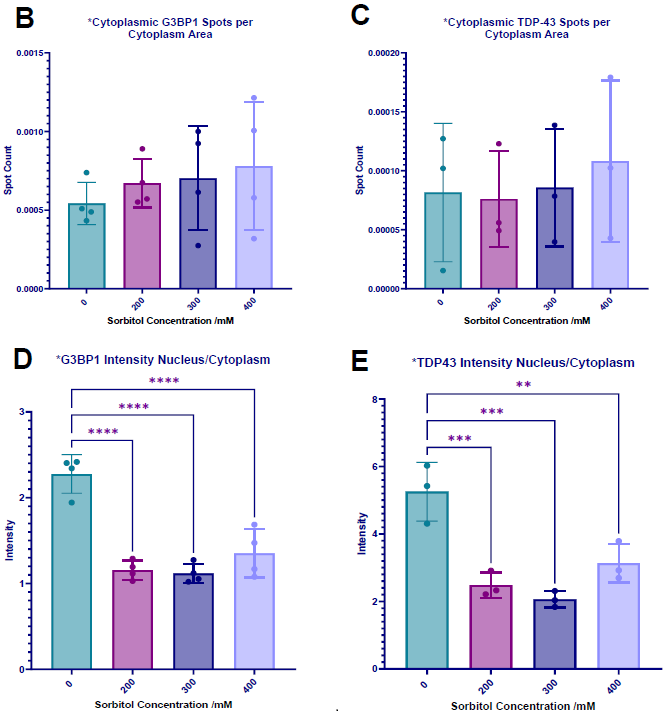
Figure 4. Sorbitol concentration gradient in motor neurons. (A) iPSC-derived motor neurons were treated with 50 mM – 400 mM sorbitol for 1 hour, then immunolabelled for G3BP1 (green), TDP-43 (yellow), Map2 (red), and dyed with Hoechst (blue) (Scale bar = 100 μM). SG formation was not reliably detected, as shown in (B) cytoplasmic G3BP1 spots normalized to cytoplasm area and (C) cytoplasmic TDP-43 spots normalized to cytoplasm area. Cell stress-induced changes in protein localization were detected at 200 mM – 400 mM, as seen in quantification of (D) G3BP1 nuclear/cytoplasmic localization ratio, and (E) TDP-43 nuclear/cytoplasmic localization ratio (a decreased ratio indicates increased relative localization to the cytoplasm). Statistical analysis: one-way ANOVA with Dunnett’s multiple comparisons test (** = p< 0.01, *** = p< 0.001, **** = p< 0.0001). Image Credit: Image courtesy of Daisy Maiden et al., in partnership with ELRIG (UK) Ltd.
Stress recovery trends in genetic MND-mutant motor neurons
Altered nucleocytoplasmic ratio of G3BP1 and TDP-43 was observed in motor neurons treated with sorbitol (0 hours recovery). Within 30 minutes of sorbitol removal, protein localization changes and dynamic recovery profiles were observed in motor neurons, with no clear difference between control and MND lines due to high variability across measured phenotypes.
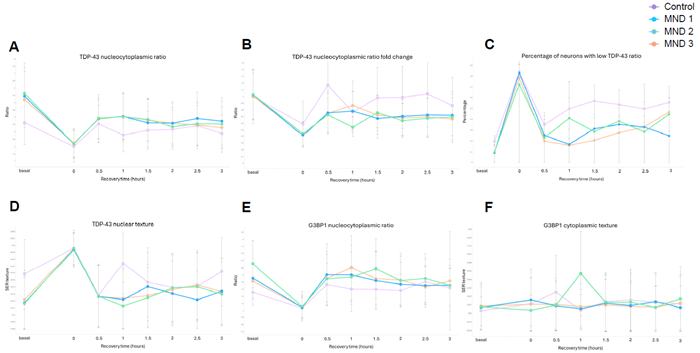
Figure 5. Sorbitol time series to establish stress recovery dynamics in genetic MND mutant motor neurons. Motor neurons were treated with sorbitol (300 mM, 1 hour) after which the media was replaced to return cells to basal conditions for 0.5 – 3 hours. Cells were immunolabelled with G3BP1, TDP-43, MAP2, and dyed with Hoechst, and subject to single-cell analysis. Stress response phenotypes were observed in control and MND lines in response to sorbitol treatment, as shown in the 0-hour recovery condition. Dynamic recovery profiles are observed across (A) TDP-43 nuclear/cytoplasmic ratio (a higher ratio indicates increased relative localization to the nucleus, a decreased ratio indicates increased relative localization to the cytoplasm), (B) TDP-43 nuclear/cytoplasmic ratio normalized to mean baseline ratio for each cell line, (C) the percentage of neurons with low TDP-43 ratio (defined as Median + 2*MAD), (D) TDP-43 nuclear texture, (E) G3BP1 nuclear/cytoplasmic ratio, and (F) G3BP1 cytoplasmic texture. Statistical analysis: two-way ANOVA with mixed effects analysis. Image Credit: Image courtesy of Daisy Maiden et al., in partnership with ELRIG (UK) Ltd.
Summary
- Sorbitol effectively induces SG formation in U-2 OS and HEK293 cells (not shown), and induces an ISR in iPSC-derived motor neurons
- SG disassembly is predictable and rapid in U-2 OS cells
- Recovery from sorbitol-induced stress is dynamic in both control and MND mutant iPSC-derived motor neurons.
References
- Dudman, J. and Qi, X. (2020). Stress Granule Dysregulation in Amyotrophic Lateral Sclerosis. Frontiers in Cellular Neuroscience, 14. https://doi.org/10.3389/fncel.2020.598517.
- Erickson, S.L. and Lykke-Andersen, J. (2011). Cytoplasmic mRNP granules at a glance. Journal of Cell Science, 124(3), pp.293–297. https://doi.org/10.1242/jcs.072140.
- Loughlin, F.E., et al. (2021). Tandem RNA binding sites induce self-association of the stress granule marker protein TIA-1. Nucleic Acids Research, (online) 49(5), pp.2403–2417. https://doi.org/10.1093/nar/gkab080.
- Zhang, P. et al. (2019), eLife. Edited by H. Zhang and H.Y. Zoghbi, 8, p. e39578.
- Hagai Marmor-Kollet, et al. (2020). Spatio-temporal Proteomic Analysis of Stress Granule Disassembly Using APEX Reveals Regulation by SUMOylation and Links to ALS Pathogenesis. bioRxiv (Cold Spring Harbor Laboratory). https://doi.org/10.1101/2020.01.29.830133.
- Khalfallah, Y., et al. (2018). TDP-43 regulation of stress granule dynamics in neurodegenerative disease-relevant cell types. Scientific Reports, 8(1). https://doi.org/10.1038/s41598-018-25767-0.
Acknowledgements:
Erin Hedges (Supervisor, LifeArc), Katie Smith (Supervisor, University of York), Rebecca Girling, Will Stebbeds, Chris Lovejoy, Finbar Gaffey, Chloe Sanders, Megan Dawson, Sam Bourne, Teodora Iancu, Molecular & Cellular Pharmacology (LifeArc), LifeArc Industrial Placements students 2024-2025.
About Life Arc
Life Arc fund, collaborate and provide scientific expertise across some of the most under-served conditions: motor neuron disease, chronic respiratory infection, global health, rare disease, and childhood cancer.
They look to invest in projects where they can use their experience in translational science to remove barriers for early scientific discoveries.
About ELRIG (UK) Ltd.

The European Laboratory Research & Innovation Group (ELRIG) is a leading European not-for-profit organization that exists to provide outstanding scientific content to the life science community. The foundation of the organization is based on the use and application of automation, robotics, and instrumentation in life science laboratories, but over time, we have evolved to respond to the needs of biopharma by developing scientific programmes that focus on cutting-edge research areas that have the potential to revolutionize drug discovery.
Comprised of a global community of over 12,000 life science professionals, participating in our events, whether it be at one of our scientific conferences or one of our networking meetings, will enable any of our community to exchange information, within disciplines and across academic and biopharmaceutical organizations, on an open access basis, as all our events are free-of-charge to attend!
Our values
Our values are to consistently ensure the highest quality of content, making it readily accessible to all, and to maintain an inclusive organization that serves a diverse scientific network. In addition, ELRIG will always be a volunteer-led organization, run by and for the life sciences community, on a not-for-profit basis.
Our purpose
ELRIG is a company whose purpose is to bring the life science and drug discovery communities together to learn, share, connect, innovate and collaborate, on an open access basis. We achieve this through the provision of world-class conferences, networking events, webinars, and digital content.
Sponsored Content Policy: News-Medical.net publishes articles and related content that may be derived from sources where we have existing commercial relationships, provided such content adds value to the core editorial ethos of News-Medical.Net which is to educate and inform site visitors interested in medical research, science, medical devices and treatments.
Last Updated: Nov 13, 2025