From SelvitaReviewed by Olivia Frost
This article and associated images are based on a poster originally authored by Vesna Eraković Haber, Marta Žužić, Sanja Musladin, Ana Butorac, Mislav Novokmet, Snježana Čužić, Vuk Milutinović, Nora Pavičić, Anja Ognjenović, Snježana Dragojević, Ema Prenc, Lidija Požgaj, Dorian Kršul, Dora Fučkar Čupić and Marko Zelić and presented at ELRIG Drug Discovery 2026 in affiliation with Selvita and Clinical Hospital Center Rijeka.
This poster is being hosted on this website in its raw form, without modifications. It has not undergone peer review but has been reviewed to meet AZoNetwork's editorial quality standards. The information contained is for informational purposes only and should not be considered validated by independent peer assessment.

Colorectal cancer (CRC) is one of the most common malignancies worldwide and represents a global public health challenge due to its high incidence and mortality.1 CRC tumors are highly heterogeneous and consist of diverse and interacting cell populations, including malignant epithelial cells, fibroblasts, endothelial cells, and multiple immune cell types, such as T cells, B cells, macrophages, and natural killer cells. Moreover, tumor cells can exhibit distinct transcriptional and functional states associated with proliferation, differentiation, invasion, metabolic adaptation, and therapy resistance.2 Conventional molecular omics approaches used to investigate such heterogeneous tissues often generate averaged signals from large numbers of cells, potentially masking cellular heterogeneity and spatially restricted molecular phenotypes.
Objectives
- Integration of mass spectrometry imaging (MSI) and single-cell RNA sequencing (scRNA-seq) to investigate CRC heterogeneity using tumor and tumor-free colon tissue samples collected from patients undergoing surgical resection.
Samples
- A total of 40 tumor and tumor-free colon tissue samples were obtained from colorectal surgical specimens collected from different regions of the colon. The tissues were analyzed for mutational status, and pathological staging (pT and pN) was determined (Figure 1). Nine tumor and tumor-free colon tissue samples were selected for MSI, of which eight were selected for scRNA-seq experiment.
- This research was approved by the institutional Ethics Committees of the Clinical Hospital Center of Rijeka. All donors provided their written informed consent to participate in this study.
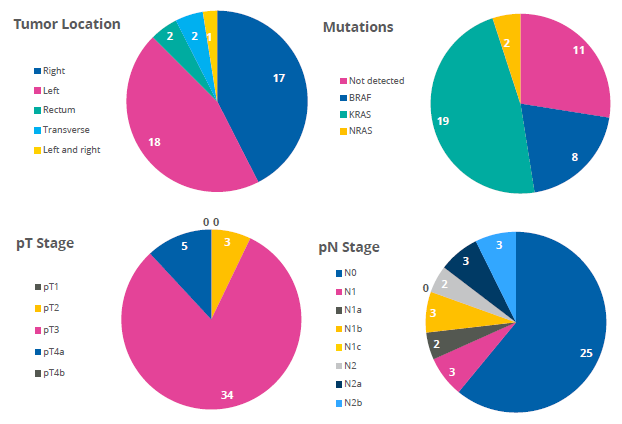
Figure 1. Sample information. Image Credit: Vesna Eraković Haber et al., in partnership with ELRIG (UK) Ltd.
Methods
- MSI experiments were performed using a SynaptXS mass spectrometer equipped with a DESI ion source in positive ion mode.
- Data processing was carried out using HDI software. Differences between distinct structures within tumor tissue were assessed through region of interest (ROI) analysis.
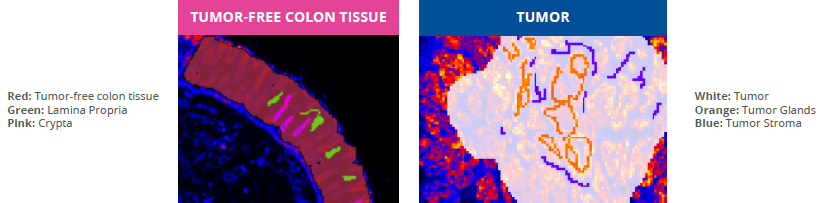
Figure 2. Region of interest (ROI) selection within distinct tissue structures. Image Credit: Vesna Eraković Haber et al., in partnership with ELRIG (UK) Ltd.
- scRNA-seq was performed using the 10x Genomics Chromium platform. Following quality control and bioinformatic processing, cells were clustered and annotated based on their transcriptional profiles.
- Cellular heterogeneity and differences between tissue regions were investigated using differential expression analysis.
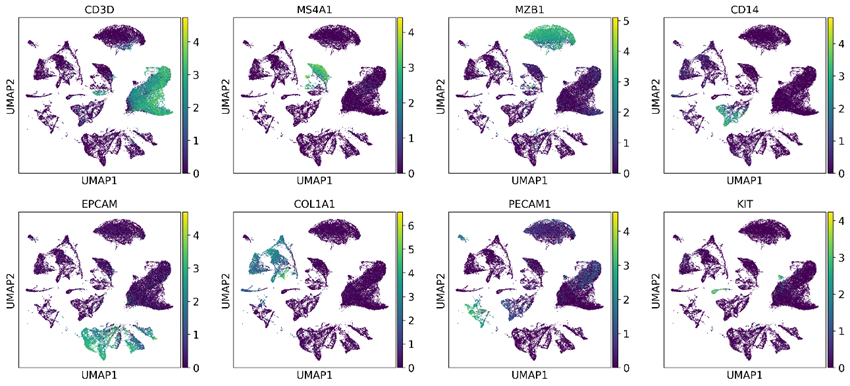
Figure 3. Major cell populations identified by scRNA-seq. UMAP of cells from tumor (CRC) and matched tumor-free colon tissue of 8 colorectal cancer patients, colored by log-normalized expression of canonical marker genes. Image Credit: Vesna Eraković Haber et al., in partnership with ELRIG (UK) Ltd.
Results – MSI
Statistical analysis identified features showing changes in abundance across both broad and fine structural levels (Figure 4).
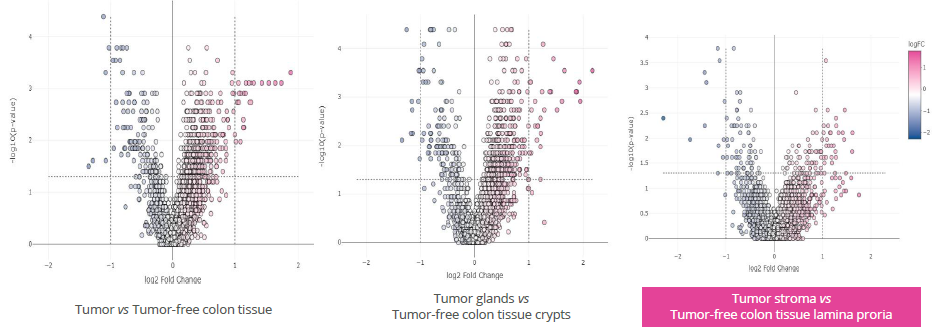
Figure 4. Statistical analysis of MSI results. Volcano plots depicting statistically significant differences between tissue structures. Image Credit: Vesna Eraković Haber et al., in partnership with ELRIG (UK) Ltd.
Co-registration of H&E and single-ion images (Figures 5 and 6) enabled interpretation of MSI data within a biological context.
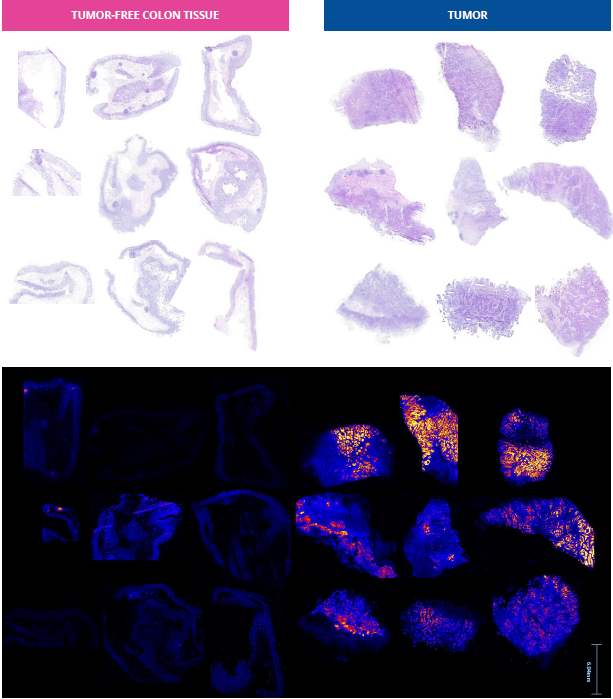
Figure 5. H&E and single-ion images of putative PC32:1, m/z 770.51 in tumor-free colon tissue and CRC tissue. Image Credit: Vesna Eraković Haber et al., in partnership with ELRIG (UK) Ltd.
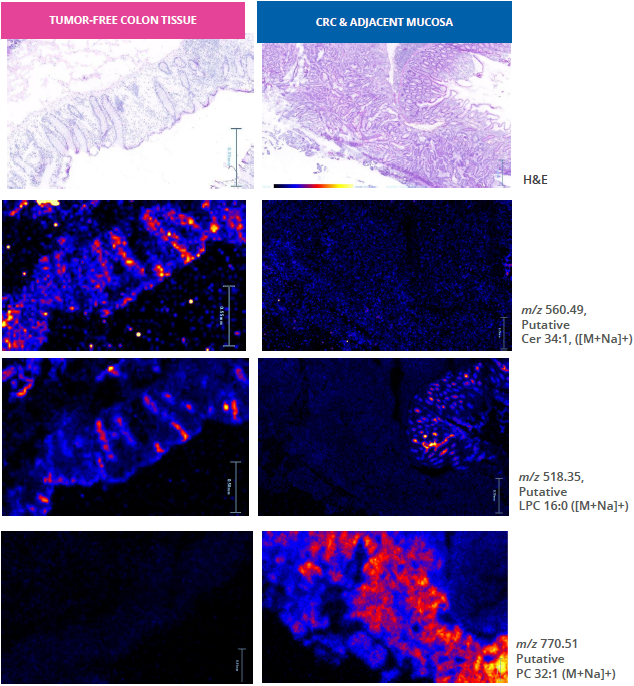
Figure 6. Zoomed-in H&E and single-ion images of CRC tissue section and tumor-free colon tissue. Signal intensities are normalized to a common scale and represent relative quantitative relationships. Image Credit: Vesna Eraković Haber et al., in partnership with ELRIG (UK) Ltd.
Results – scRNA-seq
scRNA-seq profiling of 61,839 cells from tumor and tumor-free colon tissue.
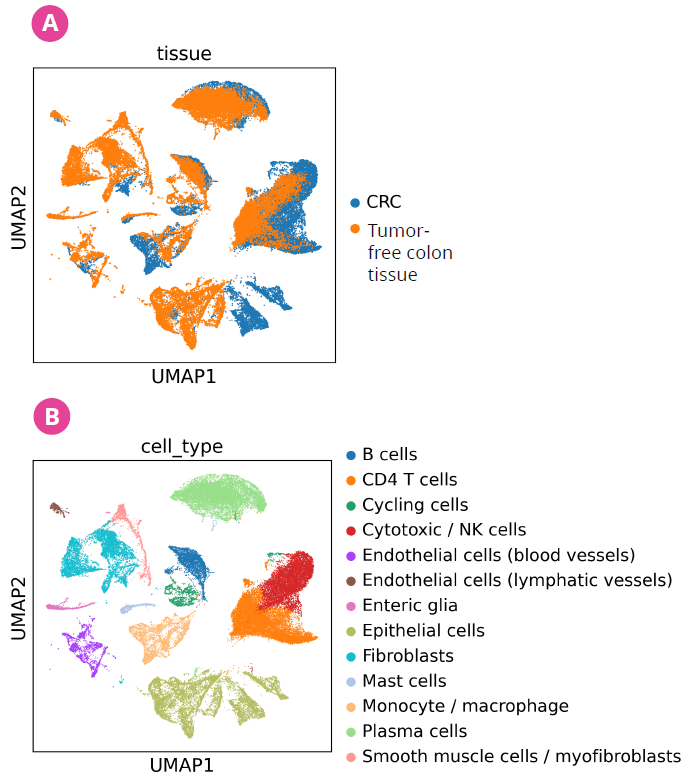
Figure 7. Single-cell atlas of colorectal cancer and tumor-free colon tissue. UMAP of 61839 cells from 8 patients, each with a tumor sample (CRC) and tumor-free colon tissue, after quality control and doublet removal. (A) Cells colored by tissue of origin. Epithelial cells separate by tissue, reflecting the transcriptional difference between tumor and tumor-free colon tissue. (B) Cells colored by annotated cell type. Clusters were identified by Leiden clustering and annotated using canonical marker genes. Image Credit: Vesna Eraković Haber et al., in partnership with ELRIG (UK) Ltd.
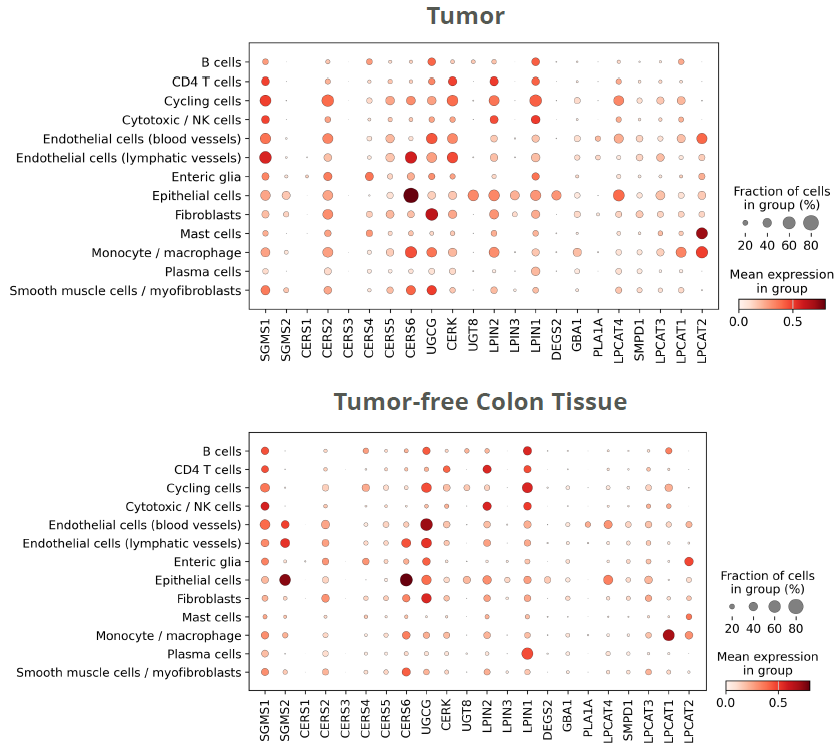
Figure 8. Dot plots showing expression of genes involved in sphingomyelin and ceramide metabolism in annotated cell types in tumor-free colon tissue and tumor tissue. Dot size indicates the fraction of cells expressing the gene, and color indicates log-normalized expression. Image Credit: Vesna Eraković Haber et al., in partnership with ELRIG (UK) Ltd.
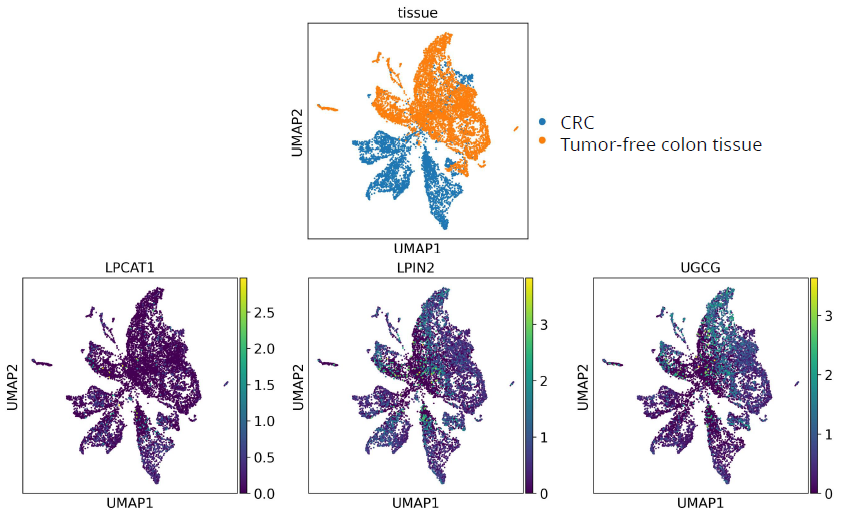
Figure 9. Expression of lipid metabolism genes in epithelial cells. UMAP of epithelial cells only, colored by log-normalized expression of LPCAT1, LPIN2, and UGCG. Image Credit: Vesna Eraković Haber et al., in partnership with ELRIG (UK) Ltd.
LPCAT1 remodels phosphatidylcholine
LPIN2 converts phosphatidic acid to diacylglycerol
UGCG diverts ceramide from sphingomyelin towards glucosylceramide
Discussion and conclusion
The integrated analysis of lipidomic and single-cell transcriptomic data revealed alterations in lipid metabolism within tumor epithelial cells. Our MSI results demonstrated a significant remodeling of membrane phospholipid composition in tumor glands compared with the crypts of tumor-free colon tissue, characterized by decreased LPC(16:0) and increased PC(32:1) levels. Single-cell analysis confirmed increased expression of LPCAT1 in tumor epithelial cells (Figure 10, A). These findings are consistent with alterations in the Lands cycle, an essential pathway involved in phospholipid remodeling and maintenance of membrane homeostasis3.
Furthermore, we identified alterations in ceramide metabolism, with reduced Cer(d34:1) levels in tumor glands accompanied by lower expression of genes involved in ceramide metabolism in tumor epithelial cells, including LPIN2 and UGCG (Figure 10, B).
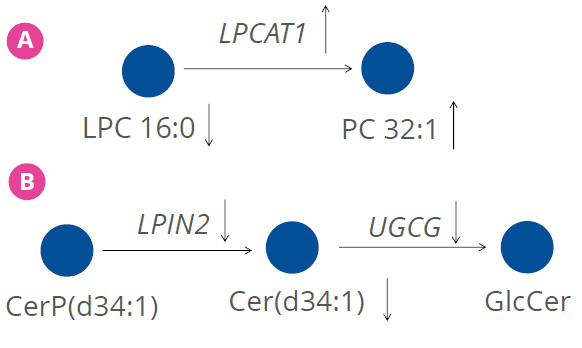
Figure 10. A) Alternation of Lansd pathway in CRC3, B) Cer(d34:1) synthesis and degradation pathway. Image Credit: Vesna Eraković Haber et al., in partnership with ELRIG (UK) Ltd.
In conclusion, complementary lipidomic and single-cell transcriptomic findings provide evidence of coordinated remodeling of phospholipid and sphingolipid metabolism in carcinoma epithelial cells. These metabolic alterations may contribute to changes in membrane composition and cellular signaling during tumor development and highlight the value of integrating spatially resolved lipidomic profiles with cell-specific transcriptional data to characterize metabolic reprogramming in colorectal cancer.
References
- World Health Organization (2023). Colorectal cancer. World Health Organization. Available at: https://www.who.int/news-room/fact-sheets/detail/colorectal-cancer.
- O’Donnell, V.B. (2022). New appreciation for an old pathway: The lands cycle moves into new arenas in health and disease. Biochemical Society Transactions, 50(1), pp.1–11. DOI:10.1042/bst20210579. https://portlandpress.com/biochemsoctrans/article/50/1/1/230864/New-appreciation-for-an-old-pathway-the-Lands.
- Marteau, V., et al. (2026). Single-cell integration and multi-modal profiling reveals phenotypes and spatial organization of neutrophils in colorectal cancer. Cancer cell, 44(1), pp.146–165.e14. DOI:10.1016/j.ccell.2025.12.003. https://www.cell.com/cancer-cell/fulltext/S1535-6108(25)00537-9?_returnURL=https%3A%2F%2Flinkinghub.elsevier.com%2Fretrieve%2Fpii%2FS1535610825005379%3Fshowall%3Dtrue.
About Selvita
Selvita is a leading European CRO supporting pharma and biotech companies with flexible, science-driven R&D services. We offer integrated or standalone solutions in drug discovery, preclinical studies, and GMP/GLP-compliant analytical development. With strong expertise across early to late development stages, we help accelerate new therapies by delivering high-quality data that enables smart decisions and faster time to market.
About ELRIG (UK) Ltd.
The European Laboratory Research & Innovation Group (ELRIG) is a leading European not-for-profit organization that exists to provide outstanding scientific content to the life science community. The foundation of the organization is based on the use and application of automation, robotics and instrumentation in life science laboratories, but over time, we have evolved to respond to the needs of biopharma by developing scientific programs that focus on cutting-edge research areas that have the potential to revolutionize drug discovery.
Comprised of a global community of over 12,000 life science professionals, participating in our events, whether it be at one of our scientific conferences or one of our networking meetings, will enable any of our community to exchange information, within disciplines and across academic and biopharmaceutical organizations, on an open access basis, as all our events are free-of-charge to attend!
Our values
Our values are to always ensure the highest quality of content and that content will be made readily accessible to all, and that we will always be an inclusive organization, serving a diverse scientific network. In addition, ELRIG will always be a volunteer led organization, run by and for the life sciences community, on a not-for-profit basis.
Our purpose
ELRIG is a company whose purpose is to bring the life science and drug discovery communities together to learn, share, connect, innovate and collaborate, on an open access basis. We achieve this through the provision of world class conferences, networking events, webinars and digital content.
Sponsored Content Policy: News-Medical.net publishes articles and related content that may be derived from sources where we have existing commercial relationships, provided such content adds value to the core editorial ethos of News-Medical.net, which is to educate and inform site visitors interested in medical research, science, medical devices and treatments.
Last Updated: Oct 29, 2026