Sponsored Content by Bruker BioAFMReviewed by Mychealla RiceDec 22 2022
Photons of light possess linear and angular momentum. This fundamental characteristic is crucial to trapping objects optically using a highly focused laser beam.
Using this light feature, the Optical Tweezers (OT) method enables the direct trapping and control of objects ranging in size from several tens of nanometers to tens of micrometers.
Optical tweezers also allow the non-invasive manipulation of biological specimens in vivo and in vitro with nanometric precision, while concurrently applying and measuring the piconewton forces acting on the analyzed systems.
Over the last two decades, OT has evolved from a proof-of-concept experiment to an indispensable quantitative force spectroscopy technique for investigating biological specimens, including individual molecules, intricate processes, and interactions in living cells.1
JPK NanoTracker 2 Optical Tweezers
The NanoTracker has given a versatile, force-sensing OT framework to scientists all over the world.2
The latest edition of the NanoTracker 2 system provides a highly sensitive and user-friendly platform, making it suitable for various OT applications. Its capabilities may also be expanded to offer new application areas (Fig. 1).
Thanks to its hardware and software features, it is a highly effective research instrument for examining live cells, their outer membranes, organelles, and bacteria and viruses.3
The wavelength of the trapping laser of the NanoTracker (1064 nm), which is near the minimum light absorption spectrum of water, is well suited for the non-invasive, long-term assessment of living cells.4
During experiments, scientists can optimize the laser exposure of sensitive cell specimens using the NanoTracker 2 system due to the availability of multiple laser power levels and fine-tuning intensity control.
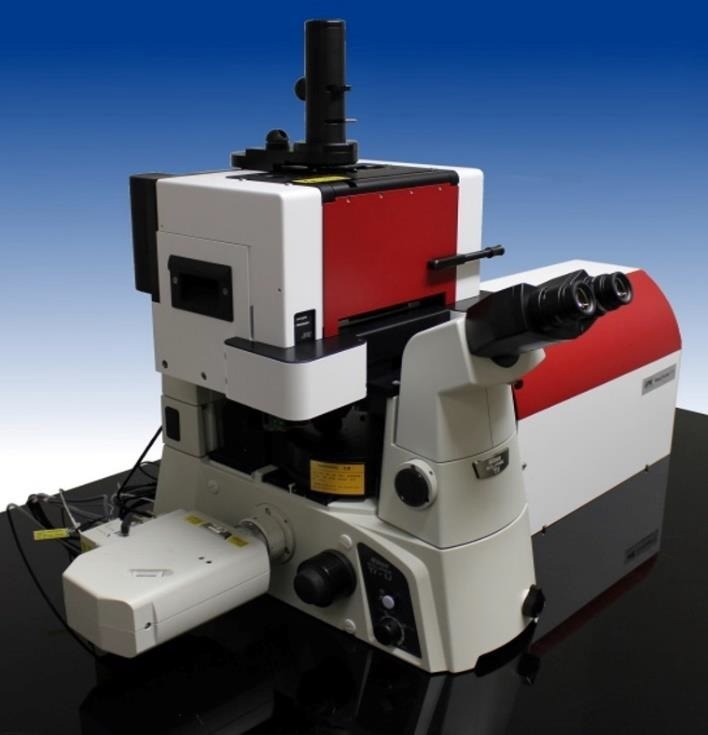
Figure 1. Dual-trap optical tweezers NanoTracker 2 combined with Nikon’s laser scanning confocal microscope. Image Credit: Bruker BioAFM
A key characteristic of the NanoTracker 2 is its optical arrangement, which ensures compatibility with typical inverted microscopes, supporting all the major manufacturers.
As such, it can be coupled with most standard optical microscopy techniques such as epifluorescence microscopy5, differential interference contrast microscopy (DIC)6, total internal reflection fluorescence imaging (TIRF)7, and laser scanning confocal microscopy8 for simultaneous use.
The force and spatial detection schemes of the NanoTracker 2 are based on the well-known back focal plane interferometry approach, which uses fast and responsive quadrant-photodiodes (QPDs) to recognize bead displacement in the optical trap, achieving a 1 nm resolution and sub-piconewton forces at megahertz sampling rates9.
Accessories designed expressly for handling cell specimens, like the LaminarFlowCell Heater or PetriDishHeater, transform the NanoTracker 2 into a truly universal instrument for live cell applications.
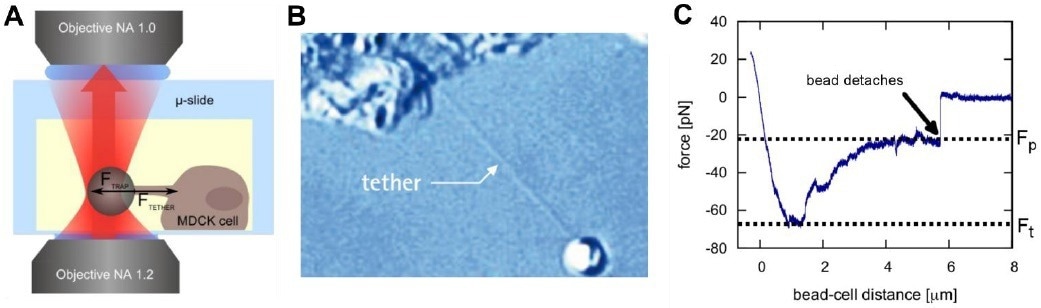
Figure 2. Pulling membrane tethers with a NanoTracker 2. A bead is attached to the membrane of a cell (A). Pulling it away from the cell surface results in the formation of so-called membrane tethers (B). The characteristic forces Ft (tether formation force) and Fp (plateau force) allow the calculation of mechanical membrane characteristics (C). Image Credit: Bruker BioAFM
Characteristics of cell membranes
Conducting quantitative force spectroscopy on live cell specimens remains difficult because of the complexity of the cellular environment. Nevertheless, increasing research is focused on the mechanical characteristics of cells, their molecular components, and their sub-cellular organelles.10
The study of lipid membrane characteristics is an essential element of live cell research. These properties play a significant role in controlling cellular mechanobiology, including shape, division, motility, and differentiation.
The outer cell membrane is a very complex structure that consists of a lipid bilayer and sterol molecules with embedded clustered or isolated proteins. It has several purposes and interacts directly with other components and organelles of the cell through the cytoskeleton.
Numerous processes rely on the mechanical characteristics (tension, viscosity) of the cell membrane.
The extraction of membrane tethers, which are long nanotubes, is a useful technique for studying the elasticity of cell membranes.11 Tethers may either be created spontaneously by cells or extracted artificially from the cell's surface by exerting a local force.
Attaching an optically trapped silica or polystyrene microparticle to the membrane and moving the trap or the sample stage results in the formation of a membrane tether (Fig. 2).
The generated force spectroscopy curves may be evaluated using models to identify the mechanical characteristics of the cell membrane.12,13
Usually, for a tether to be created, the tether formation force Ft must be exceeded. This threshold may be attributed to the membrane-cytoskeleton interactions, which must be overcome.
The required force then plateaus at a lower value where the tether is extended using a constant force, while membrane reservoirs on the surface of the cell supply materials for the growing nanotube.
Figure 2C depicts the usual force spectroscopy curve of a tether elongation procedure. The plateau force Fp relies on the velocity of elongation of the tether and increases for higher speeds of elongation.
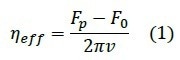
Knowledge of the pulling velocity ν and the plateau force Fp enables the determination of the effective membrane viscosity ηeff12, where F0 is the force necessary to keep the tether stable at zero velocity and R is the cross-sectional radius of the tether:
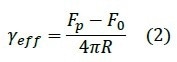
and the effective membrane tension γeff10:
Results from tether formation studies have offered extensive insight into mechanisms, such as cell motility, intercellular signaling, and vesicle trafficking. They are the present focus of numerous research efforts.14
Pulling membrane tethers from Jurkat T-Cells
Using NanoTracker™ 2 OTs incorporated into a Zeiss Axio Vert.A1 inverted microscope, membrane tethers were extracted from live Jurkat T-cells.
The OTs were set up as follows: 1064 nm continuous wave trapping laser with a maximum power of 3 W; two optical traps with independent steering, where one optical trap is regulated by a piezo-mirror and the other by acousto-optic deflectors; a sample nano-positioning unit having a scanning range of 100×100×100 µm; and two state-of-the-art quadrant-photodiodes for independent and simultaneous sensing in both traps.
To keep Jurkat cells under optimal physiological circumstances, they were stored at all times inside an incubator at 37 ˚C and in an adequate cell growth medium.
Immediately before conducting the force spectroscopy experiments using the NanoTracker™ 2, 100-200 µl of the cell suspension was diluted using a pre-heated phosphate-buffered saline (PBS) buffer to a final volume of 1-2 ml in a glass bottom Petri dish with a diameter of 35 mm.
During the tweezing tests, the sample was put in a PetriDishHeater, which maintained the proper physiological temperature for the cells at all times.
Figure 3 depicts a typical membrane tether-pulling experiment along with the corresponding force spectroscopy curve.
To find a cell adhered to the bottom of the Petri dish, the sample must be surveyed in XY with the NanoTracker’s motorized stage (with a 15×15 mm travel range) while imaging under the bright-field settings of the microscope.
This force spectroscopy experiment was conducted with the NanoTracker’s standard “Absolute Force Spectroscopy” setting, which allows the user to select the moving scanner (1st trap, 2nd trap, or the sample scanner) and consists of two motion phases – approach and withdraw.
For the best possible force data collection, it is advised that the sample scanner be a moving scanner that can move the cell towards the trapped bead and then withdraw, keeping the trap stationary throughout the experiment. This guarantees the most accurate force detection and prevents small force signal offsets generated by a moving trap.
The scanner displacement should be adjusted during the approach phase such that following the initial cell-bead contact, up to 100 pN of pushing force is exerted (Fig. 3B, dark blue curve). This would guarantee that the contact between the cell membrane and the bead is sufficiently tight to enable successful tether pulling in the subsequent withdrawal phase.
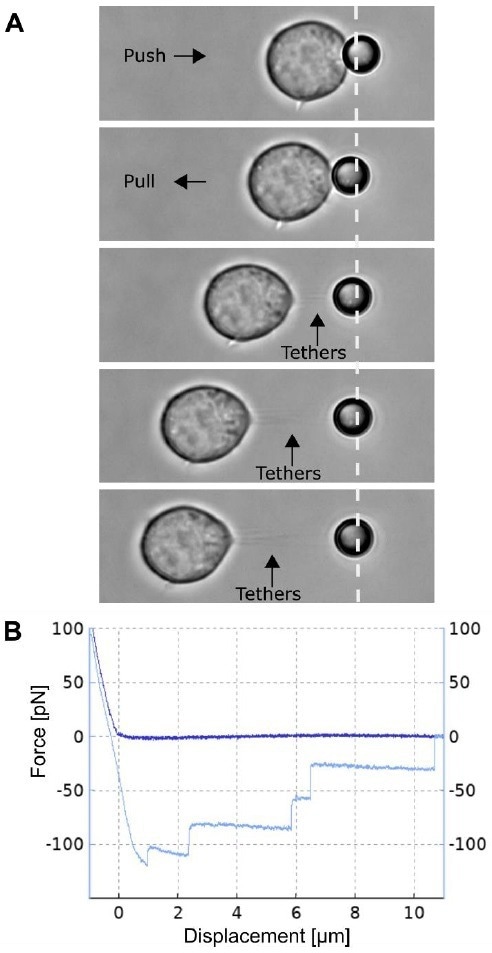
Figure 3. Multiple membrane tether pulling experiment. A) The Jurkat T cell attached to the glass bottom Petri dish is moved by the piezo table towards the trapped 4.5 µm polystyrene bead and pushed (upper panel) with a force of approx. 100 pN, thereby facilitating a non-specific attachment. Following this, the cell and bead are separated at a constant speed of 0.5 µ m/s, thus forming and pulling multiple membrane tethers. B) The plot shows a typical force spectroscopy curve collected during approach of the cell to the bead (dark blue curve) and its withdrawal (light blue curve), showing a tether formation force of approx. 120 pN and multiple rupture events with 35 40 pN steps in the plateau force. Image Credit: Bruker BioAFM
Scanner motion speed is another critical experiment parameter that may be regulated with the NanoTracker software program.
For the collection of the force spectroscopy curves provided, the selected speed was between 0.5-1.0 µm/s for the steady pulling of tethers to lengths of up to multiple tens of microns.
By collecting force spectroscopy curves at various velocities and measuring the Ft and Fp, the viscoelastic characteristics of the membrane may be characterized in more depth.
In this case, the use of plain or carboxylated polystyrene beads did not result in the development of stable tethers in the Jurkat cells. Therefore, the beads and cells were treated with Concanavalin A to produce the nonspecific binding necessary for efficient tether pulling.
The recommended procedure is incubating a batch suspension of the beads with Concanavalin A (5-10 µl Con A to 1 ml of the bead solution). Following a 100-fold dilution, the beads may be added to the Petri dish containing the cells. Similarly, immunoglobulin G (IgG) antibodies may also be used to coat the beads.
Fig. 3A is an illustration of the formation of multiple tethers. For several kinds of living cells, membrane tethers of tens of microns may be pulled with ease. The thickness of these tethers is generally on the order of several hundred nanometers in diameter.
This is at the limit of the optical resolution of traditional bright-field microscopy and more work is necessary to enhance the observation of tethers in optical images.
The tethers depicted in Figure 3A are visible as a consequence of a digital background removal algorithm incorporated in the camera software of the NanoTracker. This approach can significantly increase the signal-to-noise ratio of the images collected with the digital camera.
The associated force spectroscopy curve (Fig. 3B) displays a distinctive multi-step shift in force as the cell-bead separation increases.
These are the instances in which individual tethers rupture in a bunch. It is difficult to ascertain whether such an occurrence is because of the rupturing of an individual tether or multiple tethers. Therefore, caution is advised when interpreting results from such investigations.
In this experiment, however, the team observed a comparable rupture force of around 35-40 pN across all force jumps, allowing them to conclude with a high degree of assurance that all such events constituted rupturing of individual tethers.
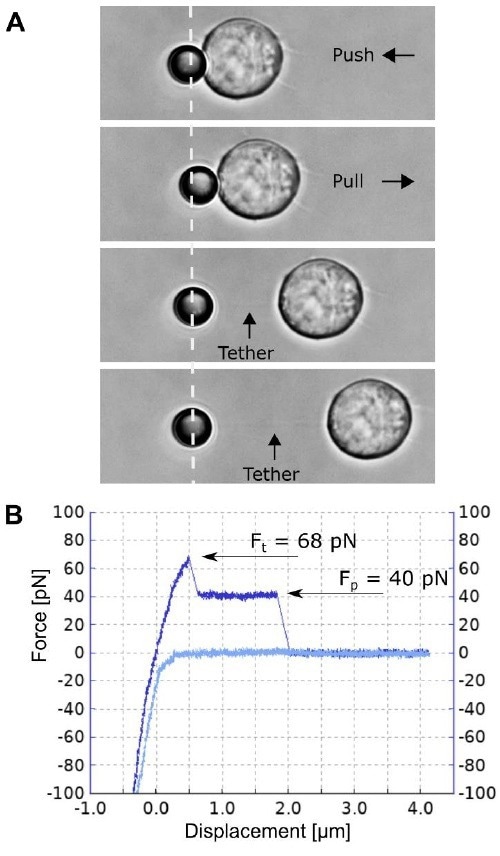
Figure 4. A single membrane tether pulling experiment. A) A Jurkat T cell attached to the glass bottom Petri dish is moved and pushed against the 4.5 µm polystyrene bead, facilitating nonspecific attachment. Separating the cell and the bead at a constant speed of 0.5 µm/s induces a single membrane tether formation and its pulling is recorded. B) The corresponding force spectroscopy curve for the single tether formation and pulling (light blue curve for approach; and dark blue for separation). Image Credit: Bruker BioAFM
Figure 4 depicts the removal of an individual t-cell membrane tether. Compared to the experiment depicted in Figure 3, the cell and bead are separated in the opposite direction, allowing the tether (and the deflecting bead) to be drawn to the trap's right side. This direction is a positive axis for force detection in the NanoTracker software.
Therefore, the pulling forces in figures 3 and 4 should be interpreted as negative and positive, respectively. In Figure 4B's force spectroscopy curve, Ft can be observed and measured at 68 pN.
After the initial formation of the tether, followed by its extrusion from the cell membrane, the force decreases by 28 pN and stays constant at 40 pN, as the length of the tether is increased. Increasing the cell-to-bead separation to around 1.8 µm finally causes tether rupturing.
Conclusion
The team used the latest generation NanoTracker™ 2 OTs to analyze the mechanical characteristics of Jurkat T-cells.
It was shown that the device could be used in experiments involving the pulling of membrane tethers in living cells while, non-invasively, monitoring the tether formation force and plateau force with a high degree of precision and reproducibility.
The cellular mechanical characteristics generated in this manner vary across cell types. Membrane tension may change in various parts of the same cell, in moving cells, and due to compositional variations between the plasma membrane and the substrate surface10.
The development of new applications, particularly in conjunction with high-resolution fluorescence microscopy, is ongoing to shed more insight into the interesting relationship between cellular mechanics, dynamics, and signaling.
For further reading, technical notes by the authors on fluorescence and confocal integration with the NanoTracker optical trapping framework may be found at: https://www.bruker.com/en.html
Acknowledgments
We would like to thank Farah Mustapha and Pierre-Henri Puech (Aix Marseille Univ, CNRS, INSERM, LAI, Marseille, France) for providing us with living Jurkat cells, helping with sample preparation, and providing valuable insights throughout the measurements.
Authors
Produced from materials originally authored by Vitaliy Oliynyk from JPK BioAFM Business, Bruker Nano GmbH
References and Further Reading
- Wozniak, A., Van Mameren, J. and Ragona, S., 2009. SingleMolecule Force Spectroscopy Using the NanoTracker™ Optical Tweezers Platform: from Design to Application. Current pharmaceutical biotechnology, 10(5), pp.467-473.
- van Mameren, J., Eggert, H., Behme, G. and Jaehnke, T., 2011, April. NanoTracker: force-sensing optical tweezers for quantitative single-molecule nanomanipulation. In Novel Techniques in Microscopy (p. JTuA28). Optical Society of America
- Rauch, P., & Jähnke, T., 2014. Optical Tweezers For Quantitative Force Measurements And Live Cell Experiments. Microscopy Today, 22(4).
- Ashkin, A., Dziedzic, J.M. and Yamane, T., 1987. Optical trapping and manipulation of single cells using infrared laser beams. Nature, 330(6150), pp.769-771.
- JPK Instruments, Optical Tweezers Combined with MultiFluorescence Microscopy, Application Note. https://www.jpk.com/app-technotes/products_optical_tweezers
- JPK Instruments, Quantifying cell-virus interactions using NanoTracker™ optical tweezers. Application Note. https://www.jpk.com/app-technotes/products_optical_tweezers
- Lansky, Z., Braun, M., Lüdecke, A., Schlierf, M., ten Wolde, P.R., Janson, M.E. and Diez, S., 2015. Diffusible crosslinkers generate directed forces in microtubule networks. Cell, 160(6), pp.1159-1168.
- Johansen, P. L., Fenaroli, F., Evensen, L., Griffiths, G., & Koster, G. (2016). Optical micromanipulation of nanoparticles and cells inside living zebrafish. Nature communications, 7(1), 1-8.
- JPK Instruments, Characterizing quantitative measurements of force and displacement with optical tweezers on the NanoTracker™. Application Note. https://www.jpk.com/app-technotes/products_optical_tweezers
- Arbore, C., Perego, L., Sergides, M. and Capitanio, M., 2019. Probing force in living cells with optical tweezers: from singlemolecule mechanics to cell mechanotransduction. Biophysical reviews, pp.1-18.
- Nussenzveig, H.M., 2018. Cell membrane biophysics with optical tweezers. European Biophysics Journal, 47(5), pp.499- 514.
- Hochmuth, F.M., Shao, J.Y., Dai, J. and Sheetz, M.P., 1996. Deformation and flow of membrane into tethers extracted from neuronal growth cones. Biophysical journal, 70(1), pp.358-369.
- Nowak, S.A. and Chou, T., 2010. Models of dynamic extraction of lipid tethers from cell membranes. Physical biology, 7(2), p.026002.
- Diz-Muñoz, A., Fletcher, D.A. and Weiner, O.D., 2013. Use the force: membrane tension as an organizer of cell shape and motility. Trends in cell biology, 23(2), pp.47-53
About Bruker BioAFM
Bruker BioAFM, former JPK Instruments AG, is a leading manufacturer of nano-analytical instruments - particularly based on atomic force microscope (AFM) and optical tweezers systems - for life sciences and soft matter applications.
We combine the highest technical skills with visionary applications. Our work applies nanotechnology in ways to provide solutions to challenges facing researchers in life sciences and soft matter today. Driven by inspiration and ambition, it is our conviction that only the best tools are good enough for the research of life. We are listening with the ear of a scientist in detail to the current challenges of our customers and find individual solutions for individual problems. This is how we understand our business.
Sponsored Content Policy: News-Medical.net publishes articles and related content that may be derived from sources where we have existing commercial relationships, provided such content adds value to the core editorial ethos of News-Medical.Net which is to educate and inform site visitors interested in medical research, science, medical devices and treatments.