Sponsored Content by RedShiftBioReviewed by Maria OsipovaFeb 14 2024
Matrix Metalloproteinases (MMPs) are a current focus of research. Investigating them not only enhances our knowledge of protein biology but also generates interest in producing specific MMP inhibitors for therapeutic usage.
Information regarding their structure is critical to support these research aims. This study utilized Microfluidic Modulation Spectroscopy (MMS) to examine the structure of MMP-2, MMP-8, and MMP-9. This was achieved using first and second-generation instruments of RedShift BioAnalytics and the data quality was compared.
The study also examined the similarities and differences in structure among these proteins. While two out of the three MMPs have similar functions, it was observed that all three structures were different.
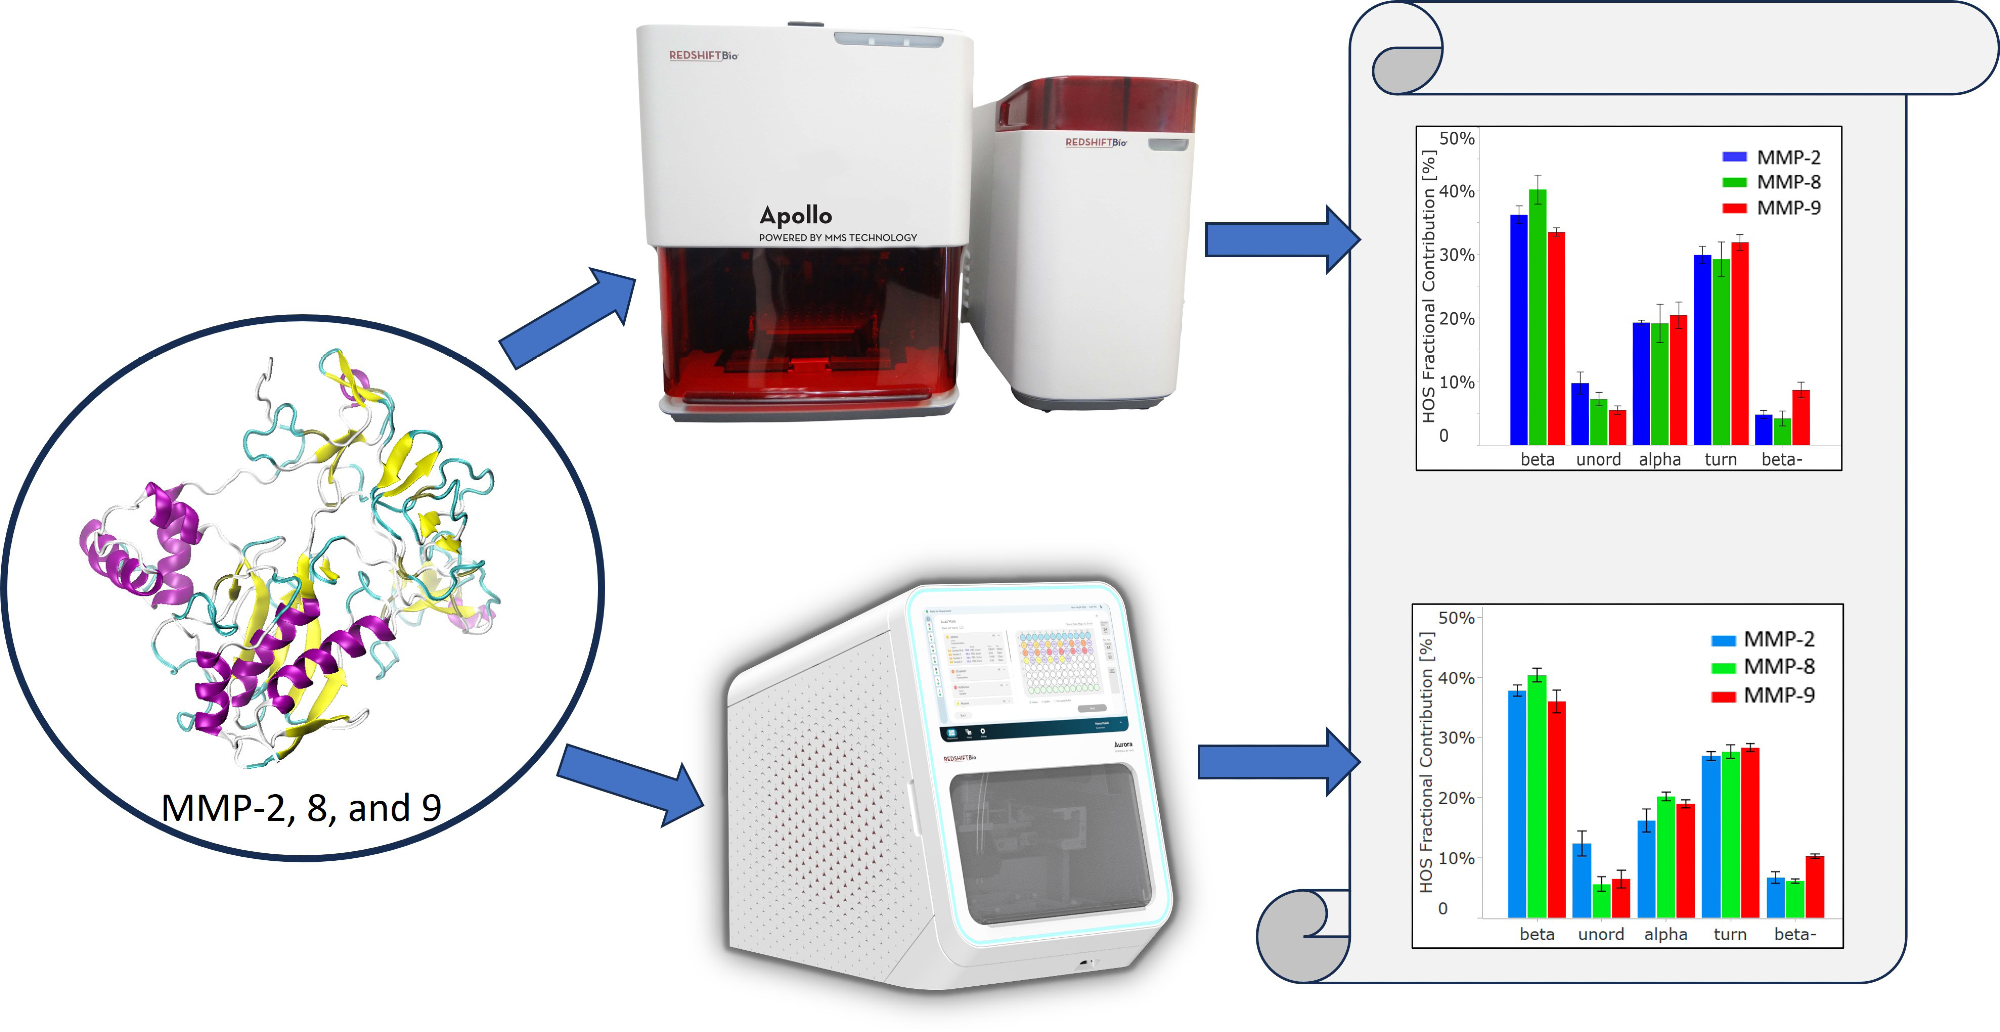
Image Credit: RedShiftBio
Introduction
MMPs are proteases responsible for the breakdown of extracellular matrix (ECM) proteins. Different pathological diseases, such as multiple sclerosis, cancer, and strokes, are linked with the overexpression of specific MMPs.1
Due to their crucial role in lung physiology, heightened MMP levels have been detected in COVID-19 patients.2,3 There is therefore considerable research interest in employing MMPs as biomarkers for predicting the severity of COVID-19 and producing inhibitors for targeted treatment strategies in severe disease cases.4
Knowing the structural differences among different MMPs is important for fulfilling this research aim. Different MMPs play different roles in ECM tissue remodeling. For example, MMP-8, also called collagenase 2, digests collagens, whereas MMP-2 and MMP-9, generally known as gelatinases A and B (respectively), target gelatins.
All these MMPs exhibit heightened expression levels in COVID-19 patients.2,3 Consequently, examining both the structural similarities and variations of these MMPs may be useful.
MMP-2, -8, and -9 have undergone considerable study and structural characterization, especially in their catalytic forms. The crystalline structures of the catalytic domains of these proteins are depicted in Figure 1.6-8 It is shown that the structures of all three proteins share a high degree of similarity.
The catalytic domains have a secondary structure consisting of three alpha-helices and five strands of beta-sheets. Figure 2 shows the full-length proteins, or proenzymes, of MMP-2 and -9.
The pro-domains and the catalytic domains show considerable similarities in their structures. However, the fibronectin domains are significantly different, composed primarily of random coils (unordered structures). The crystalline structure of the full-length MMP-8 has not yet been resolved.
This investigation used MMS to characterize and compare the structures of the proenzymes of MMPs.
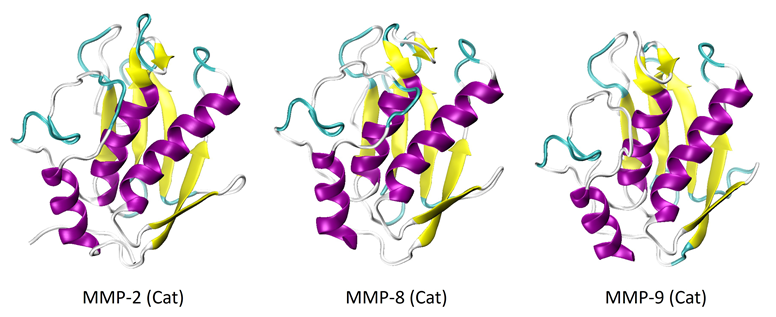
Figure 1. X-Ray crystal structures of the catalytic domains of MMP-2 (PDB: 1QIB), MMP-8 (PDB: 2OY4), and MMP-9 (PDB: 1GKC). Image Credit: RedShiftBio
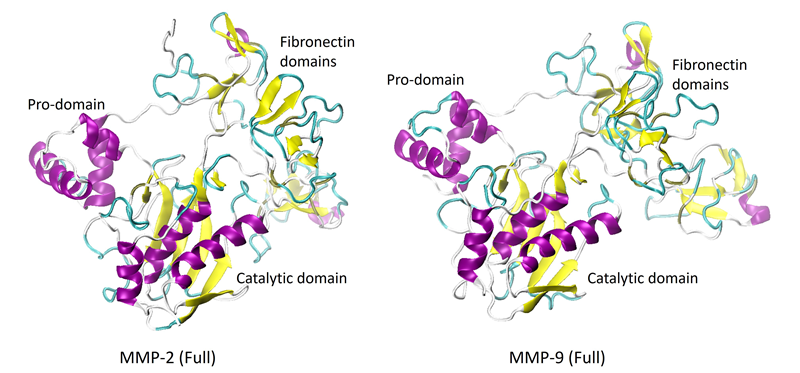
Figure 2. X-Ray crystal structures of the full-length proenzymes of MMP-2 (PDB: 1CK7) and MMP-9 (PDB: 1L6J). The C-terminal hemopexin-like domain is not shown. Image Credit: RedShiftBio
MMS examines the amide I band of the infrared (IR) spectrum to identify protein structure. For accurate and real-time background subtraction, MMS consistently modulates against the reference buffer. The technique’s sensitivity, which is especially important for quality control, is compatible with different formulation buffers.
For this research, the first-generation MMS system, Apollo, and the second-generation instrument, Aurora, were used, with the latter requiring significantly less volume. Both instruments feature a high-power Quantum Cascade Laser. This is substantially more intense in comparison to traditional Fourier transform IR (FTIR) light sources.
This augmented light intensity, coupled with modulating background subtraction renders MMS about thirty times more sensitive than FTIR and five times more sensitive than circular dichroism (CD) for identifying subtle variations in protein structure.5
Methods
SinoBiological (Wayne, PA) provided one milligram each of MMP-2, MMP-8, and MMP-9. For buffer matching, MMP-2 and MMP-9 underwent dialysis against their respective formulation buffers of 50 mM tris, 150 mM NaCl, 10 mM CaCl2, and 0.05 % Brij35 at pH 7.5. MMP-8 was dialyzed against phosphate buffer saline (PBS).
Samples were diluted to 1 mg/mL and a volume of 1 mL. The dialyzed samples underwent triplicate analysis using a first-generation Apollo MMS system. To compare, the same samples were also run on the second-generation Aurora system.
The Aurora instrument needed only 50 µL of sample, while Apollo required approximately 700 µL.
A backing pressure of 5 psi was applied in both systems to transfer the samples into the flow cell. Within the flow cell, samples were modulated at 1 Hz between the sample and reference buffer, using the same buffer employed during dialysis, for background subtraction.
The differential absorbance was quantified within the range of 1588- 1711 cm-1. Replicates were averaged, and the samples were normalized to attain the absolute absorbance spectra.
In this study, data processing followed the procedures provided in the previous application notes. The raw differential absorbance data was transformed into absolute absorbance, normalized by pathlength and concentration. After this, the second derivatives of the absolute absorbance spectra were computed to amplify spectral characteristics.
The resulting plot underwent inversion and baselining, generating a “similarity plot” that qualifies the overlap area when compared to a control. This provided a measure of similarity between samples.
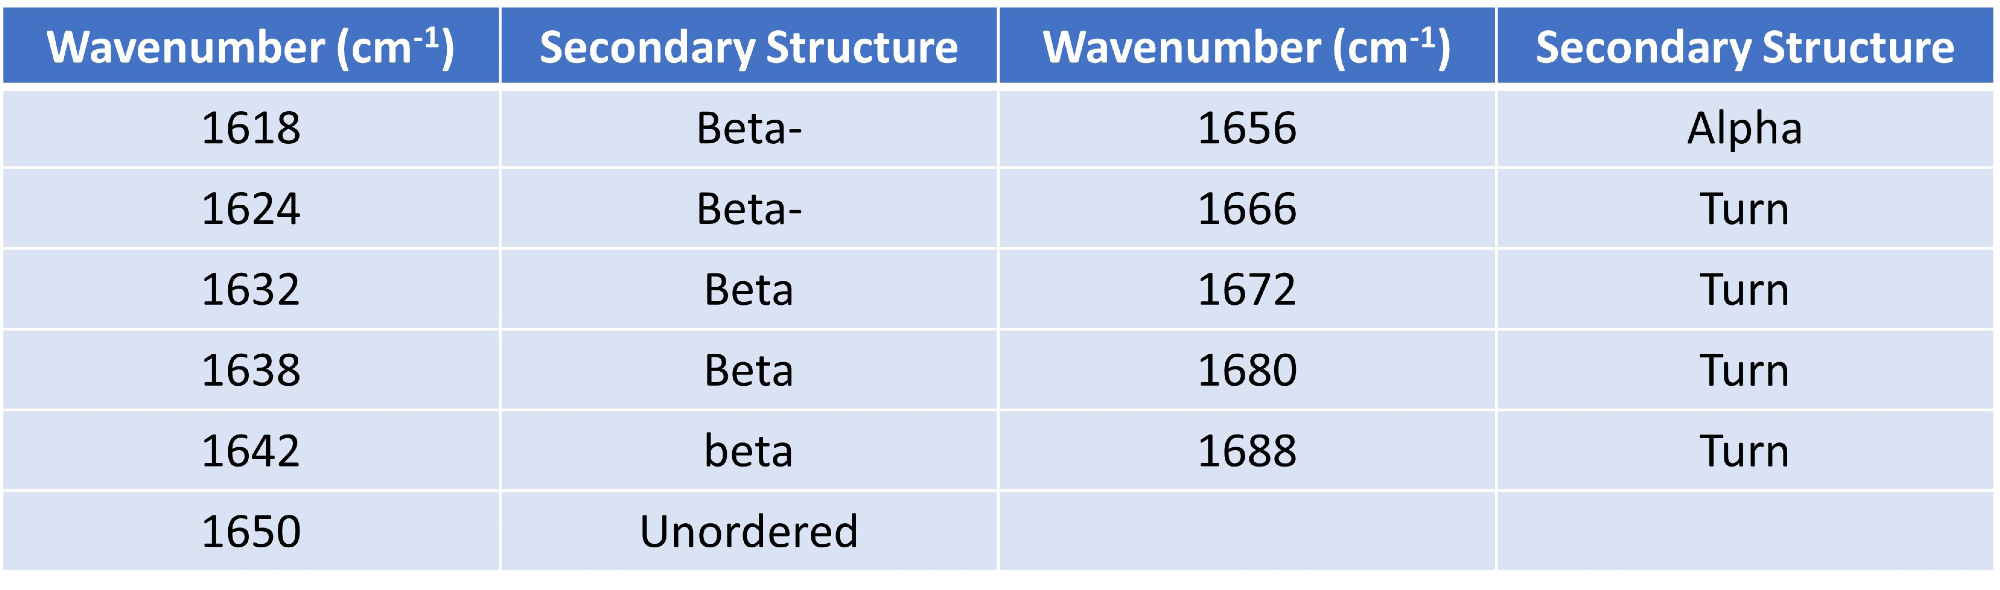
Using Gaussian curve fitting, eleven Gaussians were fitted and the higher order structure (HOS) was calculated relying on the detection of different secondary structural elements across the amide I band (presented in Table 1).
Table 1. Gaussian curve fit settings and HOS structural element designations. Source: RedShiftBio
Results and discussion
Notable structural variations were highlighted by the MMS findings among the three MMP subtypes, MMP-2, MMP-8, and MMP-9 (Figure 3).
Even though all three proteins display a combination of alpha-helix (peaks at 1653-1658 cm-1) and beta-sheet (peaks at 1636-1640 cm-1) structures, their peak positions and intensities are very different, as shown in Figure 3A.
All three spectra also exhibit less intense peaks at 1683-1687 cm-1 and 1618-1624 cm-1, indicating beta-turn and intermolecular beta-sheet structures, respectively.
Surprisingly, despite the functional similarity that might suggest a more structural resemblance between MMP-2 and MMP-9, the MMS findings indicate otherwise. MMP-2 and MMP-9 demonstrate the most significant shifts, approximately 5 wavenumbers, for both the alpha-helix and beta-sheet peaks, while MMP-8 lies between the other two.
With regards to intermolecular beta-sheet peaks, MMP-9 shows a notably more intense peak at 1624 cm-1, 6 wavenumbers greater than MMP-2 and MMP-8, situated around 1618 cm-1.
The HOS bar chart in Figure 3B presents the calculated relative abundance of these secondary structural elements in each protein, derived from Gaussian curve fitting using the delta software.
In all three proteins, beta-sheet is the most abundant secondary structure, followed by beta-turn and alpha-helix.
In alignment with the similarity spectra, MMP-8 contains the highest proportion of beta-sheet structures among the three proteins. MMP-2 shows the highest number of unordered structures, while MMP-9 has the most intermolecular beta-sheet structures (also known as “beta-”).
Despite their comparable biological functions, MMP-2 and MMP-9 do not share as much structural similarity when compared to MMP-8.
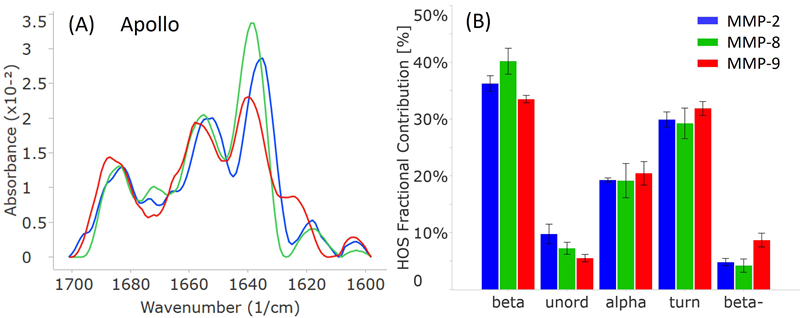
Figure 3. Apollo data showcasing the secondary structural comparison of MMP-2, MMP-8, and MMP-9. (A) Similarity plots (baselined second derivative spectra) illustrating the peaks within the amide-I band for each MMP. (B) HOS plot displaying the relative abundance of each secondary structural element for the MMPs. The error bars represent +/- the standard deviation (N=3). Image Credit: RedShiftBio
To facilitate comparison, all three MMP samples were analyzed on RedShift BioAnalytics’ second-generation instrument, Aurora. As shown in Figure 4A, the distinct peak locations and intensities match well with the Apollo data.
Notably, the Aurora spectra might appear less smooth, particularly around 1680 cm-1. This discrepancy results from an increased resolution, shifting from 4 cm-1 (Apollo) to 1 cm-1 (Aurora), which reduced interpolation in the Aurora spectra.
The HOS bar chart in Figure 4B also validates the breakdown of higher-order structure (HOS) and attests to data quality for Aurora. The error bars and repeatability outlined in Table 2 indicate slightly higher data quality with Aurora, attributed to RedShift BioAnalytics’ enhanced signal averaging with lower volume consumption per replicate.
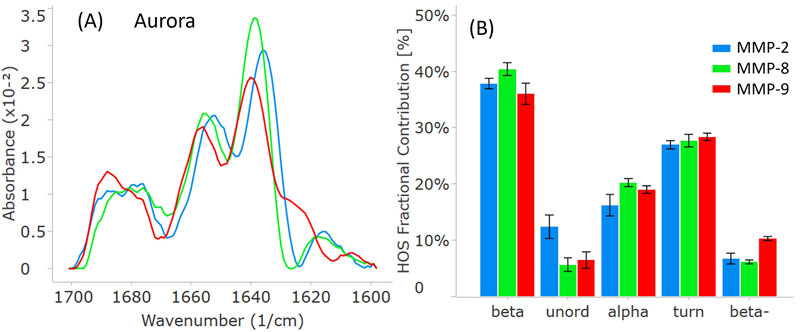
Figure 4. MMP secondary structure plots from the second-generation Aurora instrument. (A) Similarity plots (baselined second derivative spectra) illustrating the peaks within the amide-I band for each MMP. (B) HOS plot displaying the relative abundance of each secondary structural element for the MMPs. The error bars represent +/- the standard deviation (N=3). Image Credit: RedShiftBio
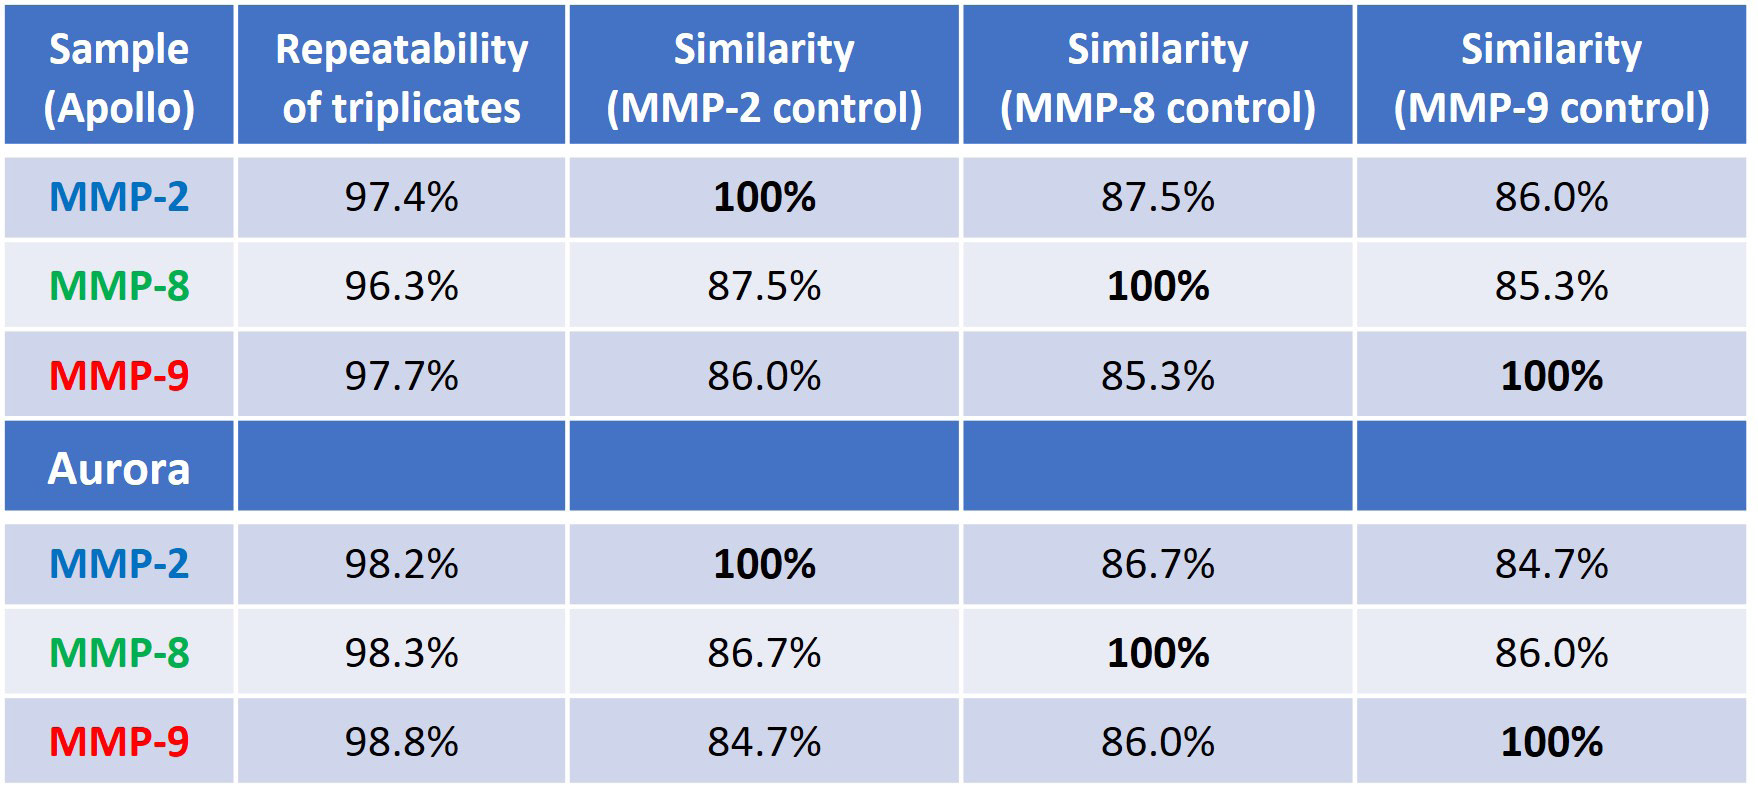
Quantifying structural similarity between the MMP proteins involves measuring the area of overlap (AO) between the similarity plots, shown in Figures 3A and 4A. Table 2 presents information on the replicability of the triplicate determination within each sample and the sample-to-sample similarity expressed as a percentage of AO.
For an in-depth comparison, each MMP protein served as the control sample, denoted by 100 % similarity. The first column used MMP-2, the second used MMP-8, and the third used MMP-9 as the reference.
This underscores the notion of proteins being "similarly different" to each other, where two proteins may share the same percent similarity to a third protein yet still possess distinct structures themselves, as observed in this investigation.
Table 2 illustrates that irrespective of the protein being compared, the other two proteins consistently show comparatively low similarity scores (84-87 % sample-to-sample similarity with 96-97 % replicate repeatability, and >98 % for Aurora). This indicates that all three proteins have different structures.
Table 2. Repeatability of measurement and sample-to-sample similarity (the control for each similarity comparison is set at 100%). The top portion of the table is data from Apollo, and the bottom is comparing data from Aurora. Source: RedShiftBio
Most MMP isoforms, including those examined in this study, possess a C-terminal hemopexin-like domain in their full-length protein after expression (proenzyme). Figure 5, showing MMP-9 as a dimer, displays that this domain has a four-bladed beta-propeller structure consisting of symmetrical blade-shaped beta sheets.
These beta-propeller structures are typically recognized for their crucial role in protein-protein interactions.
Consequently, MMP-9 can often exist in dimeric form. The data obtained from this study indicates the presence of a subtle amount of intermolecular beta-sheet signals at 1618 and 1624 cm-1, suggesting the possibility of dimerization or protein-protein interactions in all these solution samples.
This shows the ability of MMS to examine protein-protein interactions involving the formation of intermolecular beta-sheets.
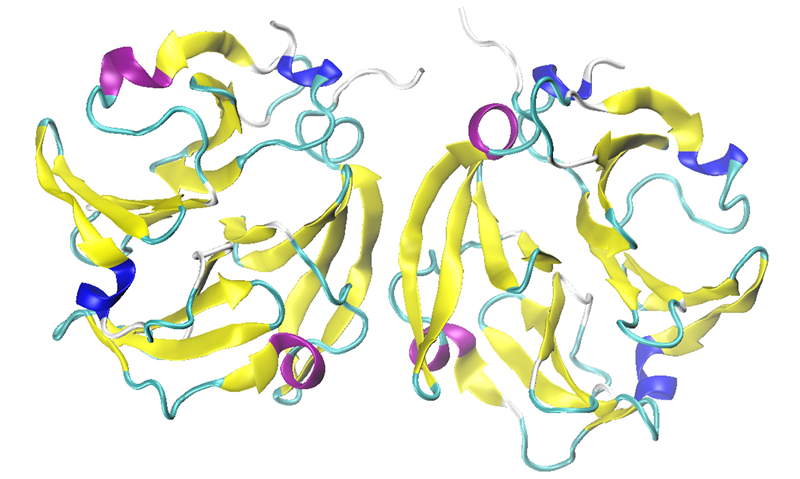
Figure 5. The hemopexin-like domain of MMP-9 in dimeric form (PDB: 1ITV). Image Credit: RedShiftBio
Conclusions
This investigation examined the proenzymes of three MMPs (MMP-2, -8, and -9) by using two MMS systems: the Apollo and the Aurora. This is also the first side-by-side comparison of data attained from these two systems.
Despite all three proteins coming from the same MMP family, and both MMP-2 and MMP-9 being gelatinases, the MMS findings highlighted different secondary structures in these three proteins. Surprisingly, the structures of MMP-2 and MMP-9 were as distinct from each other as they were from MMP-8, in contrast to what the activity would suggest.
MMP-9 exhibited the most intermolecular beta-sheet structure, offering insights into the hemopexin-like dimers. The detected structural difference in the proenzymes matches with their respective crystalline structures.
These results offer critical information about the structural relationships under preparation conditions between the proenzymes and active enzymes of MMPs.
 Download a brochure
References and further reading
- Verma, R. P., & Hansch, C. (2007). Matrix metalloproteinases (MMPs): Chemical–biological functions and (Q) SARs. Bioorganic & medicinal chemistry, 15(6), 2223-2268.
- D Avila-Mesquita, C., et al. MMP-2 and MMP-9 levels in plasma are altered and associated with mortality in COVID-19 patients. Biomed Pharmacotherapy. 2021;142:112067.
- da Silva-Neto, P. V., et al. Matrix Metalloproteinases on Severe COVID-19 Lung Disease Pathogenesis: Cooperative Actions of MMP-8/MMP-2 Axis on Immune Response through HLA-G Shedding and Oxidative Stress. Biomolecules. 2022;12(5):604.
- Gelzo, M. et al. Matrix metalloproteinases (MMP) 3 and 9 as biomarkers of severity in COVID-19 patients. Sci Rep 12, 1212 (2022).
- Kendrick, Brent S. et al. "Determining spectroscopic quantitation limits for misfolded structures." Journal of pharmaceutical sciences 109.1 (2020): 933-936.
- Morgunova, E., Tuuttila, A., Bergmann, U., Isupov, M., Lindqvist, Y., Schneider, G., & Tryggvason, K. (1999). Structure of human pro-matrix metalloproteinase-2: activation mechanism revealed. Science, 284(5420), 1667-1670.
- Bertini, I., Calderone, V., Fragai, M., Luchinat, C., Maletta, M., & Yeo, K. J. (2006). Snapshots of the reaction mechanism of matrix metalloproteinases. Angewandte Chemie International Edition, 45(47), 7952-7955.
- Elkins, P. A., Ho, Y. S., Smith, W. W., Janson, C. A., D'Alessio, K. J., McQueney, M. S., ... & Romanic, A. M. (2002). Structure of the C-terminally truncated human ProMMP9, a gelatin-binding matrix metalloproteinase. Acta Crystallographica Section D: Biological Crystallography, 58(7), 1182-1192.
About RedShiftBio
RedShiftBio is redefining the possibilities for analyzing protein structure and concentration.
RedShiftBio has developed a proprietary life sciences platform combining our Microfluidic Modulation Spectroscopy (MMS) and expertise in high-powered quantum cascade lasers that provide ultra-sensitive and ultra-precise measurements of molecular structure. These structural changes affect critical quality attributes governing the safety, efficacy, and stability of biomolecules and their raw materials. This combination of technologies is available to researchers in our fully-automated Aurora and Apollo systems and is backed by a global network of sales, applications, service, and support teams to address all market needs.
Alongside our commitment to further innovation in the formulations and development space, RedShiftBio also supports biopharmaceutical manufacturing with HaLCon, our bioprocess analytics platform, purpose-built to measure protein titer at time of need.
Led by an experienced management team with a proven track record of success in both large instrumentation companies and commercializing disruptive technologies, RedShiftBio is here to support your research, development, and manufacturing goals. Our instruments can be found in the majority of the leading biopharmaceutical companies and CDMOs in the world. We also run product demonstrations and process samples in the StructIR Lab, located in our Boxborough, MA headquarters, as well as at partner sites including the Wood Centre in Oxford, UK, Spectralys/UCB in Brussels, Belgium, and at Sciex laboratories in Redwood Shores, CA.
RedShiftBio is backed by Waters Corporation, Illumina Ventures, Technology Venture Partners, and one undisclosed leading life science company.
Sponsored Content Policy: News-Medical.net publishes articles and related content that may be derived from sources where we have existing commercial relationships, provided such content adds value to the core editorial ethos of News-Medical.Net which is to educate and inform site visitors interested in medical research, science, medical devices and treatments.