Sponsored Content by RedShiftBioReviewed by Maria OsipovaFeb 15 2024
Microfluidic Modulation Spectroscopy (MMS) is an ultra-sensitive and user-friendly tool for secondary structure analysis.1 MMS offers a more robust alternative to Circular Dichroism (CD) spectroscopy, an analytic technique traditionally employed to determine secondary structure.
In this study, a biological protein example was employed to investigate the performance of MMS compared to CD for secondary structure analysis. The biological function of the protein investigated (protein X) is known to differ with fluctuations in concentration.
In a diluted state (1 mg/mL), protein X acts as a monomer. However, at higher concentrations (approximately 80 mg/mL) it oligomerizes and functions collectively. Protein X is also known to be rich in beta-sheets and has an unordered tail that is believed to play a vital role in reorganization along the oligomerization mechanism.
In this study, various concentrations of protein X were investigated, ranging from 0.8 to 80 mg/mL, using MMS and CD spectroscopy. The secondary structural analysis provided by these two methods was then compared.
MMS has previously been reported as the most sensitive secondary structure technique for the detection of subtle structural changes (down to 0.76 %).1 Signals from various secondary structural motifs are well-separated across the probed spectral range and appear on the same order of magnitude.
In contrast, CD spectroscopy provides reliable structural characterization of helix-rich proteins but is less effective at determining other structural content, such as beta-sheets, unordered structures, and turn structures.
This is because CD signals from different structural motifs overlap and have positive and negative components, which can cancel each other out. This makes deconvolution difficult due to destructive interference. The alpha-helical signal is also considerably stronger than those from other structural motifs, further distorting the structural deconvolution.
Figure 1 shows a comparison between MMS and CD spectra for a helical protein (BSA) and a beta-sheet-rich protein (IgG1).
 and CD (right) spectra of BSA (dashed lines) and IgG1 (solid lines), highlighting the overlapping features and differing intensities for alpha-helix and beta-sheet structures in CD and compared to the more well-resolved peaks in MMS. This figure was adapted from Kendrick et al.1")
Figure 1. MMS (left) and CD (right) spectra of BSA (dashed lines) and IgG1 (solid lines), highlighting the overlapping features and differing intensities for alpha-helix and beta-sheet structures in CD and compared to the more well-resolved peaks in MMS. This figure was adapted from Kendrick et al.1 Image Credit: RedShiftBio
Methods
A concentration series of protein X was prepared in PBS, yielding concentrations between 0.8 and 80 mg/mL. Samples were measured and analyzed using a first-generation RedShiftBio MMS production system equipped with sweep scan capability (RedShiftBio, Boxborough, MA, US).
A chemically identical buffer was loaded pairwise with each sample onto a 96-well plate for background subtraction. A modulation frequency of 1 Hz and a microfluidic transmission cell of 23.5 µm optical pathlength were run on the instrument.
The differential absorbance spectra of the sample against its buffer reference were measured across the amide I band (1,714–1590 cm-1). For each spectrum, three repeat measurements were collected and averaged and data was analyzed using the delta analysis software.
Specific samples from the dilution series were also measured using a Chirascan CS/PCS CD spectrometer employing a 0.01 mm quartz cuvette, designed specifically for a broader concentration range, as described in Ioannou et al.2
Three repeat measurements were taken between 200 and 360 nm, each consisting of 10 co-adds. CD data was calculated as mean residue ellipticity and fitted with the CDpro routine for secondary structure analysis.3
Both methods were qualified by conducting a secondary structure analysis of the lysozyme sample, a primarily alpha-helical protein. To achieve this, MMS and CD spectra of 1 mg/mL hen egg white lysozyme (HEWL) in water were collected and analyzed.
Results and analysis
Method qualification: MMS and CD qualification using lysozyme
Prior to investigating the oligomerization of protein X, 1 mg/mL lysozyme dissolved in water was used as a simpler and well-characterized example to validate the MSS and CD techniques used for structural characterization. Higher order structure (HOS) analysis using MMS and CD is shown in Figure 2, alongside crystallographic data from the protein database file 1DPX4, employed as a control.
.4")
Figure 2. Secondary Structure Analysis based on MMS and CD measurements of lysozyme at 1 mg/mL in water, compared to crystallographic data (pdb identifier: 1DPX).4 Image Credit: RedShiftBio
Both MMS and CD identify approximately 45 % alpha-helix, 25 % turn structure, 15 % beta-sheet, and 15 % unordered structure. This primarily supports the presented crystal structure of lysozyme.
Both techniques slightly underestimate turn structure (approximately 10%) and overestimate beta-sheet content, making lysozyme appear marginally more structured in solution than in its crystal structure.
MMS and CD analysis are in good agreement with each other, highlighting the applicability of both techniques for the analysis of a simple, helix-rich protein such as lysozyme at low concentration (1 mg/mL) dissolved in water.
To assess the suitability of MMS and CD for a more complex and biologically relevant system, these techniques will be employed to investigate the concentration-dependent structure-function relationship of protein X fueled by oligomerization. The experimental challenge of this study is that protein X is beta-rich, the buffer background is PBS (not water), and the concentration range needed to be covered is broad (0.8-80 mg/mL).
Case study: MMS and CD on the oligomerization mechanism of protein X
MSS and CD spectra of protein X in PBS at various concentrations (between 0.8 and 8- mg/mL) were recorded,
The overall MMS spectral differences between higher concentration samples and the 0.8 mg/mL sample were calculated using Weighted Spectral Difference (WSD) and are shown in Figure 3. The largest variation arises between 1 and 20 mg/mL, while smaller changes are seen at concentrations above 20 mg/mL.
The Figure 3 inset resolves the corresponding spectral differences across the amide I band, demonstrating that changes occur predominantly in the beta-sheet and unordered range. The beta-sheet band is shown to increase as a function of concentration while the unordered band decreases correspondingly.
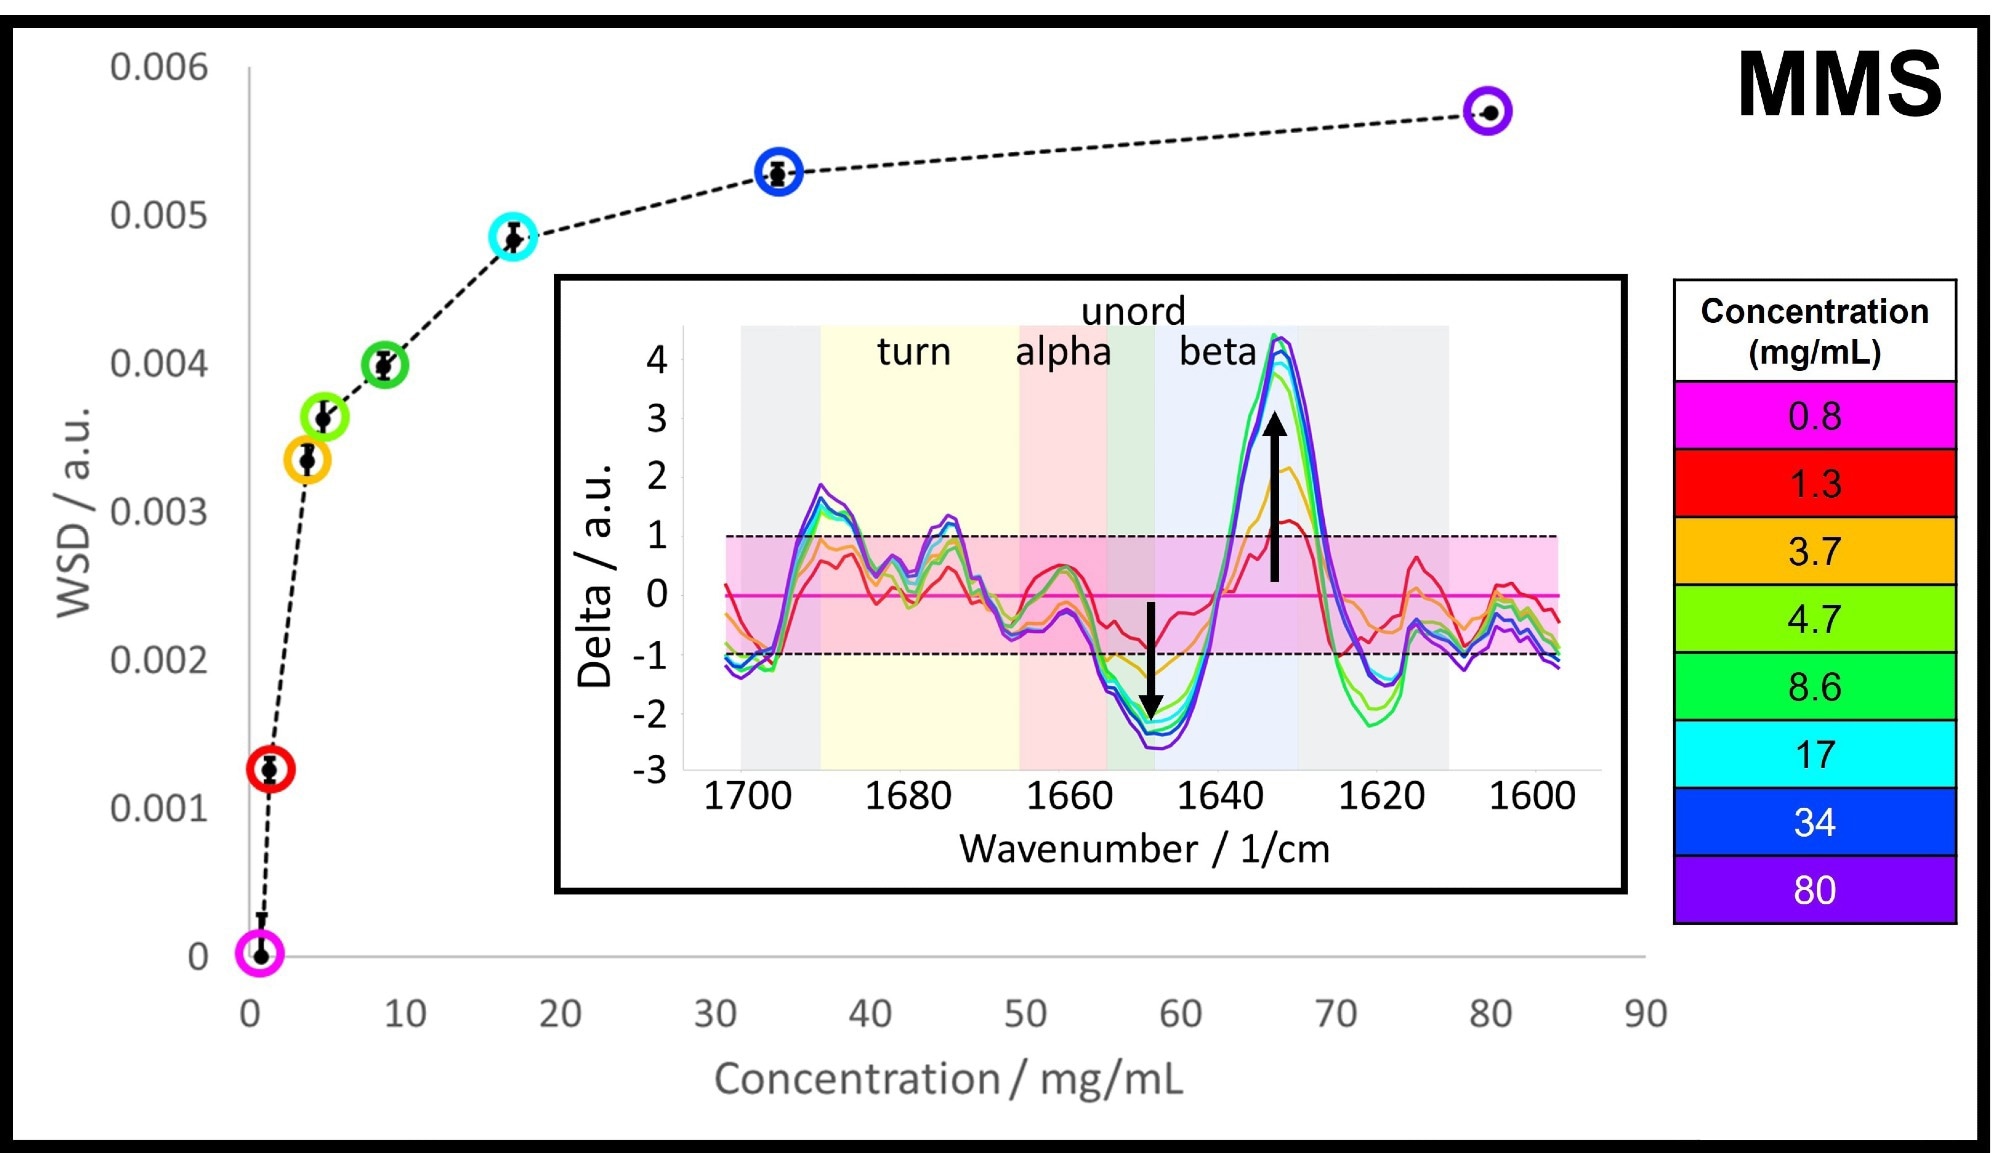
Figure 3. The MMS Weighted Spectral Difference (WSD) across the measured concentration range between 0.8 and 80 mg/mL. Inset: Difference spectra with 0.8 mg/mL as the control spectrum, the background is color-coded according to the typical spectral ranges for the individual structural motifs. Image Credit: RedShiftBio
To determine the HOS of protein X at the various concentrations, a Gaussian deconvolution model and a CDpro fitting routine were applied to the MMS and CD spectra, respectively. The results from these fittings are presented in Figure 4.
MMS analysis predicts approximately 55 % beta-sheet, 30 % turn, 10 % alpha-helix, and 5 % unordered structure. Increasing concentration is also shown to increase the beta-sheet fraction by 2 % and decrease the unordered content by 2.9 %.
According to the proposed mechanism, the unordered tail of protein X drives oligomerization by interacting with neighboring protein X monomers, becoming more structured.
In contrast, CD-based analysis does not detect transient structural change with increasing concentration in protein X. Rather, large changes in structural composition are predicted (-40 % beta-sheet fraction, +40 % helical content, and non-monotonic changes in turn and unordered content).
These results indicate that CD analysis was less effective at predicting the structure of protein X compared to lysozyme, failing to detect crowding-induced structural changes.
Figure 4. HOS analysis based on MMS (top) and CD (bottom) spectra of protein X in PBS at different concentrations between 1.3 and 80 mg/mL. The MMS and CD spectra are shown each in the corresponding insets in the top right corners. The MMS spectra are presented as the inverted and baselined 2nd derivative spectra, the CD spectra are shown as mean residue ellipticity. Image Credit: RedShiftBio
Conclusions
MMS has proven to be a suitable technique for characterizing proteins with various structural profiles, across a broad range of concentrations. MMS spectra can be employed to detect subtle structural changes in proteins, the predictions of which corroborate the previously proposed oligomerization mechanism of protein X.
CD spectroscopy was shown to produce acceptable results from a helix-rich protein in water at low concentrations. However, for protein X oligomerization, CD spectroscopy struggles to deliver realistic HOS predictions for beta-sheet-rich proteins.
References and further reading
- Kendrick, B. S., et al. (2020) Determining Spectroscopic Quantitation Limits for Misfolded Structures. J Pharm Sci, 109, pp.933–936.
- Ioannou, J. C., et al. (2015) Characterising the secondary structure changes occurring in high-density systems of BLG dissolved in aqueous pH 3 buffer. Food Hydrocoll, 46, pp.216–225.
- Sreerama, N., et al. (2000) Estimation of protein secondary structure from circular dichroism spectra: Comparison of CONTIN, SELCON, and CDSSTR methods with an expanded reference set. Anal Biochem, 287, pp.252–260.
- Weiss, M. S., et al. (2000) Biological Crystallography Crystallization, structure solution and refinement of hen egg-white lysozyme at pH 8.0 in the presence of MPD. Acta Crytallographica, D56, pp.952–958.
About RedShiftBio
RedShiftBio is redefining the possibilities for analyzing protein structure and concentration.
RedShiftBio has developed a proprietary life sciences platform combining our Microfluidic Modulation Spectroscopy (MMS) and expertise in high-powered quantum cascade lasers that provide ultra-sensitive and ultra-precise measurements of molecular structure. These structural changes affect critical quality attributes governing the safety, efficacy, and stability of biomolecules and their raw materials. This combination of technologies is available to researchers in our fully-automated Aurora and Apollo systems and is backed by a global network of sales, applications, service, and support teams to address all market needs.
Alongside our commitment to further innovation in the formulations and development space, RedShiftBio also supports biopharmaceutical manufacturing with HaLCon, our bioprocess analytics platform, purpose-built to measure protein titer at time of need.
Led by an experienced management team with a proven track record of success in both large instrumentation companies and commercializing disruptive technologies, RedShiftBio is here to support your research, development, and manufacturing goals. Our instruments can be found in the majority of the leading biopharmaceutical companies and CDMOs in the world. We also run product demonstrations and process samples in the StructIR Lab, located in our Boxborough, MA headquarters, as well as at partner sites including the Wood Centre in Oxford, UK, Spectralys/UCB in Brussels, Belgium, and at Sciex laboratories in Redwood Shores, CA.
RedShiftBio is backed by Waters Corporation, Illumina Ventures, Technology Venture Partners, and one undisclosed leading life science company.
Sponsored Content Policy: News-Medical.net publishes articles and related content that may be derived from sources where we have existing commercial relationships, provided such content adds value to the core editorial ethos of News-Medical.Net which is to educate and inform site visitors interested in medical research, science, medical devices and treatments.