Sponsored Content by RedShiftBioReviewed by Maria OsipovaFeb 15 2024
RedShiftBio’s Microfluidic Modulation Spectroscopy (MMS) technology integrates laser spectroscopy, signal processing, and microfluidics. It is the driving force behind the Aurora protein analyzer, a powerful instrument that employs mid-infrared to directly probe the protein backbone and provide information on protein stability, concentration, aggregate formation, and higher-order structure.
In contrast to alternative techniques, proteins can be easily measured over a large range of concentrations in various environments without complications related to protein size, light shattering, or background fluorescence.
Aurora, like its predecessors Apollo and AQS3pro, employs a tunable mid-infrared quantum cascade laser to create an optical beam that is focused through a microfluidic transmission cell of an optical path approximately 25 μm in length.
The laser is run in continuous wave mode. This creates a high-resolution (< 0.001 cm-1 linewidth), low-noise beam with little straying light, which reduces measurement error and expands the range of directly measurable concentrations.
The sample (protein) solution and a matching water/buffer reference stream are introduced as a continuous flow into the transmission cell. The two streams are quickly modulated across the laser beam path (1 - 10 Hz) to alternately measure the reference and sample stream to generate a differential measurement (MMS). This technique produces an accurate, drift-free, and highly sensitive absorption measurement.
After transit through the microfluidic cell, the beam is focused onto a thermo-electrically cooled MCT detector. The whole optical system is sealed and purged with dry air to reduce interference from the strong absorption lines of atmospheric water vapor.
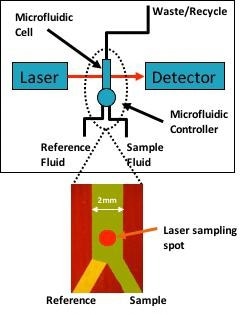
Figure 1. Simplified block diagram of the protein analyzer shows the tunable laser which probes the protein solution through a microfluidic cell. The microfluidic cell rapidly alternates between sample and reference (buffer) streams to continuously refresh the instrument referencing to dramatically improve measurement precision, accuracy, and signal-to-noise. Image Credit: RedShiftBio
In this example, RedShiftBio’s data acquisition system and software were used to acquire and process the data. All measurements were recorded at an ambient temperature (approximately 21 °C) without temperature control of the fluids or measurement cell. Figure 1 shows a simple block diagram of the instrument.
To generate the sample absorption spectrum, the absorption spectra of the protein were measured through optical scanning of the amide I band in 4 cm-1 increments from approximately 1700 to 1600 cm-1. The amide I band is a direct measure of the strength of the carbonyl band along the protein backbone and is very sensitive to the local environment, reflecting the protein sub-structure type and state of aggregation.1
Figure 2 shows the absorption spectra of four commercially available proteins. Automatic analysis of the spectra can provide information such as protein concentration and secondary structure. Variations in the adsorption band can also be used to monitor aggregation and protein stability.
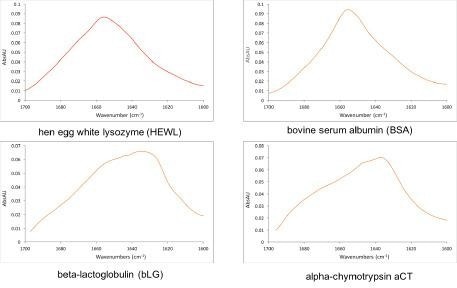
Figure 2. Representative measurements of commercially available proteins made with RedShiftBio’s MMS analyzer at 10 mg/mL. The laser scans the amide I band and directly probes the protein backbone. The shape of the band reveals the protein sub-structure making it a powerful tool for protein characterization. Image Credit: RedShiftBio
Higher-order structure
Vibrational spectroscopy is well-regarded as an effective tool for the study of protein and peptide substructure.2 The amide I band (1700 - 1600 cm-1) analyses the C=O stretch vibration of the peptide linkages making up the backbone structure of the protein.3
The varying patterns of dipole-dipole interactions; hydrogen bonding; and the geometric orientations in the α-helices, β-sheets, random coil structures, and turns induce different absorption features in the amide I band, which correlate with these second-order structures.4
To quantitatively determine the relative amounts of these substructures, an analysis of the absorption spectrum can be used. It can be subsequently employed as a powerful probe for protein characterization and aggregation and thermal and chemical stability.5-7
Although such a technique is very powerful, measurement is typically limited to concentrations over approximately 10 mg/mL for Fourier transform infrared spectroscopy (FTIR) and 30 mg/mL for Raman.8
Ultraviolet circular dichroism (UV-CD), which is one of the most common tools for secondary structure analysis, is relatively insensitive to β-sheet formation and struggles to detect the very important intermolecular β-sheet structures that form during aggregation.8
Although UV-CD operates at a lower concentration range than FTIR (typically, 0.2-2 mg/mL compared to 10-200 mg/mL),9 it is not able to directly measure higher concentration ranges usually encountered in formulation.
However, RedShiftBio’s Aurora can measure protein structure over a broad dynamic range, from 0.1 mg/mL to above 200 mg/mL. This eliminates the requirement for sample preparation steps, such as pre-concentration or dilution, which can introduce variability across samples—thus requiring multiple measurements and sample replicates.
The analyzer can also measure the protein at the actual concentration of interest, in both discovery and formulation. These abilities are not found in modern protein measurement tools.
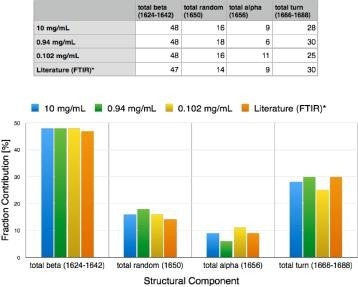
Figure 3. Secondary structure for alpha-chymotrypsin measured over 2 orders of magnitude of concentration (0.1 to 10 mg/mL). Results agree with conventional FTIR results (likely Dong paper, 20 or 30 mg/mL). Image Credit: RedShiftBio
Using an automated fitting method of analysis, the calculation of protein secondary structure for α-chymotrypsin was conducted on proteins with good reproducibility over a concentration range from approximately 0.1 to 10 mg/mL (Figure 3). These results demonstrate good accuracy, supporting FTIR methods as well as published values from X-Ray and UV-CD.
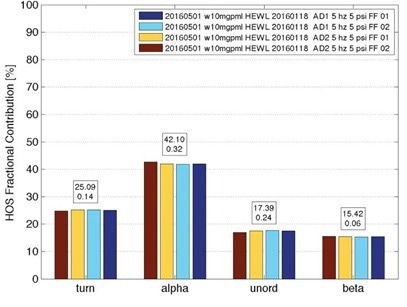
Figure 4. Secondary structure for hen egg white lysozyme (HEWL) from 7 separate measurements of 10 mg/mL samples, taken over one month, showing standard deviation of about 1%. Image Credit: RedShiftBio
Figure 4 highlights the repeatability of RedShiftBio’s analyzer. Multiple measurements of lysozyme (HEWL) were taken for one month, with secondary structure findings showing a standard deviation of approximately 1 %.
Most protein analysis technologies are limited by concentration ranges of about one order of magnitude. However, RedShiftBio’s MMS analyzer can conduct measurements at concentration ranges over three orders of magnitude.
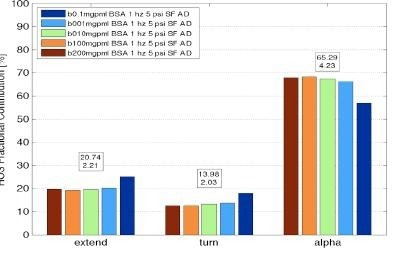
Figure 5. RedShiftBio system measurements of protein secondary structure of Bovine Serum Albumin over a range of concentration from below 0.1 mg/mL to 200 mg/mL showing good analysis results over three orders of magnitude in concentration. Image Credit: RedShiftBio
Figure 5 illustrates an example of an analysis from bovine serum albumin measurements at concentrations spanning from 0.1 to 200 mg/mL, producing five secondary structure components useful for protein fingerprinting.
Stability and aggregation
The ability of RedShiftBio’s analyzer to directly measure protein secondary structure makes it a powerful tool for investigating the mechanisms of protein aggregation and stability.
The intricacies of the process can be followed easily, as the proteins are subjected to stress and they begin to change from their native states. IR measurements are particularly sensitive to β-sheet structures, which dominate protein antibody-based therapeutics.
MMS is one the only techniques capable of directly monitoring the formation of aggregates because of its ability to measure intermolecular β-sheet structures.
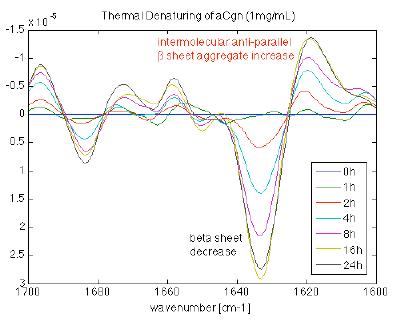
Figure 6. Incubation of a 1 mg/mL high beta sheet containing protein incubated at elevated temperature from 0 to 24 hours. As the incubation time increases the (intramolecular) beta sheet content decreases and the intermolecular beta sheet increases, indicative of aggregate formation. Image Credit: RedShiftBio
Thermal stability
A high β-sheet content protein at 1 mg/mL was incubated at an elevated temperature for varying periods. The protein series was measured with the MMS analyzer. The second derivative spectra were overlaid and plotted to augment the spectral changes.
Figure 6 displays the loss of intramolecular β-sheet content as a function of incubation time. At the same time, the amount of intermolecular β-sheet structure increases, associated with the formation of aggregates. Changes in other areas reflect the state of the protein sub-structure, providing additional details of the denaturation process.
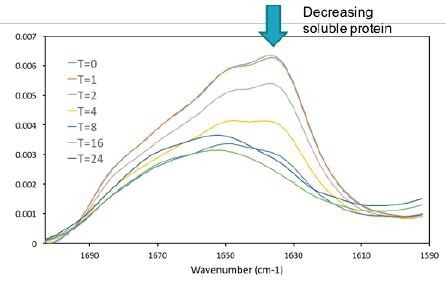
Figure 7. As the protein was denatured insoluble aggregate formed and precipitated out of solution. As only the supernatant of the sample was measured the intensity of the amide I band decreases, which is a direct indicator of soluble protein concentration. Image Credit: RedShiftBio
As the protein was incubated, an insoluble aggregate formed and settled at the bottom of the sample tubes. Only the supernatant fraction was decanted and measured. The overall concentration of soluble protein decreased at longer incubation times (as shown in Figure 7).
The amide I absorbance decreased to less than half of its initial value, corresponding to less than 0.5 mg/mL of protein in solution. The absorption data also clearly shows changes in the spectral shape of the amide I band.
Chemical stability
Another method of studying protein stability is chemical stress studies. Alcohols are well known to denature the native state of proteins, often stabilizing the α-helical conformation in unfolded proteins and peptides.10
A relatively high concentration of β-lactoglobulin was formulated in phosphate buffer at pH 7.4 at concentrations of 0, 20, 40, and 60 % isopropyl alcohol (IPA). The IPA/protein series were measured by Far UV-CD and MMS to track structural changes.
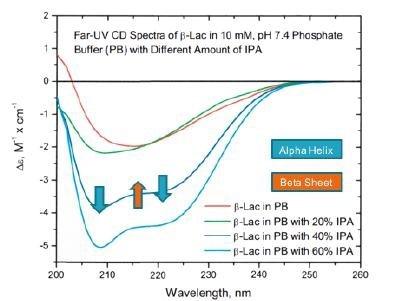
Figure 8. Far UV-CD studies of the chemical denaturation of beta lactoglobulin in IPA show increasing alpha helix and decreasing beta sheet. Image Credit: RedShiftBio
Figure 8 shows the UV-CD data, where a clear increase in the α-helix structure occurs alongside a general decrease in β-sheet.
The RedShiftBio data (shown in Figure 9), highlights an increase in the α-helix form at higher IPA concentration and a significant and clear shift in the β-sheet type from approximately 1630 cm-1 to 1620 cm.-1 This also indicates the formation of an intermolecular β-sheet, something that the CD method does not readily show.
The RedShiftBio’s MMS analyzer delivers superior insight into the denaturation process and operates across a larger range of concentrations.
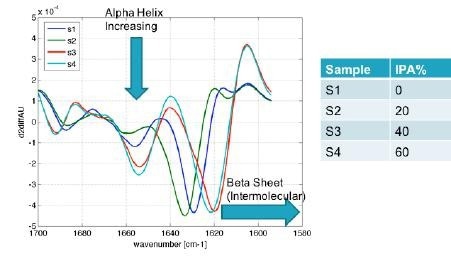
Figure 9. Protein characterization results obtained using RedShiftBio’s MMS analyzer not only show the expected increase in alpha helix with higher alcohol concentrations, but also shows a shift in beta sheet to the aggregate form of intermolecular beta sheet. Image Credit: RedShiftBio
Protein similarity
Protein similarity is a quantitative method that analyzes the amide I band spectra between proteins to detect small changes in protein secondary structure.
The ability to measure small differences in spectra can be a powerful tool in monitoring the biosimilarity of a protein, due to the sensitivity of the amide I band to changes in protein secondary structure.11,12 Several algorithms have been proposed for this comparison, including the area of overlap (AO) and the correlation coefficient.11,12
Here, the AO method was used to calculate protein similarity. Results can be compared to published results using other methods to assess the sensitivity of the MMS method in comparison to more traditional methods such as FTIR and UV-CD.
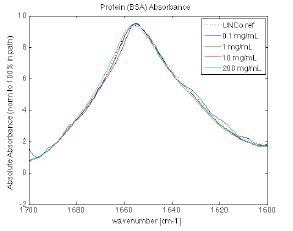
Figure 10. Protein similarity of BSA is shown over the range from 0.1 mg/ml to 200 mg/ml, again demonstrating the viability of the measurement technique to compare protein characteristics across multiple steps of protein development. Image Credit: RedShiftBio
Figure 10 shows the overlaid spectra of BSA at four concentration levels acquired by the MMS analyzer (0.1, 1.0, 10, and 200 mg/mL). In the center of the concentration range, similarity exceeds 97 %. This reduces at the high and low ends.
For comparison, FTIR values in the literature show a mean similarity of 86.37 % ± 7.98 % at a single concentration of 10 mg/mL for HEWL.12 Using this technique, protein similarity values of 97 % were only obtainable at a concentration of 50 mg/mL.
The RedShiftBio MMS analyzer achieves better similarity with less deviation over a concentration range that significantly exceeds the measurement capability of FTIR. The technique also addresses the limitations of UV-CD at higher concentrations, which can require additional workflow and dilutions.
Quantitation
Protein quantitation is vital in biochemistry research and development, in applications ranging from providing data for biopharmaceutical lot release to enzymatic studies. Direct assay techniques include UV and visible absorption measurements relative to a standard using extinction coefficients and indirect measurements using dye-based assays such as Lowry, BCA, and Bradford assays.
Due to the specific limitations of each approach (including chemical interferences in dye-based assays, aromatic residue dependency, and the limited dynamic range of the spectroscopic tool), no method is universal.13
One of the primary limitations of measurements comes from the spectroscopic tools themselves. Traditional spectrometers have limited linearity, mostly due to the instrument slit width (resolution), stray light, and detector linearity. As a result, sample absorbance is targeted over a very narrow dynamic range, typically between 0.1 and 1.5 au.14
This limited range means researchers must adjust either the sample concentration or the cell path length to obtain accurate protein quantitation. Either alternative can be problematic and time-consuming in its effect on the measurement.
Infrared absorption spectroscopy can be an efficient tool for direct, label-free protein quantitation, providing an advantage over UV/VIS methods as sample absorption bands in the infrared are not dependent on aromatic residues and are much narrower. As a result, this method is more selective and less susceptible to interference.
As the IR method is not dependent on a UV chromophore and it probes the carbonyl backbone of the protein, the variation extinction coefficient is significantly smaller, which can be an advantage when measuring unknown proteins.
IR spectroscopy is not routinely used in situ due to higher costs, lower sensitivity, and difficulty of operation (for example, water vapor interference, background subtraction, and narrow pathlength cells).
RedShiftBio’s MMS platform can overcome such drawbacks by improving sensitivity and substantially minimizing the errors common to traditional spectroscopy. Its high resolution (< 0.001 cm-1) and low susceptibility to stray light increase the concentration range for measurement by more than two orders of magnitude.
The differential measurement of MMS and its direct control over laser power also improves linearity, maintaining high detector linearity throughout the measurement range and reducing signal dynamic range. Using MMS, only a few wavelengths need to be measured.
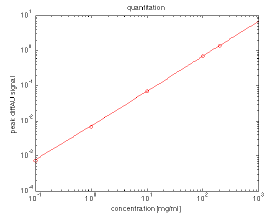
Figure 11. Differential absorbance at ~1656 cm-1 (BSA peak) plotted as a function of concentration at 0.1, 1, 10, and 200 mg/mL. Image Credit: RedShiftBio
Figure 11 shows a plot at approximately 1656 cm-1 for BSA in the range from 0.1 - 200 mg/mL. This offers a significant improvement over conventional absorbance-based assays, with a minimum measurable concentration of less than 10 µg/mL (3 sigma, HEWL) and an upper limit of over 200 mg/mL.
Conclusion
Aurora, powered by Microfluidic Modulation Spectroscopy, provides a fast and simple system for the characterization of proteins over a broad concentration range, using only 50 microliters of sample. It simultaneously delivers information on secondary structure, aggregation, stability, quantitation, and similarity. Microfluidic referencing enhances the reproducibility of the method, simplifying the workflow by eliminating the need for separate buffer measurements.
Aurora is an effective and versatile tool for the direct, label-free characterization of proteins through all phases of biologic drug development, from discovery through formulation and manufacturing.
References and further reading
- Kong J. (2007) Fourier Transform Infrared Spectroscopic Analysis of Protein Secondary Structures. Acta Biochimica et Biophysisx Sinica, 39(8), pp.549–559.
- Elliott, A. and Ambrose, E. (1950) Structure of synthetic polypeptides. Nature, 165, pp.921−922.
- Fabian, H. and Mantele, W. (2002) Handbook of Vibrational Spectroscopy. Chalmers, J. M., Griffiths, P. R. (Eds.), John Wiley & Sons, Ltd, Chichester. pp.3399–3425.
- Koenig, J. K. and Tabb, D. L. (1980) Analytical Applications of FTOIR to Molecular and Biological Systems Durig, J. R. (Ed.) pp.241–255,
- Aichun, D. Ping, H. and Winslow S (1990) Protein Secondary Structures in Water from Second-Derivative Amide I Infrared Spectra. Biochemistry, 29, pp.3303–3308.
- Pots, A. et al. (1998) Heat-induced conformational changes of patatin, the major potato tuber protein. Eur J Biochem, 252, pp.66–72.
- Shivu, B. et al. (2013) Distinct β-sheet structure in protein aggregates determined by ATR–FTIR spectroscopy. Biochemistry, 52(31).
- Wei Wang, Christopher J. Roberts Aggregation of Therapeutic Proteins Wiley, Aug 30, 2010.
- Kelly, S. and Price, N. (2017) The Use of Circular Dichroism in the Investigation of Protein Structure and Function Current Protein and Peptide Science, 1, 349–384.
- Hirota, N., Mizuno, K. and Goto, Y. (1997) Cooperative alpha helix formation of β lactoglobulin and melittin induce by hexafluoroisopropanol. Protein Science, 6, pp.416–421.
- Kendrick, B. et al. (1996) Quantitation of the area of overlap between second-derivative amide 1 infrared spectra to determine the structural similarity of a protein in different states. J Pharm Sci, 85(2): pp.155–158.
- D’Antonio, J. et al. (2012) Comparability of Protein Therapeutics: Quantitative Comparison of Second-Derivative Amide I Infrared Spectra. J Pharm Sci, 101(6) pp.2025–2033.
- Noble, J. and Bailey, MJ. (2009) Quantitation of protein, Methods Enzymol. 463, pp.73-95.
- Skoog, D., Holler, J. and Crouch, S. (2006) Principles of Instrumental Analysis, 6th Edition, Cengage Learning.
About RedShiftBio
RedShiftBio is redefining the possibilities for analyzing protein structure and concentration.
RedShiftBio has developed a proprietary life sciences platform combining our Microfluidic Modulation Spectroscopy (MMS) and expertise in high-powered quantum cascade lasers that provide ultra-sensitive and ultra-precise measurements of molecular structure. These structural changes affect critical quality attributes governing the safety, efficacy, and stability of biomolecules and their raw materials. This combination of technologies is available to researchers in our fully-automated Aurora and Apollo systems and is backed by a global network of sales, applications, service, and support teams to address all market needs.
Alongside our commitment to further innovation in the formulations and development space, RedShiftBio also supports biopharmaceutical manufacturing with HaLCon, our bioprocess analytics platform, purpose-built to measure protein titer at time of need.
Led by an experienced management team with a proven track record of success in both large instrumentation companies and commercializing disruptive technologies, RedShiftBio is here to support your research, development, and manufacturing goals. Our instruments can be found in the majority of the leading biopharmaceutical companies and CDMOs in the world. We also run product demonstrations and process samples in the StructIR Lab, located in our Boxborough, MA headquarters, as well as at partner sites including the Wood Centre in Oxford, UK, Spectralys/UCB in Brussels, Belgium, and at Sciex laboratories in Redwood Shores, CA.
RedShiftBio is backed by Waters Corporation, Illumina Ventures, Technology Venture Partners, and one undisclosed leading life science company.
Sponsored Content Policy: News-Medical.net publishes articles and related content that may be derived from sources where we have existing commercial relationships, provided such content adds value to the core editorial ethos of News-Medical.Net which is to educate and inform site visitors interested in medical research, science, medical devices and treatments.