Sponsored Content by RedShiftBioReviewed by Maria OsipovaFeb 15 2024
Protein misfolds in secondary structures can arise during all stages of drug development, and they represent structural impurity. At any level, protein misfolds can affect efficacy and increase the risk of immunogenicity.
To maintain confidence in the integrity of a protein, the spectroscopic methods for measuring low-level impurities in the secondary structure must be refined during drug development.
Fourier transform infrared (FTIR) and circular dichroism (CD) are common methods for characterizing protein structure, but both have weaknesses with regard to sensitivity and reproducibility. This increases the lowest level of quantitation (LOQ) available when measuring impurities and similarity.
Microfluidic Modulation Spectroscopy (MMS) technology developed by RedShiftBio is a novel protein characterization technique that yields reproducible, high-resolution measurements, with lower LOQ values (generated across a structural impurity range of 0–10 %) compared to those of FTIR and CD. MMS technology powers the Aurora protein analyzer, a fully automated instrument used to characterize biomolecules and provide detailed analytics without the need for spectroscopy expertise.
The Aurora protein analyzer
The latest MMS instrument Aurora, like its predecessors, Apollo and AQS3pro, quantitatively measures protein aggregation, structure, stability, and similarity with high sensitivity utilizing novel baseline correction algorithms and an automated workflow.
The system employs a microfluidic pathway and a mid-IR quantum cascade laser (QCL) to generate reproducible and effectively drift-free spectral data through the simultaneous and rapid modulation of sample and reference buffer. This results in differential spectra with superior signals to noise performance as well as an enhanced ability to detect minuscule changes in protein folding in the amide I region.
Methods
To measure and compare structural similarity using three characterization methods, a model protein system comprising different secondary structures in the amide I region was prepared. Stock 20 mg/mL IgG1 solution (predominantly β-strand) was spiked in differing ratios with stock 20 mg/mL BSA (predominantly α-helix) to produce a set of samples with differing levels of structural impurity across a spiked range of 0–10 %.
Three spectroscopic techniques (MMS, FTIR, and CD) were compared. For FTIR analysis, a Bruker Optics Vertex 70 spectrometer was utilized at ambient temperature for all samples. Spectral resolution in the MCT detector was set to 4 cm-1. To generate final spectra, 128 consecutive scans were collected and averaged for each sample from 4000 to 1000 cm-1. These were subsequently buffer subtracted and area normalized across a range of 1600–1705 cm-1. After applying 9-point smoothing and area normalization over a wavenumber range of 1620–1700 cm-1, FTIR second derivative spectra were calculated.
Using an Applied Photophysics Chirascan spectropolarimeter, CD measurements were obtained to analyze samples at ambient temperatures. Samples were diluted to 1 mg/mL and analyzed by autosampler utilizing a bandwidth of 1 nm at a collection interval of 1 second across the wavelength range of 260 to 178 nm. Eleven repeats were collected for each sample and averaged to create the final spectra, which were subsequently buffer subtracted and normalized to the mean residue molar ellipticity (MRME).
MMS measurements were acquired utilizing the automated AQS3pro delta analytics software at ambient temperature. Sample and buffer fluids were modulated into the 23.8 µm pathlength microfluidic flow cell at a frequency of 1 Hz and pressure of 5 psi. Differential spectra were collected at 31 discreet wavenumbers by scanning from 1714 to 1590 cm-1 across the amide I band. The AQS3pro analytics software was employed to calculate area of overlap (AO) and produce second derivative spectra, which were baseline-corrected by the proprietary correction algorithm.
Measuring sample similarity
AO and weighted spectral difference (WSD) were the two mathematical methods employed to measure the similarity of IgG1 and BSA for the model system.
Figure 1 shows the model system proteins and their native secondary structure ratios across the amide I band region, highlighting that IgG1 is predominantly composed of β-strand structures and BSA is mainly α-helical.
Figure 2 shows the similarity of the two proteins in the amide I region utilizing a second derivative spectra by AO resulting in a similarity value of 0.47 (compared to a value of 0.021 determined by WSD). These values support the use of the model protein system for this spiked study.
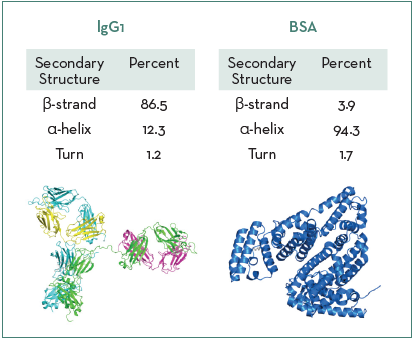
Figure 1. Secondary structure ratios for IgG1 and BSA. Image Credit: RedShiftBio
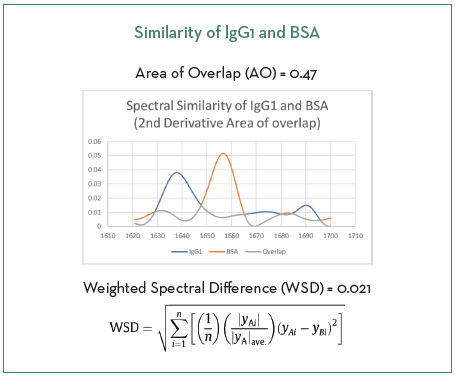
Figure 2. Two methods of determining similarity between IgG1 and BSA. Image Credit: RedShiftBio
Results
With regard to the spectral processing levels utilized for calculating AO, the secondary derivative spectra provided increased sensitivity and higher resolution for detecting structural differences.
The overlaid raw differential spectra for the proteins resulted in an increased calculated similarity value of 0.0056 for WSD and 0.84 for AO, values which were substandard compared to those obtained using the secondary derivative spectra that were compared in this experiment.
Area normalization
While second derivative spectra can be compared without using area normalization, both MMS and FTIR replicate spectra demonstrated an improvement in linearity across the spiked BSA following normalization. MMS spectra were superior in R2 before processing.
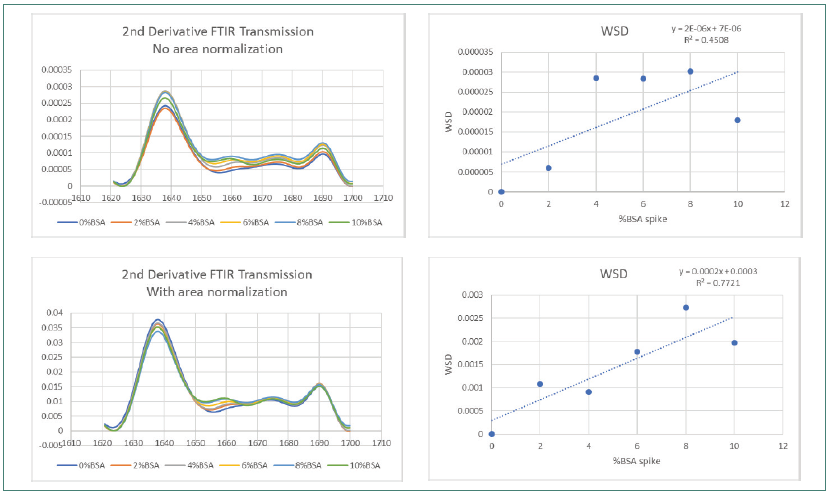
Figure 3. FTIR Weighted Spectral Difference (WSD) and amide I area normalization. Image Credit: RedShiftBio
Figure 3 shows how area normalization affected second derivative FTIR SDS spectra. Figure 4 displays the effects on spectra collected using MMS. Both sets of data covered the complete BSA impurity spike range.
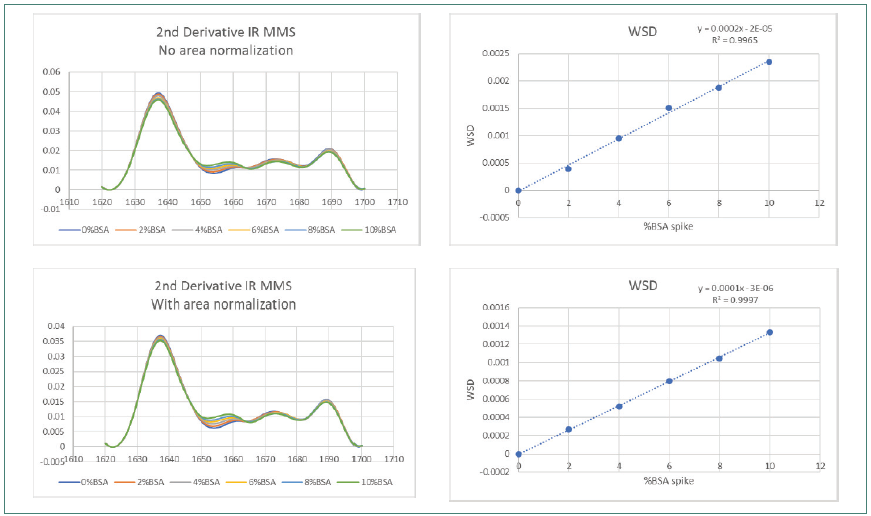
Figure 4. IR MMS Weighted Spectral Difference (WSD) and amide l area normalization. Image Credit: RedShiftBio
The FTIR data demonstrated a slight improvement in R2 (from 0.4508 to 0.772) before and after area normalization by WSD, with obvious lower reproducibility in the overlaid trace. The improvement in linearity is still significantly lower than that observed using MMS, which demonstrated a high R2 value of 0.9965 and greater reproducibility pre-area normalization, improving to 0.9997 after area normalization.
LOQ
The LOQ value determines the lowest possible percentage change in protein secondary structure that can be detected and quantified. The calculation technique employed in this study aligns with the ICH Q2 (r1) standards, allowing comparison of precision and accuracy for all three protein characterization methods.
Higher linearity across the entire spiked impurity range corresponded to higher confidence in detecting protein misfolds at the lowest levels of structural impurity, resulting in subsequently lower LOQ values for detecting impurities.
Stable absorbance creates reproducible data
With the MMS system, the direct ability to remove air bubbles and the larger flow cell improved the data quality by generating a stable response that was reproducible for all replicate samples across the entire BSA spike range.
The smaller flow cell path length used in FTIR (which typically produces slight variations in absorbance due to the incomplete purging of samples during injection and the adherence of microbubbles) showed lower reproducibility. These artifacts increase variability in differential spectra, therefore decreasing the sensitivity of the FTIR data, as seen in the lower matched overlaid traces even at the second derivative level.
MMS demonstrates higher reproducibility at the raw spectrum level
Before additional processing, the LOQ to identify protein misfolds by MMS surpassed the abilities of the FTIR, thanks to the stability of the absorbance signal in the MMS flow cell from the rapid modulation of the reference buffer and sample and in-line degassing.
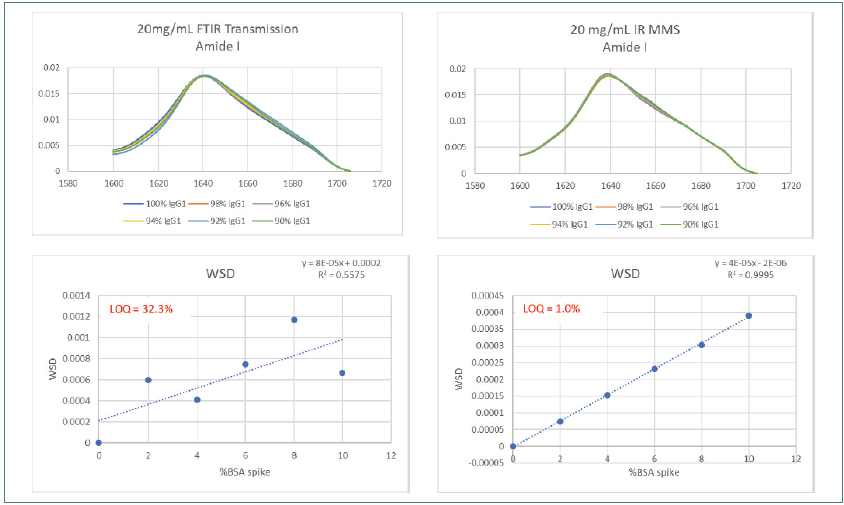
Figure 5. Amide l scan data using MMS shows 30-fold improved sensitivity of structural misfolds vs FTIR. Image Credit: RedShiftBio
Figure 5 compares the reproducibility and sensitivity of the DTIR and MMS system at the raw spectral level. MMS displays a 30-fold increase in sensitivity and an impurity LOQ of 1 % compared to >30 % for FTIR across the entire BSA spiked range.
The R2 linearity value for the MMS method was 0.9995 compared to 0.5575 for FTIR. Poor matching was observed in the overlaid traces from the FTIR method.
The processing of raw spectra for background subtraction had to be performed manually with FTIR after raw spectra collection; whereas; using AQS3pro, it can be conducted automatically.
Detection of protein misfolds for MMS versus FTIR and CD
Spectral reproducibility and calculation of LOQ for detecting protein misfolds over the entire BSA spike range were measured utilizing MMS, FTIR, and CD at a concentration of 20 mg/mL. The samples measured using CD were first diluted to 1.0 mg/mL.
Figure 6 displays the highest reproducibility of spectral data using the AQS3pro with the greatest matching of overlaid traces. The FTIR traces overlaid better than the CD traces, which demonstrated the lowest matching and reproducibility among all three methods.
The LOQ of 0.76 % calculated with MMS was greater than the LOQ measured using FTIR by over 20-fold and exceeded the LOQ determined by CD by over 3.5-fold.
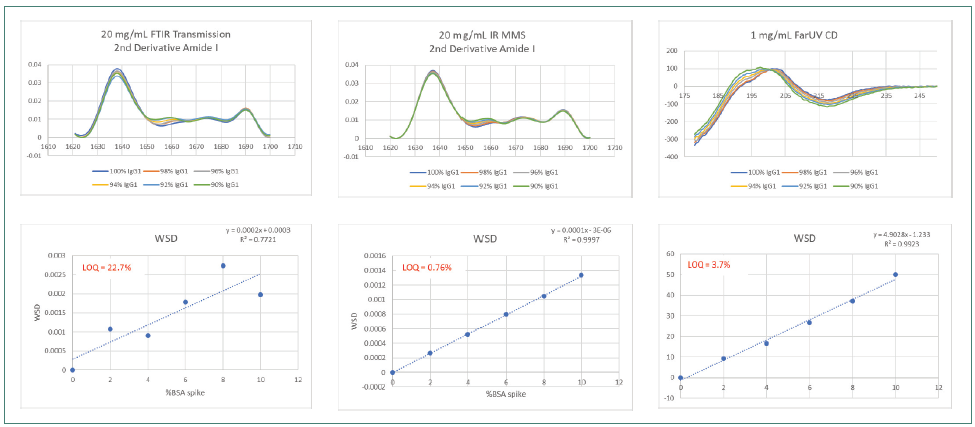
Figure 6. Comparison of 20 mg/mL IgG1 spiked with 0–10% BSA, second derivative spectra and WSD by MMS, FTIR and CD. Image Credit: RedShiftBio
Conclusions
MMS is superior to the traditional methods, generating reproducible replicate spectra at both the raw differential spectral level and the second derivative level, with and without area normalization. It further exceeds the capability of FTIR and CD when detecting and measuring misfolds with a lower LOQ.
MMS generates virtually drift-free subtracted spectra and a stable signal using a hands-off automated platform. It does not require sample dilution (as needed for CD) or manual background correction (as needed for FTIR).
Using the fully automated system of AQS3pro with MMS is ideal for direct, label-free characterization of proteins through all phases of drug development.
About RedShiftBio
RedShiftBio is redefining the possibilities for analyzing protein structure and concentration.
RedShiftBio has developed a proprietary life sciences platform combining our Microfluidic Modulation Spectroscopy (MMS) and expertise in high-powered quantum cascade lasers that provide ultra-sensitive and ultra-precise measurements of molecular structure. These structural changes affect critical quality attributes governing the safety, efficacy, and stability of biomolecules and their raw materials. This combination of technologies is available to researchers in our fully-automated Aurora and Apollo systems and is backed by a global network of sales, applications, service, and support teams to address all market needs.
Alongside our commitment to further innovation in the formulations and development space, RedShiftBio also supports biopharmaceutical manufacturing with HaLCon, our bioprocess analytics platform, purpose-built to measure protein titer at time of need.
Led by an experienced management team with a proven track record of success in both large instrumentation companies and commercializing disruptive technologies, RedShiftBio is here to support your research, development, and manufacturing goals. Our instruments can be found in the majority of the leading biopharmaceutical companies and CDMOs in the world. We also run product demonstrations and process samples in the StructIR Lab, located in our Boxborough, MA headquarters, as well as at partner sites including the Wood Centre in Oxford, UK, Spectralys/UCB in Brussels, Belgium, and at Sciex laboratories in Redwood Shores, CA.
RedShiftBio is backed by Waters Corporation, Illumina Ventures, Technology Venture Partners, and one undisclosed leading life science company.
Sponsored Content Policy: News-Medical.net publishes articles and related content that may be derived from sources where we have existing commercial relationships, provided such content adds value to the core editorial ethos of News-Medical.Net which is to educate and inform site visitors interested in medical research, science, medical devices and treatments.