Sponsored Content by RedShiftBioReviewed by Maria OsipovaFeb 15 2024
In physiological environments, biomolecules like nucleic acids and proteins fold into complex 3-dimensional (3D) structures. As it determines function and activity, ensuring biomolecules have the correct molecular structure is crucial in therapeutic drug production. Minute changes in structure, such as a re-orientation in the binding pocket, can result in a loss of binding recognition.
X-Ray crystallography, cryoelectron microscopy (Cryo-EM), and nuclear magnetic resonance (NMR) are the gold standard methods for acquiring the high-resolution structure of proteins. While they provide the highest resolution of the 3D structures, these methods suffer from labor-intensive workflows and complicated data analysis, limiting their use as day-to-day analytical tools.
All levels of protein structures can be considered when characterizing a protein structure. The protein’s secondary structure (for example, α-helix and β-sheet) contains a vast amount of information that is frequently overlooked by researchers. For instance, the secondary structure determines aggregate formation: the propensity of forming β-sheets in a primary sequence dictates the probability of irreversible protein aggregation.1
Accurate determination of the relative concentrations of various secondary structural motifs is therefore extremely valuable. Utilizing Microfluidic Modulation Spectroscopy (MMS), the Aurora protein analyzer, like its predecessors AQS3pro and Apollo, is powered by an automated infrared (IR) spectroscopy technology for protein secondary structure analysis.
Employing a quantum cascade laser and microfluidic flow cell, MMS supplies high-quality data and provides a substantial improvement in sensitivity, dynamic range, and accuracy for protein analysis when compared with traditional far-UV CD and FTIR methods, as demonstrated previously.2,3
In this study, MMS was employed to determine the higher-order structure (HOS) of eight common proteins that exhibit a range of secondary structural characteristics.
Individual features of each protein were shown by high-quality MMS data and HOS results were compared against those determined using more conventional FTIR, X-Ray crystallography, and AlphaFold techniques.4,5
The results indicated an exceptionally high reproducibility of measurements for all proteins studied. The spectral data of the proteins was utilized as model proteins for samples in their respective classes in the delta analytical software.
Methods
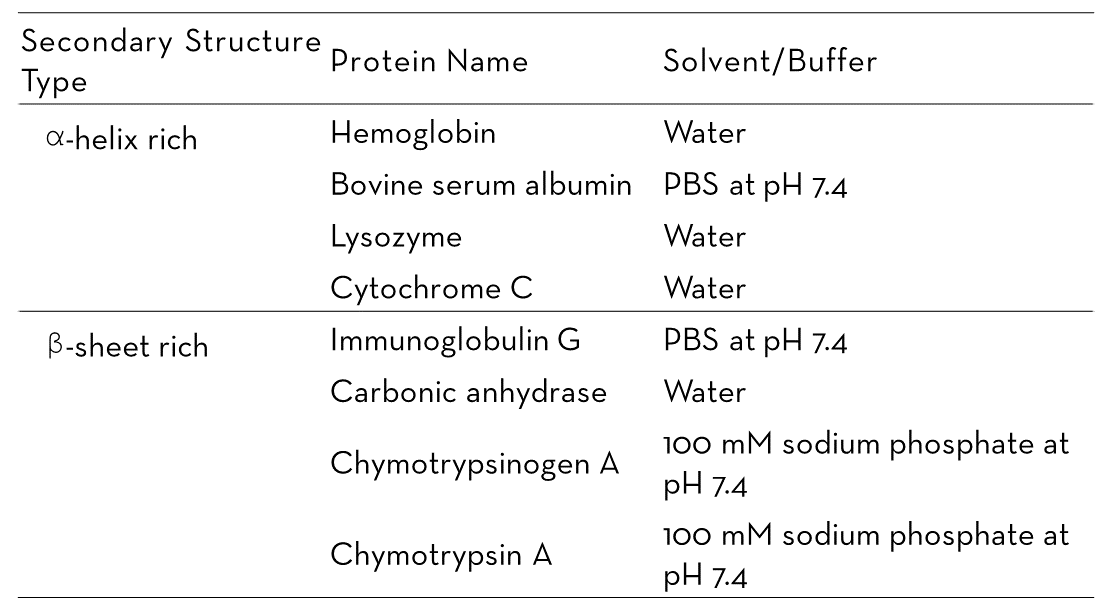
In this study, four α-helix-rich proteins (hemoglobin, BSA, lysozyme, and cytochrome C) and four β-sheet-rich proteins (IgG, carbonic anhydrase, chymotrypsinogen A, and chymotrypsin A) were evaluated. All proteins were supplied by MilliporeSigma in lyophilized powder form and dissolved in appropriate buffers or water (as shown in Table 1).
Proteins were initially prepared at 10 mg/mL concentration and were then diluted in a concentration series of 5, 2, 1, 0.5, and 0.1 mg/mL in their respective buffers. Triplicates of sample solution, as well as a referencing buffer, were injected into the RedShiftBio AQS3pro at a flow rate of approximately 1 µL/s and a backing pressure of 5 psi.
The sample solution and referencing buffer were modulated at 1 Hz for background subtraction, then the differential absorbance between the sample solution and the buffer was measured in the region of the amide I band (1588 – 1711 cm-1).
Spectral data and HOS information were processed and calculated utilizing the integrated RedShiftBio delta analytical software.
Table 1. A list of the proteins analyzed in this study with their buffer information. Source: RedShiftBio
Results
α-helix-rich proteins
For α-helix structures, the amide I band is the most intense absorption region in the IR spectrum, dominated by the stretching vibration of the C=O groups in the protein backbone in the region 1600 - 1700 cm-1.
The exact location of the C=O absorption peak is determined by the protein structure. Polypeptide chains fold into secondary structures due to hydrogen bonding between backbone atoms (oxygen on C=O and hydrogen in N-H). The peptide backbones therefore have different torsion angles and form different hydrogen bond lengths in varying secondary structures This causes the C=O group to absorb at different wavenumbers. For example, α-Helices absorb at 1656 cm-1.6
, BSA (PDB: 3V03), lysozyme (PDB: 1DPX), and cytochrome C (PDB: 1HRC).") Figure 1. Crystal structures of α-helix-rich proteins: hemoglobin (PDB: 2QSS), BSA (PDB: 3V03), lysozyme (PDB: 1DPX), and cytochrome C (PDB: 1HRC). Image Credit: RedShiftBio
Figure 1. Crystal structures of α-helix-rich proteins: hemoglobin (PDB: 2QSS), BSA (PDB: 3V03), lysozyme (PDB: 1DPX), and cytochrome C (PDB: 1HRC). Image Credit: RedShiftBio
Figure 1 shows the crystal structures of the four α-helix-rich proteins investigated using MMS. Hemoglobin, BSA, and cytochrome C consist of only α-helix and coil/turn structures. Lysozyme is predominantly α-helix, then coil/turn with 3 short strands of β-sheet structures.
These specific structural features, commonly obtained from high-resolution crystal structure data, were accurately determined using MMS. Figure 2 displays the second derivative of the MMS spectra obtained from the four α-helix-rich proteins with the main peak positions highlighted.
 Figure 2. Second derivative spectra of α-helix-rich proteins: hemoglobin, BSA, lysozyme, and cytochrome C. Inset in the hemoglobin spectra shows the quantitation linearity of the concentrations measured, from 0.1 to 10 mg/mL. Image Credit: RedShiftBio
Sharp peaks between 1655 and 1657 cm-1 were present in each spectrum, indicative of α-helix formation.6 The lysozyme spectrum also exhibited a small shoulder at 1640 cm-1, attributable to intramolecular β-sheets that absorb between 1632 and 1642 cm-1. Qualitatively, these MMS results supported the crystal structures of the proteins.6
A key advantage of MMS is the in-built delta analytical software, allowing for simple and rapid data processing following data acquisition.
HOS analysis is included in the data processing workflow and provides a direct readout of the relative concentrations of each secondary structural motif. The HOS including α-helix, β-sheet, coil (unord), and turn structures was calculated via Gaussian curve fitting utilizing inverted and baselined plots of the second derivative spectra.7
Figure 3 shows a comparison between these quantitative results and those obtained using FTIR, X-Ray crystallography, and AlphaFold.4,5,8,9 It should be noted that MMS and FTIR determine protein structures in solution, whereas X-Ray techniques determine these structures in a solid state.
In the cases of lysozyme and cytochrome C, both MMS and FTIR measured a higher percentage of β-sheets compared with X-Ray and AlphaFold, indicating a higher concentration of β-sheet structures in proteins in solution than in crystal form. Buffer type and pH can also affect a protein’s secondary structure, as investigated previously using MMS [AN-850-0124, AN-850- 0125].
As a whole, the HOS results supported one another and exhibited comparable patterns across all four platforms.
 Figure 3. Higher order structure bar graphs showing the relative abundance of the secondary structural motifs for each protein, compared across four different structural analysis platforms: MMS, FTIR, X-ray crystallography, and AlphaFold. MMS data shown used the values from the 10 mg/mL samples. Image Credit: RedShiftBio
β-sheet-rich proteins
Similarly to α-helix structures, β-sheets form by hydrogen bonding interactions between the protein backbone. However, they differ by the types of hydrogen bonding that give rise to the different oscillation frequencies of their backbone C=O bonds. As a result, α-helix and β-sheet structures can be differentiated using the shape and position of the associated absorption bands.
α-helix structures are usually very robust and have a narrow absorption band. β-sheet structures can present in two different types and generally exhibit wider absorption bands.
The intramolecular β-sheet absorbs at 1632-1642 cm-1 and is the native structure that exists in proteins. When proteins aggregate due to unfolding, native β-sheets can form intermolecular bonds resulting in tightly bound β-sheets, such as β-amyloids, that absorb at 1618-1624 cm-1 and 1695-1700 cm-1.6
, carbonic anhydrase (PDB: 1V9E), chymotrypsinogen A (PDB: 2CGA), and chymotrypsin A (PDB: 4CHA).") Figure 4. Crystal structures of β-sheet-rich proteins: IgG (PDB: 5DK3), carbonic anhydrase (PDB: 1V9E), chymotrypsinogen A (PDB: 2CGA), and chymotrypsin A (PDB: 4CHA). Image Credit: RedShiftBio
Figure 4. Crystal structures of β-sheet-rich proteins: IgG (PDB: 5DK3), carbonic anhydrase (PDB: 1V9E), chymotrypsinogen A (PDB: 2CGA), and chymotrypsin A (PDB: 4CHA). Image Credit: RedShiftBio
Figure 4 shows the crystal structures of the β-sheet-rich proteins investigated in this study. All structures primarily consist of β-sheet structures, with some α-helix and coil/turn structures. MMS was employed to detect and evaluate these secondary structures,
Figure 5 displays the second derivative spectra of these four proteins, with the main peaks highlighted in each plot. Sharp peaks in each spectrum were present between 1635 and 1639 cm-1, suggesting that intramolecular β-sheets were the main secondary structure in each protein.
 Figure 5. Second derivative spectra of β-sheet-rich proteins: IgG, carbonic anhydrase, chymotrypsinogen A, and chymotrypsin A. Image Credit: RedShiftBio
Both chymotrypsinogen A and chymotrypsin A displayed a smaller peak at 1650 cm-1, assigned to the coil structure present in these proteins.6 Significantly, there were noticeable spectral differences between these two proteins, despite their structural similarity (chymotrypsinogen is the inactive precursor of chymotrypsin). This will be a focus of future research.
 Figure 6. Higher order structure bar graphs showing the relative abundance of the secondary structural motifs for each protein, compared across four different structural analysis platforms: MMS, FTIR, X-ray crystallography, and AlphaFold. MMS data shown used the values from the 10 mg/mL samples. Note: there is no FTIR data available for chymotrypsinogen A. Image Credit: RedShiftBio
In Figure 6, the HOS of β-sheet-rich proteins is compared with FTIR, X-Ray crystallography, and AlphaFold, demonstrating good agreement across all platforms.
Small variations were evident when comparing individual secondary structural motifs. For example, β-sheet concentration in IgG (polyclonal) was estimated to be 64 % using MMS and FTIR, and 55 % when using X-Ray and AlphaFold. Similar trends in the abundance of the β-sheets have been reported in other proteins and are likely due to differences between solution-based (MMS and FTIR) and solid-state (X-Ray) analysis.
An earlier study reported that protein conformations consisting of more hydrophobic amino acids display greater similarity between crystal and solution-based forms compared with more hydrophilic amino acids.10
Data reproducibility
MMS employed a microfluidic cell that modulated the sample in solution and the referencing buffer every second to enable real-time buffer subtraction. All the data used for spectra and HOS calculations is thus highly reproducible, demonstrated in Figure 7 for all concentrations of the proteins studied.
Reproducibility was calculated utilizing area of overlap between each replicate spectrum and the averaged spectrum.2 In this study, all samples at 1 mg/mL concentration consistently demonstrated a minimum of 98 % reproducibility.
The limit of detection for MMS is 0.1 mg/m; thus, there is greater variability of reproducibility at this concentration. Typically, higher sample concentration results in a higher signal-to-noise ratio, and therefore higher reproducibility. 10 mg/mL samples were shown to reach a minimum of 99.8 % reproducibility.
This exceptionally high reproducibility demonstrates the robustness of MMS measurements of structural changes in biomolecules.
 Figure 7. Reproducibility of measurements at different concentrations for each protein. Image Credit: RedShiftBio
Conclusions
A range of common proteins exhibiting a variety of secondary structural characteristics were analyzed using MMS to determine the HOS which was then compared with other structural characterization and prediction tools (X-Ray, FTIR, AlphaFold, and crystallography).
The HOS established utilizing MMS supports the other techniques. Small differences were attributed to variations between the solution-based techniques (MMS and FTIR) and solid-state methods (X-Ray crystallography), as demonstrated previously.10 Buffer conditions, pH, and protein concentration are also known to play a key role in these differences.
The robustness of the spectral data was validated by the high reproducibility of the measurements (> 99.8 % for 10 mg/mL samples).
The study also expanded the library of model proteins within the delta analytical software, an addition that will increase the relevance and accuracy of the processed data by facilitating the use of appropriate model proteins to analyze samples with unknown structures.
References and further reading
- Uversky, V. N. et al. (2006) Protein Misfolding, Aggregation, and Conformational Diseases. In Protein Reviews; Springer, 4.
- Kendrick, B. S., et al. (2020) Determining Spectroscopic Quantitation Limits for Misfolded Structures. J Pharm Sci. 109(1), pp.933–936. doi. org/10.1016/j.xphs.2019.09.004.
- Liu, L. L., et al. (2020) Automated, High-Throughput Infrared Spectroscopy for Secondary Structure Analysis of Protein Biopharmaceuticals. J Pharm Sci, 109(10), pp.3223–3230. doi.org/10.1016/j.xphs.2020.07.030.
- Jumper, J., et al. (2021) Highly Accurate Protein Structure Prediction with AlphaFold. Nature, 596(7873), pp.583–589. doi.org/10.1038/s41586-021-03819-2.
- Varadi, M., et al. (2022) AlphaFold Protein Structure Database: Massively Expanding the Structural Coverage of Protein-Sequence Space with High-Accuracy Models. Nucleic Acids Res, 50(D1), pp.D439–D444. doi.org/10.1093/nar/ gkab1061.
- Dong, A.; Huang, P., et al. (1990) Protein Secondary Structures in Water from Second-Derivative Amide I Infrared Spectra. 29.
- Byler, D. M., et al. (1986) Examination of the Secondary Structure of Proteins by Deconvolved FTIR Spectra. Biopolymers, 25(3), pp.469–487.
- Yang, H., et al. (2015) Obtaining Information about Protein Secondary Structures in Aqueous Solution Using Fourier Transform IR Spectroscopy. Nat Protoc, 10(3), pp.382–396. doi.org/10.1038/nprot.2015.024.
- Kong, J., et al. (2007) Fourier Transform Infrared Spectroscopic Analysis of Protein Secondary Structures. Acta Biochim Biophys Sin (Shanghai), 39(8), pp.549–559. doi.org/10.1111/j.1745- 7270.2007.00320.x.
- Sikic, K., et al. Systematic Comparison of Crystal and NMR Protein Structures Deposited in the Protein Data Bank. Open Biochem J, 4, pp.83–95.
About RedShiftBio
RedShiftBio is redefining the possibilities for analyzing protein structure and concentration.
RedShiftBio has developed a proprietary life sciences platform combining our Microfluidic Modulation Spectroscopy (MMS) and expertise in high-powered quantum cascade lasers that provide ultra-sensitive and ultra-precise measurements of molecular structure. These structural changes affect critical quality attributes governing the safety, efficacy, and stability of biomolecules and their raw materials. This combination of technologies is available to researchers in our fully-automated Aurora and Apollo systems and is backed by a global network of sales, applications, service, and support teams to address all market needs.
Alongside our commitment to further innovation in the formulations and development space, RedShiftBio also supports biopharmaceutical manufacturing with HaLCon, our bioprocess analytics platform, purpose-built to measure protein titer at time of need.
Led by an experienced management team with a proven track record of success in both large instrumentation companies and commercializing disruptive technologies, RedShiftBio is here to support your research, development, and manufacturing goals. Our instruments can be found in the majority of the leading biopharmaceutical companies and CDMOs in the world. We also run product demonstrations and process samples in the StructIR Lab, located in our Boxborough, MA headquarters, as well as at partner sites including the Wood Centre in Oxford, UK, Spectralys/UCB in Brussels, Belgium, and at Sciex laboratories in Redwood Shores, CA.
RedShiftBio is backed by Waters Corporation, Illumina Ventures, Technology Venture Partners, and one undisclosed leading life science company.
Sponsored Content Policy: News-Medical.net publishes articles and related content that may be derived from sources where we have existing commercial relationships, provided such content adds value to the core editorial ethos of News-Medical.Net which is to educate and inform site visitors interested in medical research, science, medical devices and treatments.