Sponsored Content by RedShiftBioReviewed by Maria OsipovaFeb 15 2024
Biologic drugs are naturally complex and large. It is therefore almost impossible to perfectly replicate them as generic drugs. If companies can demonstrate that their product is highly like a biologic approved by the FDA, the new drug can be labeled a biosimilar.
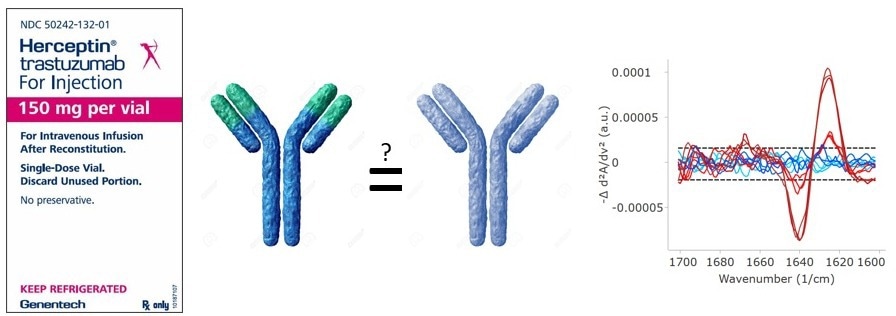
Image Credit: RedShiftBio
Trastuzumab (Herceptin®) is a biologic utilized to treat certain cancer types, specifically HER2-positive patients.1 Numerous manufacturers produce biosimilars of this drug for both research and clinical purposes. For a drug to be qualified as a biosimilar, it must pass rigorous characterization that demonstrates identical properties as the originator.2
This study analyzed the structure of the originator and two research-grade biosimilars utilizing microfluidic modulation spectroscopy (MMS), a novel, superior structural characterization tool. All three samples were also analyzed under normal fluctuation conditions, in PBS, and following 30 minutes of 70 °C increased temperature to assess the stability.
MMS probes the amide I band of the IR spectrum to sensitively investigate protein structure while modulating against the reference buffer for accurate and real-time background subtraction in aqueous-based samples. As it is so sensitive, MMS is particularly valuable for quality control and is compatible with many different formulation buffers.
In this study, the second-generation MMS system, Apollo, was employed. It is equipped with a high-power quantum cascade laser that is significantly more intense than traditional FTIR light sources. MMS is about 30 times more sensitive than FTIR and 5 times more sensitive than CD due to small changes in structure. This is due to the combination of more light and modulation of background subtraction.3
Methods
Trastuzumab (Herceptin®) was received in its original packaging as a dry powder containing the salts of its formulation components. The pre-portioned powder was re-suspended with 7.4 mL HPLC water to elevate the protein and buffer to the correct concentrations.
A stock of matching formulation buffer was produced from 18.4 mg/mL trehalose, 0.459 mg/mL L-histidine HCl monohydrate, 0.297 mg/mL L-histidine, and 0.081 mg/mL PS20. Both biosimilars were already dissolved in either formulation buffer or PBS.
The three samples were split into two aliquots each—one dialyzed in formulation buffer, the other dialyzed in PBS. This was to ensure that each sample had a perfectly matching reference buffer so that the impact of the buffer on the structure and stability could be evaluated.
Since the biosimilars were provided at 5 mg/mL and the trastuzumab is formulated at 21 mg/mL, the neat trastuzumab, as well as a 5 mg/mL diluted sample, were run to compare the effect of concentration.
Each sample was run three times on an AQS3pro system equipped with a flow cell with a pathlength of 22.3 µm and sweep-scanning capabilities. The modulation speed was 1 Hz and the backing pressure was 5 psi.
The trastuzumab samples in each buffer were placed in a 70 °C water bath for 30 minutes and analyzed in MMS after being cooled to room temperature. This was conducted to determine structural change and assess how the buffer impacts the effects of temperature stress. All results are shown as the averages of the three replicates.
Results
Comparing the originator to two biosimilars
Neat trastuzumab (21 mg/mL), diluted trastuzumab (5 mg/mL), and the two biosimilars (5 mg/mL) were tested in the formulation buffer.
Figure 1 shows the MMS results, including absolute spectra (A), the second derivative (SD) spectra (B), the similarity plot (C), and the HOS fractional contribution profile (D). Absolute spectra were normalized for concentration and buffer contribution. The second derivative plot shows regions of small change.
By inverting and baseline subtracting the second derivative plot, the similarity plot was created and was subsequently fit with Gaussian curves to quantify the fractional content of HOS.
Table1. A quantitative analysis of concentration, repeatability, and comparison to Trastuzumab innovator. Source: RedShiftBio
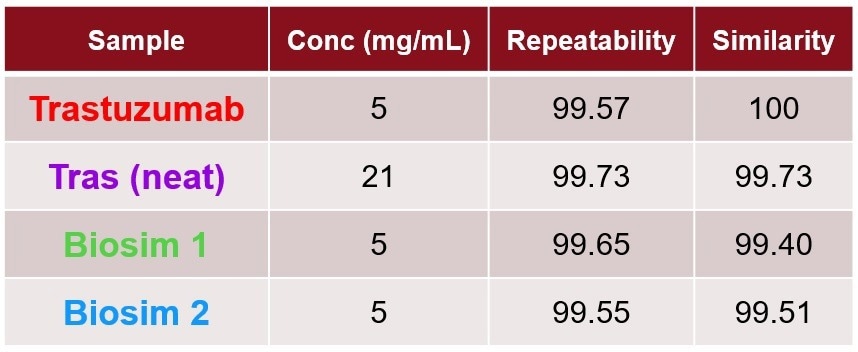
Table 1 shows the quantitative results, using the area of overlap (AO) of the similarity plot, to determine the repeatability of the replicates compared to the control sample (trastuzumab 5 mg/mL). All samples in formulation conditions are equivalent in secondary structure because the comparisons to the control all fall within the repeatability.
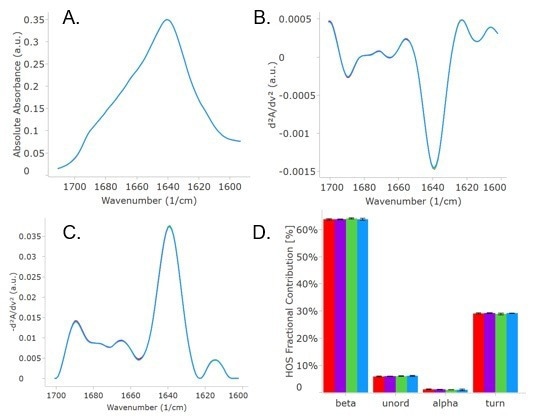
Figure 1. Absolute absorbance (A), second derivative (B), similarity (C), and HOS bar charts are shown above for the originator Trastuzumab at 5 and 21 mg/mL and two biosimilars each at 5 mg/mL. All spectra are well overlaid and appear as just one trace, but are actually four traces. The HOS bar chart highlights the similarities in structure. The colors correspond to: Trastuzumab 5 mg/mL is red, Trastuzumab 21 mg/mL is purple, biosimilar 1 is green, and biosimilar 2 is blue. Image Credit: RedShiftBio
Formulation buffer versus PBS
All samples were dialyzed in both formulation buffer and PBS for comparison of the effect of the buffer on antibody structure. Figure 2 shows the second derivative (A), HOS bar graph (B), and the delta plot (C) for each sample in formulation buffer at 5 mg/mL concentration and in PSB.
Table 2. Quantitative measurements of area of overlap showing repeatability among replicates and similarity compared to the Trastuzumab in formulation buffer are all highly similar. Source: RedShiftBio
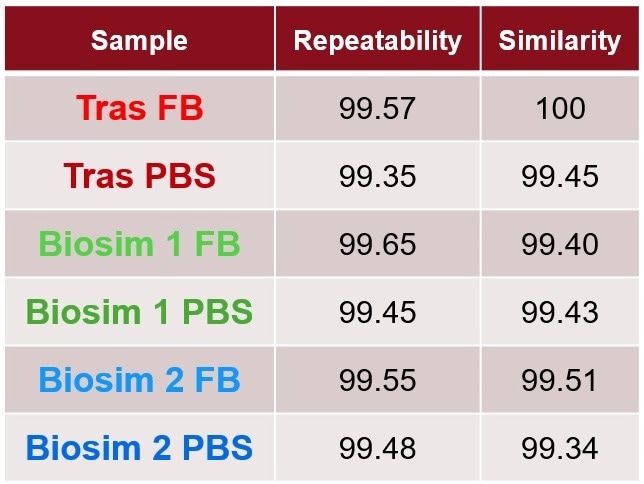
The delta plot is a visual method for the comparison of samples by subtracting the SD of each sample from a control. The dashed lines represent the replicate variation. Traces that appear above or below the dashed lines reveal spectral change. In this study, no samples displayed any changes related to the buffer. Table 2 quantitatively shows that all samples are comparable since none of the similarities deviate by over 1 % compared to the control.
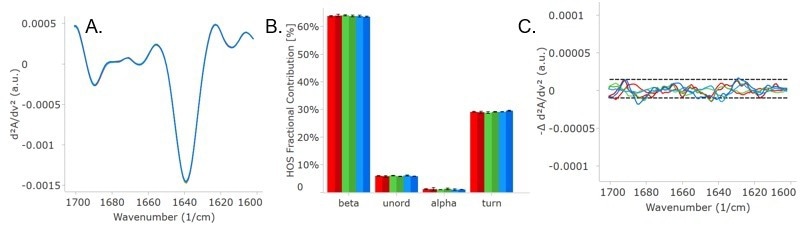
Figure 2. Second derivative plot (A), HOS bar chart (B), and delta plot (C) show each sample in PBS is highly similar to the samples in formulation buffer. The lighter shades are in FB and the darker shades are in PBS. The Trastuzumab samples are red, biosimilar 1 is green, and biosimilar 2 is blue. Image Credit: RedShiftBio
Heat stress qualitative results
Trastuzumab in PBS and formulation buffer were exposed to 70 °C for 30 minutes and then cooled to room temperature before running on MMS. Figure 3 depicts the second derivative (A) and delta plot (B).
Both heated samples displayed an increase in the spectra (around 1624 cm-1) and a decrease in the region (at 1640 cm-1, native β-sheet). The results display a small structural change for the sample in the formulation buffer and greater changes for the sample in PBS. This suggests that trastuzumab is more resistant to temperature stress in formulation buffer than in PBS.
 of Trastuzumab in FB at room temp (light blue) and after heat stress (bright red), and Trastuzumab in PBS at room temp (dark blue) and after heat stress (dark red). (B) shows the delta plot and highlights regions of change, and (C) and (D) are the delta plots separating out the samples in FB and in PBS, respectively. Image Credit: RedShiftBio")
Figure 3. Second derivative plot (A) of Trastuzumab in FB at room temp (light blue) and after heat stress (bright red), and Trastuzumab in PBS at room temp (dark blue) and after heat stress (dark red). (B) shows the delta plot and highlights regions of change, and (C) and (D) are the delta plots separating out the samples in FB and in PBS, respectively. Image Credit: RedShiftBio
Heat stress quantitative results
Figure 4A shows the HOS bar graph for each sample. Although heat stress did not result in major changes to structure, the figure indicates a decrease in β-sheet content and an increase in turn structure caused by heat stress. The weighted spectral difference (WSD) was calculated and is depicted in Figure 4C as a graph, where the error bars represent ± 2x the standard deviation among replicates.
Both WSD and the percent similarities highlight that the formulation buffer heated sample underwent subtle structural change and the heated PBS sample displayed a more significant change in structure. This could indicate that trastuzumab undergoes an initial denaturing pathway when the stress temperature approaches its melting temperature (Tm1 = 71 °C), where some β-sheets begin to unfold and convert to β turn structures.
Table 3. Area of overlap calculated for the repeatability for each sample and comparison to the RT control in FB. Source: RedShiftBio
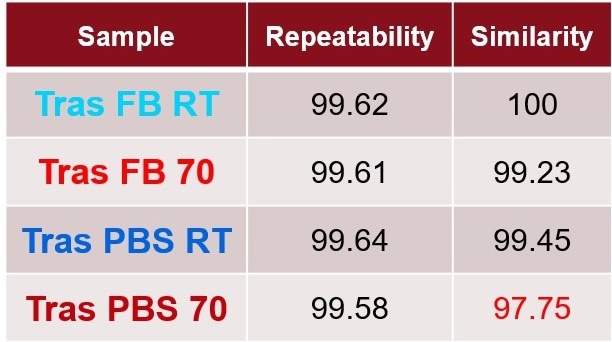
This β-sheet to turn transition propensity is more pronounced in the sample in PBS than in formulation, further emphasizing the importance of formulation buffer in preserving the stability of the antibody.
, heat-treated (bright red), and in PBS at room temp (dark blue), and heat-treated (dark red). Section (B) shows a more detailed view of the beta-sheet and turn structure changes and the trend that temperature stress has on Tras. The weighted spectral difference is shown in (C) and the change is clearly visible for both samples, however, the sample in PBS shows a much larger spectral change. Image Credit: RedShiftBio")
Figure 4. HOS bar charts for Trastuzumab in FB at room temp (light blue), heat-treated (bright red), and in PBS at room temp (dark blue), and heat-treated (dark red). Section (B) shows a more detailed view of the beta-sheet and turn structure changes and the trend that temperature stress has on Tras. The weighted spectral difference is shown in (C) and the change is clearly visible for both samples, however, the sample in PBS shows a much larger spectral change. Image Credit: RedShiftBio
Conclusions
Trastuzumab and both biosimilars had very similar secondary structures at both formulation concentrations and when diluted to 5 mg/mL, maintaining an AO of over 99 % when compared to the control. PBS did not affect antibody structure, as determined utilizing the delta plot and AO similarities compared to the samples in the formulation buffer.
Heat stress can impact the structure of trastuzumab, and the sample in PBS was more affected than that in formulation. Heat stress resulted in a loss in β-sheet content and a gain in turn structure, which could indicate the unraveling of the native structure.
MMS was shown to be a robust, automated tool that can be implemented rapidly and easily to analyze protein structure for biosimilar comparisons and determine change both quantitatively (using the percent similarity, HOS percentages, or WSD) and qualitatively (using the delta plots).
MMS can simplify the decision-making process when analyzing samples for comparability, and improved biophysical characterization tools such as MMS will enable better biosimilar drugs.
References and further reading
- Vulto, A. and Jaquez, O. (2017) The process defines the product: what really matters in biosimilar design and production? Rheumatology, 56(4), pp.14-29.
- Spector, N. and Blackwell, K. (2009) Understanding the mechanisms behind trastuzumab therapy for human epidermal growth factor receptor 2–positive breast cancer. Journal of Clinical Oncology, 27(34), pp.5838-5847.
- Brent, K. et al. (2020) Determining spectroscopic quantitation limits for misfolded structures." Journal of Pharmaceutical Sciences, 109(1), pp.933-936.
About RedShiftBio
RedShiftBio is redefining the possibilities for analyzing protein structure and concentration.
RedShiftBio has developed a proprietary life sciences platform combining our Microfluidic Modulation Spectroscopy (MMS) and expertise in high-powered quantum cascade lasers that provide ultra-sensitive and ultra-precise measurements of molecular structure. These structural changes affect critical quality attributes governing the safety, efficacy, and stability of biomolecules and their raw materials. This combination of technologies is available to researchers in our fully-automated Aurora and Apollo systems and is backed by a global network of sales, applications, service, and support teams to address all market needs.
Alongside our commitment to further innovation in the formulations and development space, RedShiftBio also supports biopharmaceutical manufacturing with HaLCon, our bioprocess analytics platform, purpose-built to measure protein titer at time of need.
Led by an experienced management team with a proven track record of success in both large instrumentation companies and commercializing disruptive technologies, RedShiftBio is here to support your research, development, and manufacturing goals. Our instruments can be found in the majority of the leading biopharmaceutical companies and CDMOs in the world. We also run product demonstrations and process samples in the StructIR Lab, located in our Boxborough, MA headquarters, as well as at partner sites including the Wood Centre in Oxford, UK, Spectralys/UCB in Brussels, Belgium, and at Sciex laboratories in Redwood Shores, CA.
RedShiftBio is backed by Waters Corporation, Illumina Ventures, Technology Venture Partners, and one undisclosed leading life science company.
Sponsored Content Policy: News-Medical.net publishes articles and related content that may be derived from sources where we have existing commercial relationships, provided such content adds value to the core editorial ethos of News-Medical.Net which is to educate and inform site visitors interested in medical research, science, medical devices and treatments.