Sponsored Content by HORIBAReviewed by Olivia FrostAug 18 2025
Monitoring culture media settings is critically important across various industries to enhance cell proliferation for applications such as regenerative medicines and protein synthesis. Numerous chemical components within the medium exhibit fluorescence properties, making Excitation Emission Matrix (EEM) measurement an effective technique for measuring multiple components concurrently. In this context, EEM measurement was utilized to track cell culture medium conditions throughout cell proliferation.
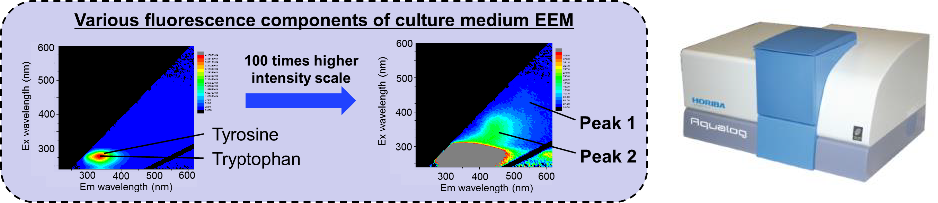
Image Credit: HORIBA
Background
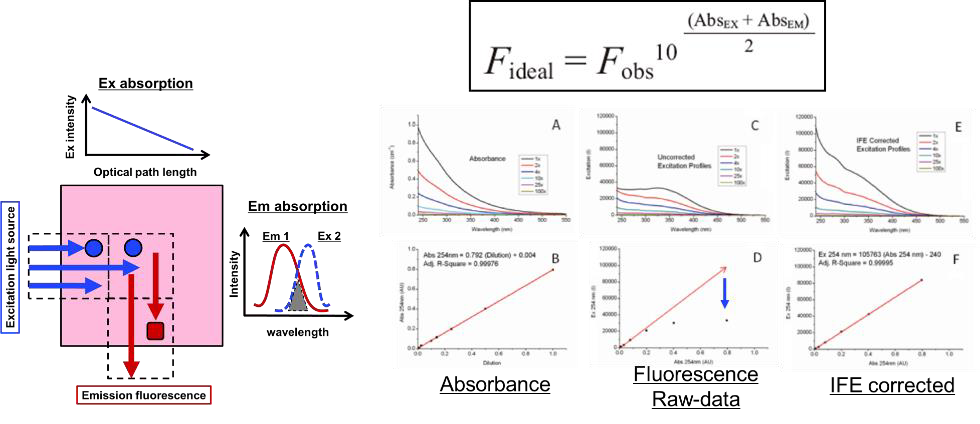
Figure 1. Samples often exhibit Inner Filter Effects (IFEs) which cause excitation and emission light absorption and increase fluorescence spectral distortion as a function of concentration. The Aqualog (HORIBA, Ltd.) measures excitation, emission, and absorption spectra simultaneously using a patented design to corrects data for IFEs.1 Image Credit: HORIBA
Experimental setup
Culture medium: Eagle’s minimal essential medium (E-MEM), Fetal Bovine Serum, penicillin, streptomycin and non-essential amino acids
Mammalian cell: Chinese hamster ovary (CHO-K1)
Two sample dishes were incubated over a four-day period, with daily partial sampling of remaining E-MEM (excluding the cell).
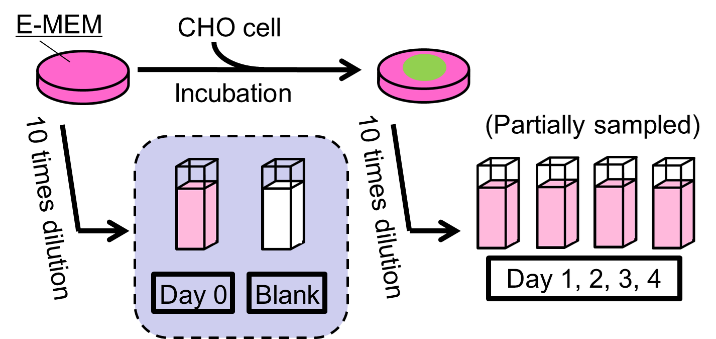
Image Credit: HORIBA
Measurement conditions
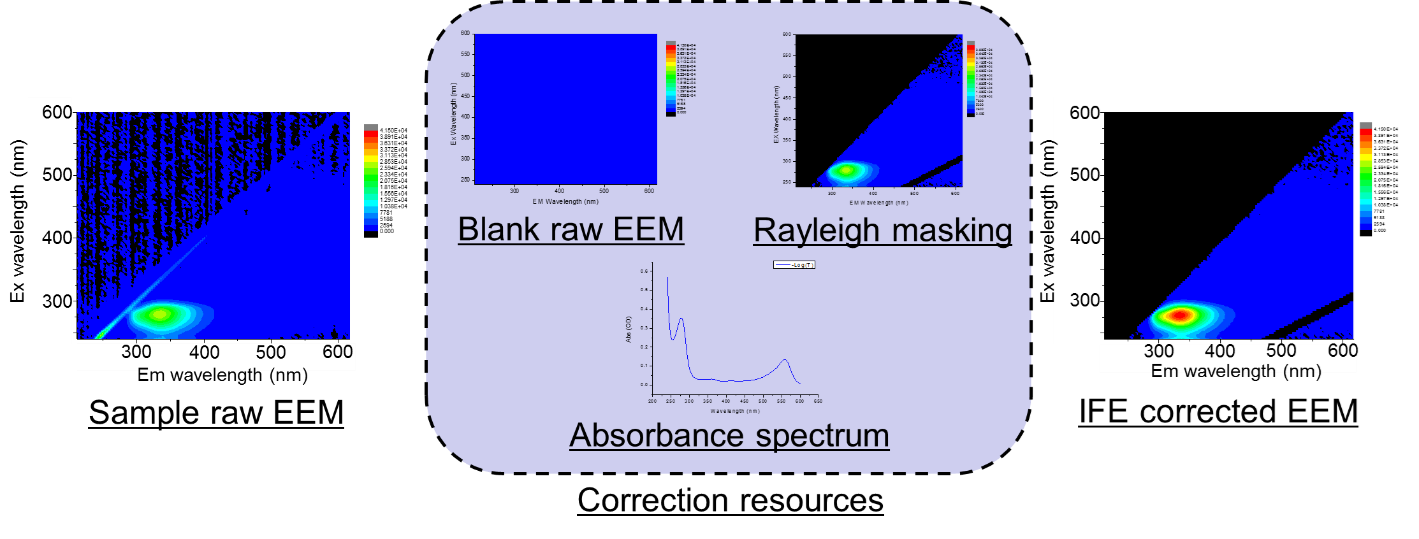
Image Credit: HORIBA
EEM acquisition was performed under the following conditions:
- Excitation range: 240 – 600 nm, 5 nm slit (bandpass)
- Emission range: 211 – 617 nm
The following calculations were applied to the measured EEM to obtain corrected EEM.
- Wavelength dependence correction of monochromator and detectors
- Blank subtract and Rayleigh masking
- IFE correction by absorbance spectrum
Results
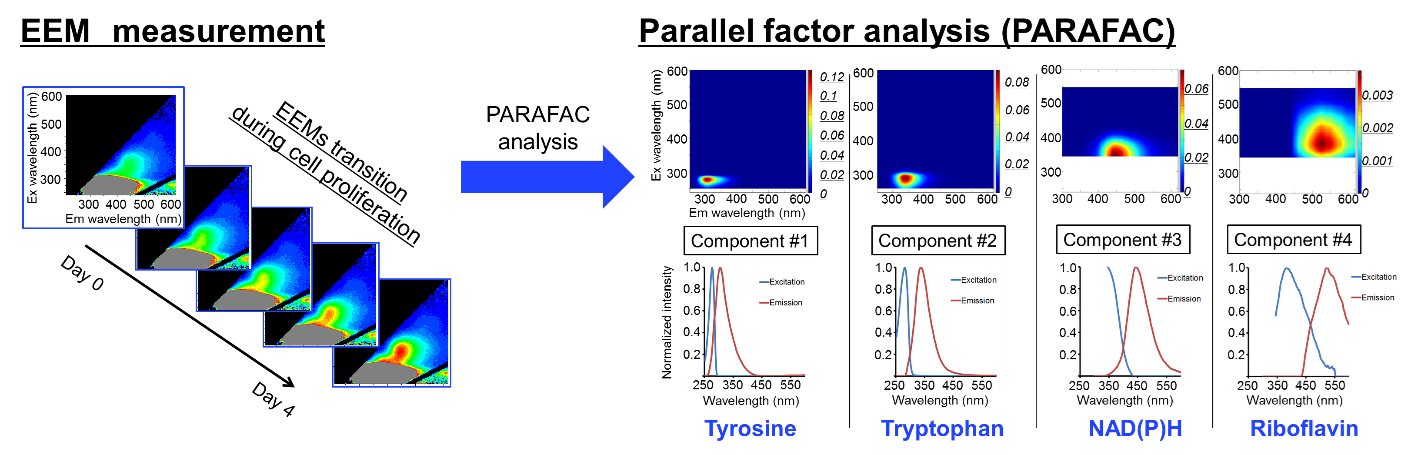
Figure 2. Fluorescence intensity (Ex: around 350 nm, and Em: around 450 nm) were increased continuously. All EEM data in the cell proliferation were analyzed using PARAFAC as a chemometric analysis. As a result, four spectral components were successfully extracted. Each component spectra looked similar to the known fluorescence materials indicated above.2 Image Credit: HORIBA
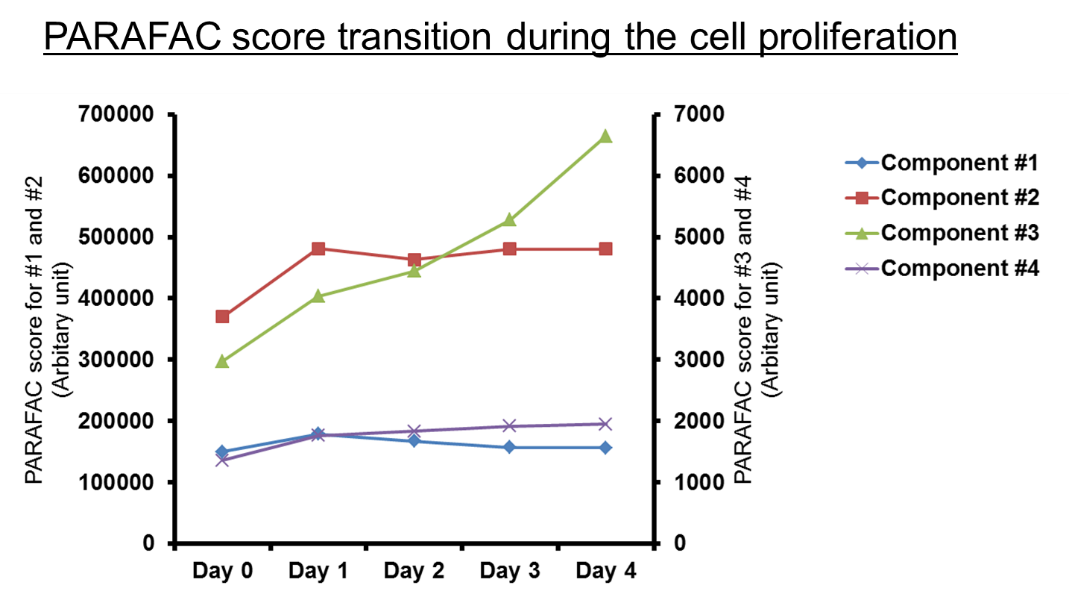
Figure 3. PARAFAC score of component #3, like NAD(P)H-like, increased continuously during the cell proliferation. The result shows that the component #3 is a key fluorescence indicator of the culture medium condition and cell proliferation. NAD(P)H is known to correspond to changes in cell environment.3 Image Credit: HORIBA
Conclusion
EEM measurement effectively characterized the culture medium conditions in cell proliferation. PARAFAC evaluation of the EEM data detected four fluorescence components concurrently from the overlapping contour graph.
Additionally, each fluorescence component was detected quantitatively by PARAFAC scores. One of the detected components corresponded to NADPH, which plays a crucial role in metabolism. Consequently, EEM measurement provides valuable insight into monitoring culture medium conditions in cell proliferation.
Acknowledgments
Produced from materials originally authored by Yuichi Kitagawa, Takumi Moriyama, Daisuke Irikura, and Yasushi Nakata at HORIBA TECHNO SERVICE Co., Ltd..
References and further reading:
- Gilmore, A. and Cohen, S. (2013). Analysis of the Chromophoric Dissolved Organic Matter in Water by EEMs with HOBIBA-Jobin Yvon Fluorescence Instrument called ‘Aqualog’. (online) Available at: https://static.horiba.com/fileadmin/Horiba/Company/About_HORIBA/Readout/R41E/R41E_06_019_01.pdf (Accessed 7 Aug. 2025).
- Faassen, S. and Hitzmann, B. (2015). Fluorescence Spectroscopy and Chemometric Modeling for Bioprocess Monitoring. Sensors, 15(5), pp.10271–10291. https://doi.org/10.3390/s150510271.
- Zabriskie, D.W. and Humphrey, A.E. (1978). Estimation of Fermentation Biomass Concentration by Measuring Culture Fluorescence. Applied and Environmental Microbiology, 35(2), pp.337–343. https://doi.org/10.1128/aem.35.2.337-343.1978.
About HORIBA
Founded in 1953, HORIBA has explored a wide range of unique measurement and analysis technologies to meet global customer needs from 47 group companies and local sites spread across 28 countries and regions. Under the corporate motto Joy and Fun, the company has expanded and refined its core tech-nologies to solve society’s energy issues of today and tomorrow. Our unique measurement and analysis technologies are valued in various fields of society including the three megatrend business fields of Ener-gy & Environment, Biology & Healthcare and Materials & Semiconductor. For more information on HORIBA, visit https://www.horiba.com/int/company/about-horiba/home/
Sponsored Content Policy: News-Medical.net publishes articles and related content that may be derived from sources where we have existing commercial relationships, provided such content adds value to the core editorial ethos of News-Medical.Net which is to educate and inform site visitors interested in medical research, science, medical devices and treatments.