NanoDrop Lite Plus spectrophotometer
Molecular cloning relies on two key components to construct recombinant DNA: 1) a DNA vector and 2) one or more DNA fragments containing the gene(s) of interest (GOI).
To produce a GOI fragment, DNA is digested with a restriction endonuclease, which cuts the DNA at targeted sites and generates base pairing complementarity with a similarly digested vector through their cohesive ends (Figure 1A). A ligase enzyme then adheres the vector and DNA fragment at their cohesive ends, forming the recombinant DNA product (Figure 1B).1,3
Quality control (QC) in molecular cloning is important both before and after the restriction digestion phase.
Checking the purity of plasmid DNA extracted from the cell line is essential prior to digestion. Common contaminants from DNA extraction, such as phenol, ethanol, and salts, can inhibit the restriction endonuclease and prevent proper cleavage.4 After digestion, the efficiency can be assessed using agarose gel electrophoresis to verify the presence of expected bands and minimal smearing.5
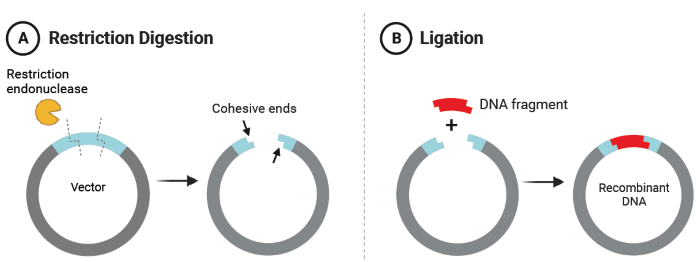
Figure 1. A) Restriction digestion of a vector with an endonuclease produces cohesive ends for complementary binding with a DNA fragment containing a gene of interest. B) Ligation of the digested DNA fragment and vector produces recombinant DNA. Figure created with BioRender.com. Image Credit: Thermo Fisher Scientific - UV-Vis Spectroscopy
Restriction endonucleases generate numerous fragments of different lengths when attempting to clone a single gene from genomic DNA.3 Gel electrophoresis is often used to analyze restriction-digested DNA after digestion, allowing the correct fragment band containing the GOI to be excised and purified from the gel for ligation and transformation.
Purity and concentration must be evaluated after gel purification to ensure highly efficient ligation and transformation. Due to its speed and simplicity, ultraviolet-visible (UV-Vis) spectrophotometry is favored for evaluating the purity and concentration of extracted plasmid DNA.
DNA absorbs light at 260 nm in the UV range, whereas salts absorb below 230 nm and proteins and phenolics absorb around 280 nm.
Using the Beer-Lambert Law, the measured absorbance can be related to the concentration, demonstrated in the following equation, where “c” = concentration, “A” = absorbance at a 1.0 cm pathlength, “ε” = sample-specific extinction coefficient, and “b” = pathlength (typically 1.0 cm):
A = εbc
Purity ratios A260/A230 and A260/A280 decrease in the presence of salts and proteins, respectively, making them essential tools for evaluating DNA purity. For double stranded DNA (dsDNA), the expected A260/A280 ratio is approximately 1.8, and the expected A260/A230 ratio ranges from 2.0 to 2.2.
The Thermo Scientific™ NanoDrop™ Lite Plus Microvolume UV Spectrophotometer provides purity ratios and DNA concentrations for as little as 1.0-2.0 μL of sample. This ability to evaluate extremely small volumes and preserve sample material for subsequent experiments is highly beneficial, as most extractions elute or resuspend DNA in volumes of less than 50 μL.
Experimental methods
Three plasmid pUC19 DNA samples (Thermo Scientific, SD0061) were prepared. Sample 1 was pure pUC19, and Samples 2 and 3 were pUC19 spiked with 150 ppm phenol and 20 mM EDTA, respectively, to simulate contamination commonly encountered during DNA extraction.
All three samples were evaluated for concentration and A260/A280 and A260/A230 purity ratios using 2.0 μL volumes on the NanoDrop Lite Plus spectrophotometer with the dsDNA sample type.
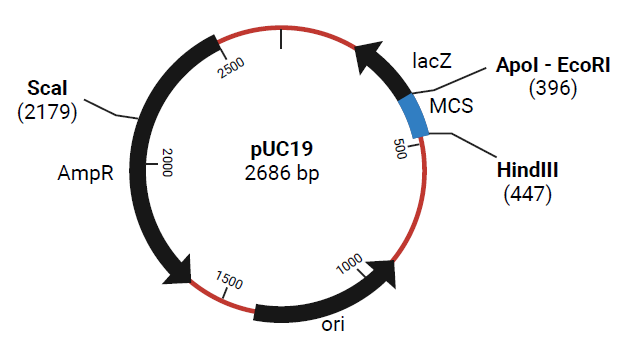
Figure 2. Plasmid map of pUC19 with several restriction endonuclease cleavage sites. Figure created with BioRender.com. Image Credit: Thermo Fisher Scientific - UV-Vis Spectroscopy
To evaluate the impact of contamination on restriction endonuclease cleavage, both pure and contaminated pUC19 were digested with HindIII (Thermo Scientific, ER0501) and incubated for 1.5 hours at 37 °C. Following incubation, HindIII was deactivated by heating at 80 °C for 20 minutes. HindIII has one cleavage site in the pUC19 sequence, generating a linear plasmid of 2686 base pairs upon digestion (Figure 2).
Gel electrophoresis of the digested pUC19 samples was conducted using a 1.2 % agarose gel to assess endonuclease digestion efficiency and to assess the formation of the expected 2686 bp fragment. DNA concentration load per well was equivalent to approximately 20 ng/μL. Bands corresponding to the digested plasmids were excised from the gel using a sterile scalpel, and excess gel was removed from each sample to obtain 50 mg for further extraction.
Plasmid DNA extraction from the three gel-excised samples followed the Invitrogen™ PureLink™ Quick Gel Extraction Kit guidelines (Invitrogen, K210012).
Two small modifications were applied to the instructions to enhance yield: 1) heating of the elution buffer to 65 °C prior to loading onto the column; and 2) a 10-minute incubation of the elution buffer on the column before elution. The eluted DNA was evaluated for concentration and purity using the NanoDrop Lite Plus spectrophotometer with the dsDNA sample type.
Table 1. Concentration and purity results of pure pUC19 and contaminated pUC19 were measured in replicates of five on the NanoDrop Lite Plus spectrophotometer. Source: Thermo Fisher Scientific - UV-Vis Spectroscopy
| |
Concentration
(ng/μL) |
Standard Deviation
(ng/μL) |
A260/
A280 |
A260/
A230 |
| Pure pUC19 |
241.8 |
0.6 |
1.90 |
2.03 |
pUC19 + Phenol
(150 ppm) |
358.3 |
0.5 |
1.77 |
1.76 |
pUC19 + EDTA
(20 mM) |
231 |
3 |
2.04 |
0.28 |
Results
Table 1 summarizes the concentration and purity outcomes for the pure and contaminated pUC19 samples, as assessed using the NanoDrop Lite Plus.
Pure pUC19 exhibited a mean concentration of 241.8 ng/μL and purity ratios within the anticipated range for dsDNA. Phenol contamination increased the reported concentration to 358.3 ng/μL, as phenol also contributes to absorbance at 260 nm.
The A260/A230 purity ratio of 1.76 fell below the anticipated range as phenol also contributes to elevated absorbance under 230 nm. EDTA contamination increased the A260/A280 ratio and significantly lowered the A260/A230 ratio. Strong absorbance by salts below 230 nm resulted in the A260/A230 purity ratio of 0.28, confirming contamination.
Purity ratios outside the expected range indicate that the concentration may be unreliable due to contamination effects on absorbance. At this stage, samples require additional purification through a column extraction or alcohol precipitation to guarantee precise concentration measurement.
Figure 3 depicts the gel electrophoresis outcomes of HindIII digestion efficiency in the presence of EDTA and phenol contamination. In column B, the undigested pUC19 remains in its supercoiled topology and migrates farther down the gel than its linear counterpart in column C.6
The linear pUC19 control band was located at the anticipated 2686 bp position relative to the ladder in column A. Column D indicates that phenol contamination had a minimal influence on digestion efficiency. However, elevated phenol concentrations or other organic solvents can further inhibit the activity of restriction enzymes.7,8
EDTA contamination prevented HindIII digestion, as demonstrated by the alignment of the band in column E with the undigested control in B. These digestion results reinforce the value of including a purity checkpoint before carrying out a restriction endonuclease digestion.
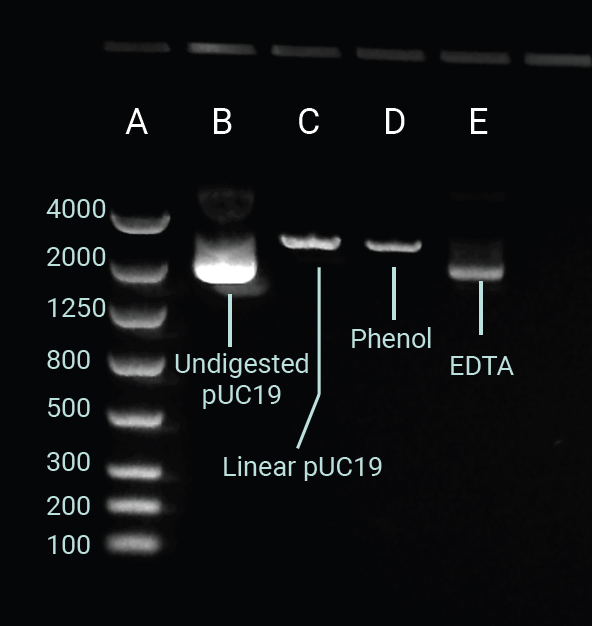
Figure 3. Gel electrophoresis image capture of supercoiled, undigested pUC19 (Lane B); linear pUC19 digested with HindIII (Lane C); pUC19 spiked with phenol (150 ppm) and HindIII digested (Lane D); pUC19 spiked with EDTA (20 mM) and HindIII digested (Lane E). Ran on a 1.2 % agarose gel. Ladder in Lane A displayed as base pairs. Image Credit: Thermo Fisher Scientific - UV-Vis Spectroscopy
Following gel extraction of the HindIII-digested samples, sample concentration, percent recovery, and purity ratios were again measured on the NanoDrop Lite Plus spectrophotometer (Table 2). The pure pUC19 sample was washed once using a wash buffer, whereas the phenol and EDTA-contaminated samples required two washes, resulting in a lower percentage of recovered DNA.
The mean concentration of recovered DNA from all samples was 15.04 ng/μL with a recovery of up to 89 %. The A260/A280 and A260/A230 purity ratios for all samples were within acceptable limits except for the EDTA-contaminated pUC19.
The reduced A260/ A230 purity ratio indicates the presence of residual EDTA or guanidine salts from the extraction reagents. Incorporating isopropanol before loading onto the extraction column supports DNA precipitation away from salts, resulting in a more purified DNA sample.9
Conclusions
The molecular cloning workflow requires QC checkpoints both before and after restriction endonuclease digestion to minimize downstream failure. Contaminants, including phenol and salts, can inhibit or diminish endonuclease efficiency, highlighting the importance of conducting a purity check before digestion.
Following digestion and gel extraction, purity requires an additional check to support successful ligation and transformation. With the NanoDrop Lite Plus spectrophotometer, the A260/A280 and A260/A230 purity ratios offer a rapid and straightforward approach for completing QC steps without requiring dilutions that demand large volumes of extracted DNA.
Table 2. Concentration and purity results of gel extracted pUC19 measured in replicates of five on the NanoDrop Lite Plus spectrophotometer. Source: Thermo Fisher Scientific - UV-Vis Spectroscopy
| |
Concentration
(ng/μL) |
Standard
Deviation (ng/μL) |
% Recovery
from Gel |
A260/
A280 |
A260/
A230 |
| Pure pUC19 |
17.83 |
0.09 |
89 % |
1.92 |
2.10 |
pUC19 + Phenol
(150 ppm) |
13.5 |
0.3 |
67.5 % |
1.84 |
2.04 |
pUC19 + EDTA
(20 mM) |
13.8 |
0.2 |
69 % |
1.95 |
1.69 |
References and further reading:
- Scientific Research Publishing Inc. (2017). Cooper, G.M. (2000) The Cell A Molecular Approach. 2nd Edition, Sunderland (MA) Sinauer Associates, The Development and Causes of Cancer. - References - Scientific Research Publishing. (online) Available at: https://www.scirp.org/reference/ReferencesPapers?ReferenceID=2001952.
- Mather, M.W., Andrew Keightley, J. and Fee, J.A. (1993). (50) Recovery and cloning of genomic DNA fragments from dried agarose gels. Methods in Enzymology, pp.695–704. https://doi.org/10.1016/0076-6879(93)18052-e.
- Alberts, B., et al. (2002). Isolating, Cloning, and Sequencing DNA. (online) National Library of Medicine. Available at: https://www.ncbi.nlm.nih.gov/books/NBK26837/.
- New England Biolabs. (2025). Optimizing Restriction Endonuclease Reactions | NEB. (online)] Available at: https://www.neb.com/en/tools-and-resources/usage-guidelines/optimizing-restriction-endonuclease-reactions?srsltid=AfmBOopKt3LUevo_duOUYE3BWAb9h-EQpOvoN_st8Vok3QquMcfzs1wQ.
- Thermo Fisher Scientific. (2025). Gel Electrophoresis Applications | Thermo Fisher Scientific - US. (online) Available at: https://www.thermofisher.com/in/en/home/life-science/cloning/cloning-learning-center/invitrogen-school-of-molecular-biology/na-electrophoresis-education/na-electrophoresis-applications.html.
- Bates, A.D. and Maxwell, A. (2009). DNA topology. Oxford Etc.: Oxford University Press, Cop. Available at: https://global.oup.com/academic/product/dna-topology-9780198506553?cc=in&lang=en&.
- Thermo Fisher Scientific. Using NanoDrop One/One C to determine phenol and protein contaminants in nucleic acids for RT-qPCR quality control. Available at: https://documents.thermofisher.com/TFS-Assets/MSD/Application-Notes/nanodrop-one-phenol-protein-contaminants-rtqpcr-en-tn53472.pdf.
- Tan, S.C. and Yiap, B.C. (2009). DNA, RNA, and Protein Extraction: The Past and The Present. Journal of Biomedicine and Biotechnology, 2009(574398), pp.1–10. https://doi.org/10.1155/2009/574398.
- Green, M.R. and Sambrook, J. (2017). Precipitation of DNA with Isopropanol. Cold Spring Harbor Protocols, 2017(8), p.pdb.prot093385. https://doi.org/10.1101/pdb.prot093385.
About Thermo Fisher Scientific - UV-Vis Spectroscopy
UV-Vis Spectrometers overview
Scientists can count on our broad range of ultraviolet (UV) and visible (Vis) spectrophotometers to deliver reliable, accurate data. The Thermo Scientific SPECTRONIC 200, GENESYS, and Evolution product lines are designed to streamline measurements, providing consistent, high-quality results, time after time. Additionally, the innovative Thermo Scientific NanoDrop microvolume family of instruments has been helping scientists accelerate the pace of discovery for over 20 years. From classroom teaching to routine measurements to discovery of the next scientific breakthrough, our line of spectrophotometers is designed to fit into any modern laboratory.
Sponsored Content Policy: News-Medical.net publishes articles and related content that may be derived from sources where we have existing commercial relationships, provided such content adds value to the core editorial ethos of News-Medical.Net, which is to educate and inform site visitors interested in medical research, science, medical devices, and treatments.