This article and associated images are based on a poster originally authored by Kanghyun Kim, Rubal Singla, Amey Chaware, Jieun Park, Ina Klockner, Josh Lerner, Kevin Li, Fanghong Shen, Clay Dugo, Paul Reamey, Aurélien Bègue, Mark Harfouche, Abhishek Mishra, Christopher A. McPherson, Jason L. Stein, Roarke Horstmeyer, and Kay Bhagabani and presented at ELRIG Drug Discovery 2026 in affiliation with Duke University, University of North Carolina, Ramona Optics Inc. and NIEHS.
This poster is being hosted on this website in its raw form, without modifications. It has not undergone peer review but has been reviewed to meet AZoNetwork's editorial quality standards. The information contained is for informational purposes only and should not be considered validated by independent peer assessment.

Imaging the same organoids every day shows when a drug effect appears, peaks, and fades, not only where it ends up.
- 10 s per 96-well plate, 1 field × 20 planes, brightfield
- 48 wells imaged at once, one lens per well
- 15 daily reads of the same organoids, Day 17 to 31
01. The endpoint problem
Organoid assays often end in one destructive readout, such as fixation and staining or a lytic viability assay. Each well gives one number and no history. Tracking the same organoids daily needs whole-plate imaging through their full depth, fast enough to repeat every day. Single-objective imagers acquire each field and focal plane in turn, so a 96-well plate typically takes 7 to 53 minutes.
02. A 96-well plate in 10 seconds
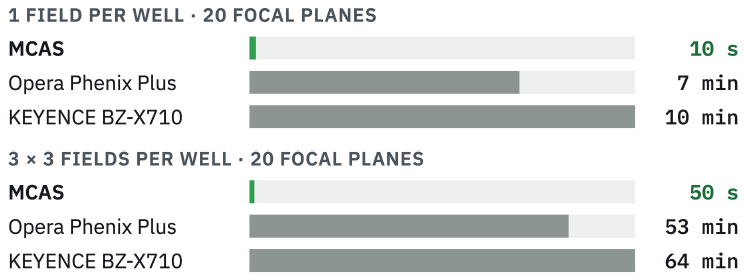
Brightfield acquisition time for an empty 96-well plate, measured by the authors with identical settings on each system (60 ms exposure, 10 μm z-steps). Bars are scaled within each group. 53 min to 0.83 min is the paper's 98% reduction. MCAS fluorescence uses step-and-settle and is slower (110 s for 80 planes). Image Credit: Kanghyun Kim et al., in partnership with ELRIG (UK) Ltd.
03. One lens per well
- 48 lens-and-sensor pairs on a 9 mm pitch, one under each well. Two stage positions cover a 96-well plate. 24- and 384-well plates also fit.
- In brightfield, the stage sweeps focus at constant speed while all 48 cameras record, with no stop-and-settle at each plane.
- 0.3 NA lenses with 1.2 μm resolution, comparable to a 10× objective. GFP fluorescence with an added filter set.
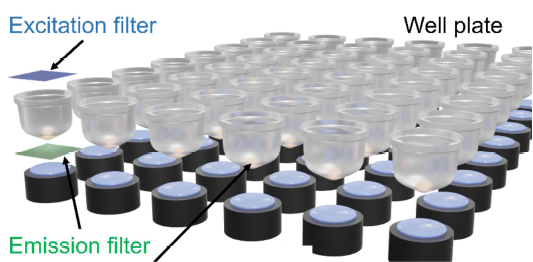
The study instrument is a research multi-camera array scanner (MCAS). Image Credit: Kanghyun Kim et al., in partnership with ELRIG (UK) Ltd.
04. From plate to per-organoid numbers
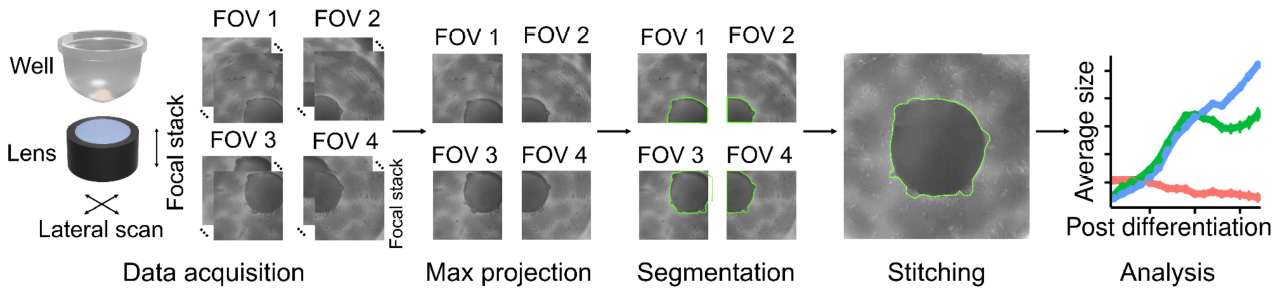
Each well is imaged as a z-stack, max-projected, segmented with Segment Anything for Microscopy and stitched when an organoid spans fields. Outputs per organoid per day are area, eccentricity and GFP intensity. Image Credit: Kanghyun Kim et al., in partnership with ELRIG (UK) Ltd.
05. Daily imaging separates three drug-response time courses
Cortical organoids from one iPSC line (PGP1) and one differentiation, 16 per condition, imaged every day from Day 17 to 31. CHIR99021 and valproic acid were washed out on Day 20. Mitomycin C was applied for 1 or 24 h.
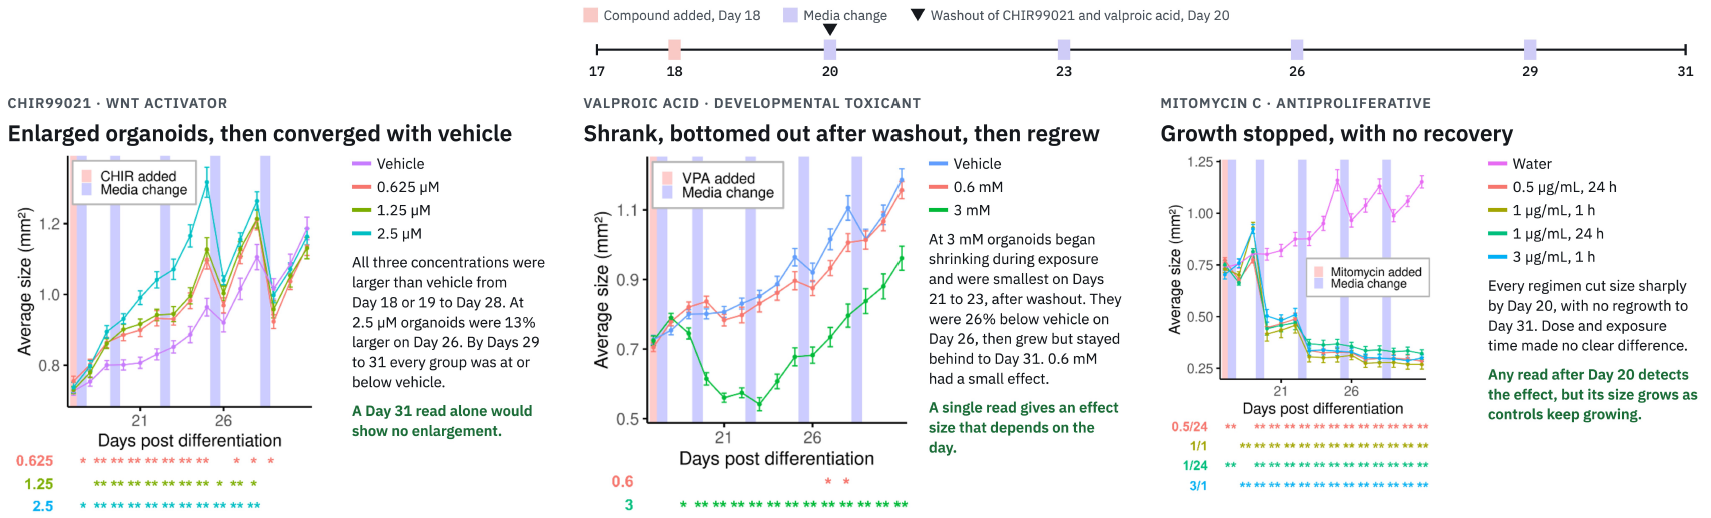
Dips after media changes, clearest on Days 26 and 29 in all groups including controls, likely reflect peripheral debris, counted in the outline, being removed during the change rather than true shrinkage. Images were taken after media changes. Mean ± s.e.m., n = 16 organoids per condition; two-tailed Welch's t-test against the matched vehicle or water control at each day, * p < 0.05, ** p < 0.01. 2 × 2 fields × 170 planes per well, 132 s per plate. Image Credit: Kanghyun Kim et al., in partnership with ELRIG (UK) Ltd.
06. Shape changed before growth stalled
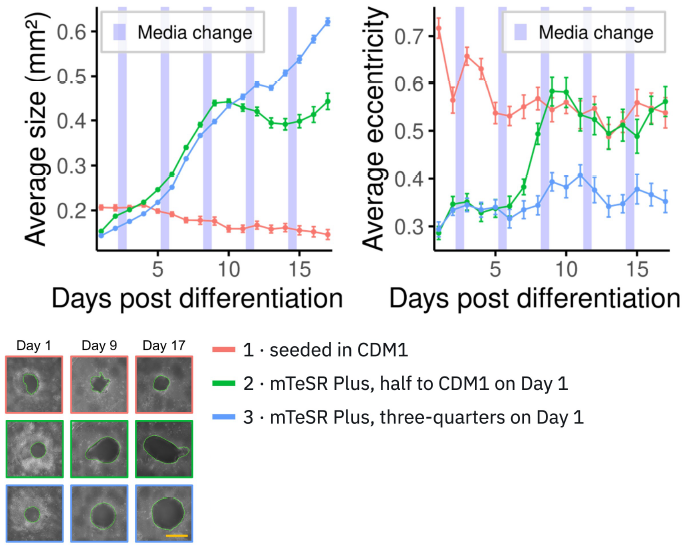
Image Credit: Kanghyun Kim et al., in partnership with ELRIG (UK) Ltd.
In a line that differentiated poorly, Condition 3 grew steadily. In Condition 2, eccentricity rose from Day 7 and growth stalled from Day 9. One line, n = 30 to 31. Shape is informative only up to about Day 14.
07. Imaged GFP intensity ranks with FACS
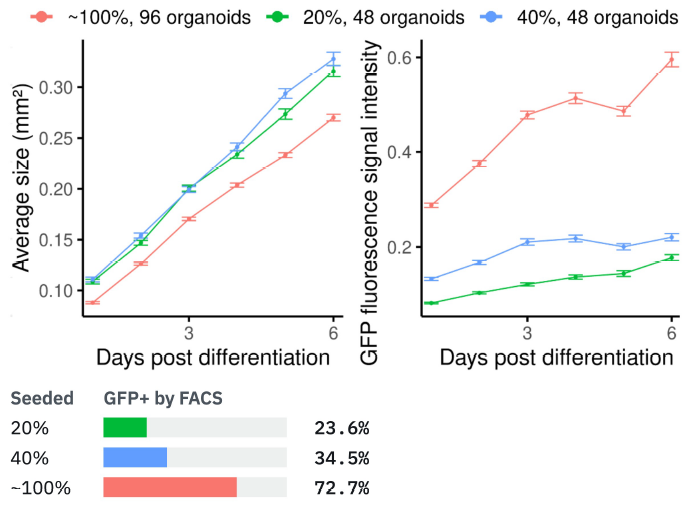
Image Credit: Kanghyun Kim et al., in partnership with ELRIG (UK) Ltd.
Seeded from mixes of GFP-reporter and unlabelled iPSCs. Summed GFP intensity ranked with the FACS GFP+ fraction, and every pair differed on Day 6 (p < 10−4). The ∼100% group was smaller (Day 6, p < 10−8).
08. Later-stage organoids, 24-well plates
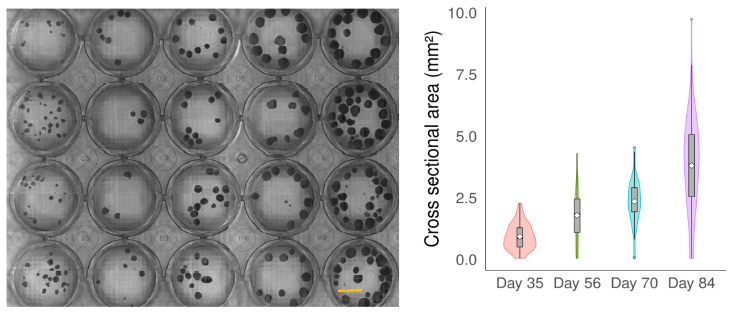
Image Credit: Kanghyun Kim et al., in partnership with ELRIG (UK) Ltd.
Separate organoids from several lines at Days 35, 56, 70 and 84, moved from spinner flasks for imaging and returned, so a cross-sectional series. 7 × 7 fields × 40 planes in 468 s. The sharpest outline sat at −250, 0 and +250 μm for Day 35, 70 and 84 organoids, so a single plane could undersize them.

Image Credit: Kanghyun Kim et al., in partnership with ELRIG (UK) Ltd.
Conclusions
- Parallel lens-per-well imaging scanned a 96-well plate in 10 s versus 7 to 10 min on two commercial imagers, making daily imaging of the same organoids practical.
- Daily label-free size tracking separated a transient gain (CHIR99021), a drop then regrowth (valproic acid) and a sustained arrest (Mitomycin C). Single time points would describe these differently.
- The same platform flagged an early shape change in a poorly growing seeding condition and gave GFP readouts that ranked with FACS.
Why it matters for drug discovery
- One plate yields a full time course, where destructive endpoint assays need a plate per time point.
- Endpoint days can be chosen from data instead of assumed.
- Transient and lasting effects can be told apart.
- Handling artifacts, such as dips after media changes, become visible.
Limitations and next steps
Cross-sectional area is a 2D proxy, not volume or viability. Each experiment used one differentiation, with organoids as replicates, and the drug and reporter work used one iPSC line. Fluorescence in this research system is GFP-only and slower than brightfield. Next steps include more organoid models, faster fluorescence, on-stage incubation, and analysis during acquisition.
References
Kim, K., et al. (2026). Parallelized bright-field and fluorescence imaging platform for organoids. Cell Reports Methods, p.101601. DOI:10.1016/j.crmeth.2026.101601. https://www.cell.com/cell-reports-methods/fulltext/S2667-2375(26)00302-4.
About Duke University
Duke University is one of the world's leading institutions for education, research, and patient care. Duke is the place where the world’s brightest minds come to meet the most important challenges. We recognize that their accomplishments comprise the true measure of our institutional excellence.
At Duke, our values are more than words. They shape how we learn, work, and lead. Built on respect, trust, inclusion, discovery, and excellence, these values guide our community and influence how we honor our past while preparing for the future.
About ELRIG (UK) Ltd.
The European Laboratory Research & Innovation Group (ELRIG) is a leading European not-for-profit organization that exists to provide outstanding scientific content to the life science community. The foundation of the organization is based on the use and application of automation, robotics and instrumentation in life science laboratories, but over time, we have evolved to respond to the needs of biopharma by developing scientific programs that focus on cutting-edge research areas that have the potential to revolutionize drug discovery.
Comprised of a global community of over 12,000 life science professionals, participating in our events, whether it be at one of our scientific conferences or one of our networking meetings, will enable any of our community to exchange information, within disciplines and across academic and biopharmaceutical organizations, on an open access basis, as all our events are free-of-charge to attend!
Our values
Our values are to always ensure the highest quality of content and that content will be made readily accessible to all, and that we will always be an inclusive organization, serving a diverse scientific network. In addition, ELRIG will always be a volunteer led organization, run by and for the life sciences community, on a not-for-profit basis.
Our purpose
ELRIG is a company whose purpose is to bring the life science and drug discovery communities together to learn, share, connect, innovate and collaborate, on an open access basis. We achieve this through the provision of world class conferences, networking events, webinars and digital content.
Sponsored Content Policy: News-Medical.net publishes articles and related content that may be derived from sources where we have existing commercial relationships, provided such content adds value to the core editorial ethos of News-Medical.net, which is to educate and inform site visitors interested in medical research, science, medical devices and treatments.
Last Updated: Oct 29, 2026