Accurately characterizing the tumor micro-environment when tissue sample access is restricted can be a key challenge in the immuno-oncology field. The balance and tumor infiltration of T-cell subpopulations are of significant interest. In this interview, NewsMedical speaks to Cerba Research on the use and value of T-regulatory immunochemsitry multiplex for solid tumor analytical validation.
What are T-Cells and why are they important?
T-cells are typically categorized as helper (Th), cytotoxic (Tcyto), memory or regulatory (Treg) cells. T-cells are considered important immune effector cells, making them preferred targets for immuno-modulation. Tcyto cells deliver optimal immune responses and protect against invading microbes and tumor antigens. Under homeostatic conditions, Tregs encourage peripheral tolerance. However, where tumors are concerned, Tregs may suppress Tcyto cell functions.
What is the multiplex protocol and how was it developed?
Cerba Research developed the multiplex protocol, Histoprofile®- T-reg light panel, using the Discovery ULTRA (Ventana) platform, which was designed to stain sub-populations of specific T-cells on a single slide. This prevented the need for serial sections from a patient’s precious formalin-fixed paraffin-embedded (FFPE) samples in clinical trials while still offering a comprehensive analysis of the tumor microenvironment.
The multiplex protocol was optimized and pre-validated on a non-small cell lung cancer FFPE sample. The analytical validation included specificity, sensitivity, precision, and antigen stability tests on healthy tonsils (control) and pathological breast, lung, head and neck and colon FFPE samples sourced from the Cerba Research Montpellier Biobank.
Can you describe a specific application involving the Histoprofile®- T-reg light panel multiplex protocol?
To evaluate Histoprofile®-T-reg light protocol specificity, the multiplex protocol was used to investigate healthy human tonsil samples (negative/positive controls). An FDA-approved healthy multi-tissue TMA comprised 33 different tissues from three donors. In this application, a pathologist validated the specificity of the three biomarkers on all tested tissues.
The Histoprofile®-Tregs light protocol was tested on a range of solid tumor FFPE samples, including non-small cell lung cancer (NSCLC), triple-negative breast cancer (TNBC), head and neck squamous cell carcinoma (HNSCC), and colorectal cancer (CRC).
A multi-organ cancer TMA complemented tissue blocks to evaluate a sufficient number of samples for each indication. A pathologist then scored slides to give a semi-quantitative analysis of the targets and confirm specificity.
How is the analytical precision of the Histoprofile®- T-reg light panel assessed?
To assess the analytical precision of the Histoprofile®-T-reg light protocol, we performed intra-run and inter-run reproducibility on two samples of breast, lung, colorectal, and head and neck cancers. In this evaluation, slides were analyzed with Halo for cell density. The mean CV of all samples was then calculated for each tissue type and solid tumors.
When using positive cell densities for CD3, CD8, and FoxP3 as the readout for the protocol, it is possible to meet the acceptance criteria (CV<20%) for solid tumors. For CD3, the CV is 21%, but at Cerba Research, we consider this sufficient due to a low positive cell density (<5% of total cells).
How do you go about testing antigen stability?
To assess the stability of the targets in the Histoprofile®-T-reg light protocol, a kinetics experiment is necessary to analyze the same sample aged over a period of time (from fresh up to three months). This test is usually performed using two samples per indication, with varying ranges of signal expression.
Over time, the resulting images of an NSCLC sample were assessed with Halo image analysis software. The slides included in the stability test were analyzed with Halo software to establish each target’s cell density of the multiplex.
What are the key biomarkers that indicate effective treatment?
T-cell infiltration into the tumor is a key biomarker to estimate the response to checkpoint immune therapies. In one particular study, five colorectal cancer (CRC) samples were stained with the Histoprofile®-T-reg light panel and then analyzed with Halo to determine the densities of CD8 T-cells and Treg cells in the tumor and stroma compartments, and the densities of the cell populations at the tumor/stroma border.
In this particular case, there were significantly more Tregs in the stroma than in the tumor (p = 0.026). Similarly, more T-cells were present in the stromal compartment than in the tumor but not to a significant level (p = 0.096). An accumulation of the T-cells and Tregs cells on the stromal side of the interface was observed.
What makes the Histoprofile®- T-reg light panel multiplex protocol a standout tool for the study of T-Cell populations?
After demonstrating clear specificity and sensitivity, the analytical performance of the Histoprofile®-T-reg light protocol using anti-CD8, anti-CD3 and anti-FoxP3 indicated the ability to detect Tcyto and Treg cells in a range of solid tumors, including, but not limited to, lung, head and neck, breast, and colorectal cancer FFPE tissues. The protocol met the acceptance criteria in relation to repeatability and inter-assay reproducibility.
Antigen stability shows that it is possible to detect antigens at a level similar to fresh sections after three months. At Cerba Research, the Histoprofile®-T-reg light protocol has been validated on solid tumors at an experimental endpoint level.
Spatial analysis of the protocol provides an in-depth analysis of the tumor microenvironment, allowing appreciation of immune cell infiltration into the tumor. We believe that the Histoprofile®- T-reg light panel is a practical tool that facilitates the investigation of T-cell populations in various human solid tumors in clinical trials.
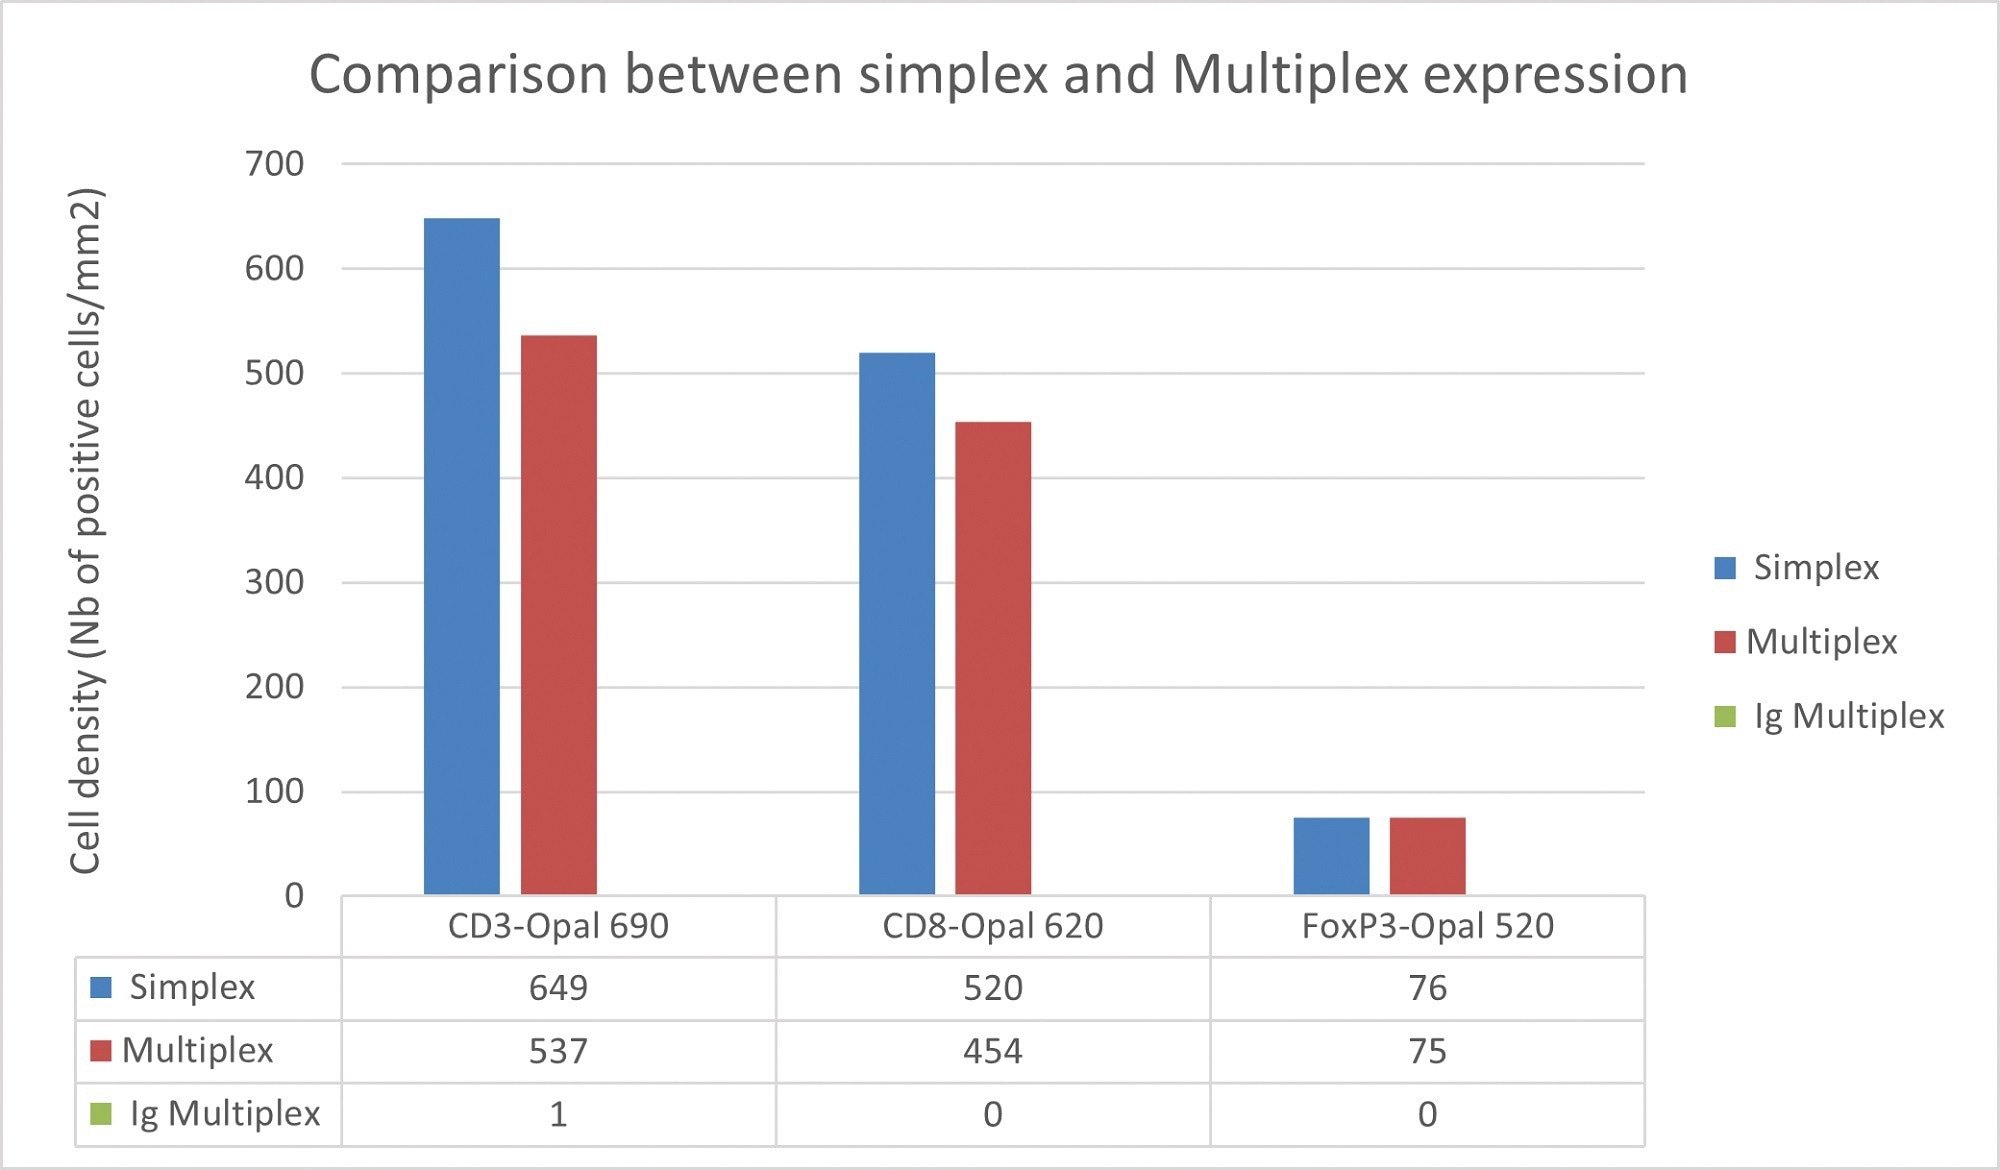
Figure 1. Comparison of cell density between simplex and multiplex slides. Image Credit: Cerba Research
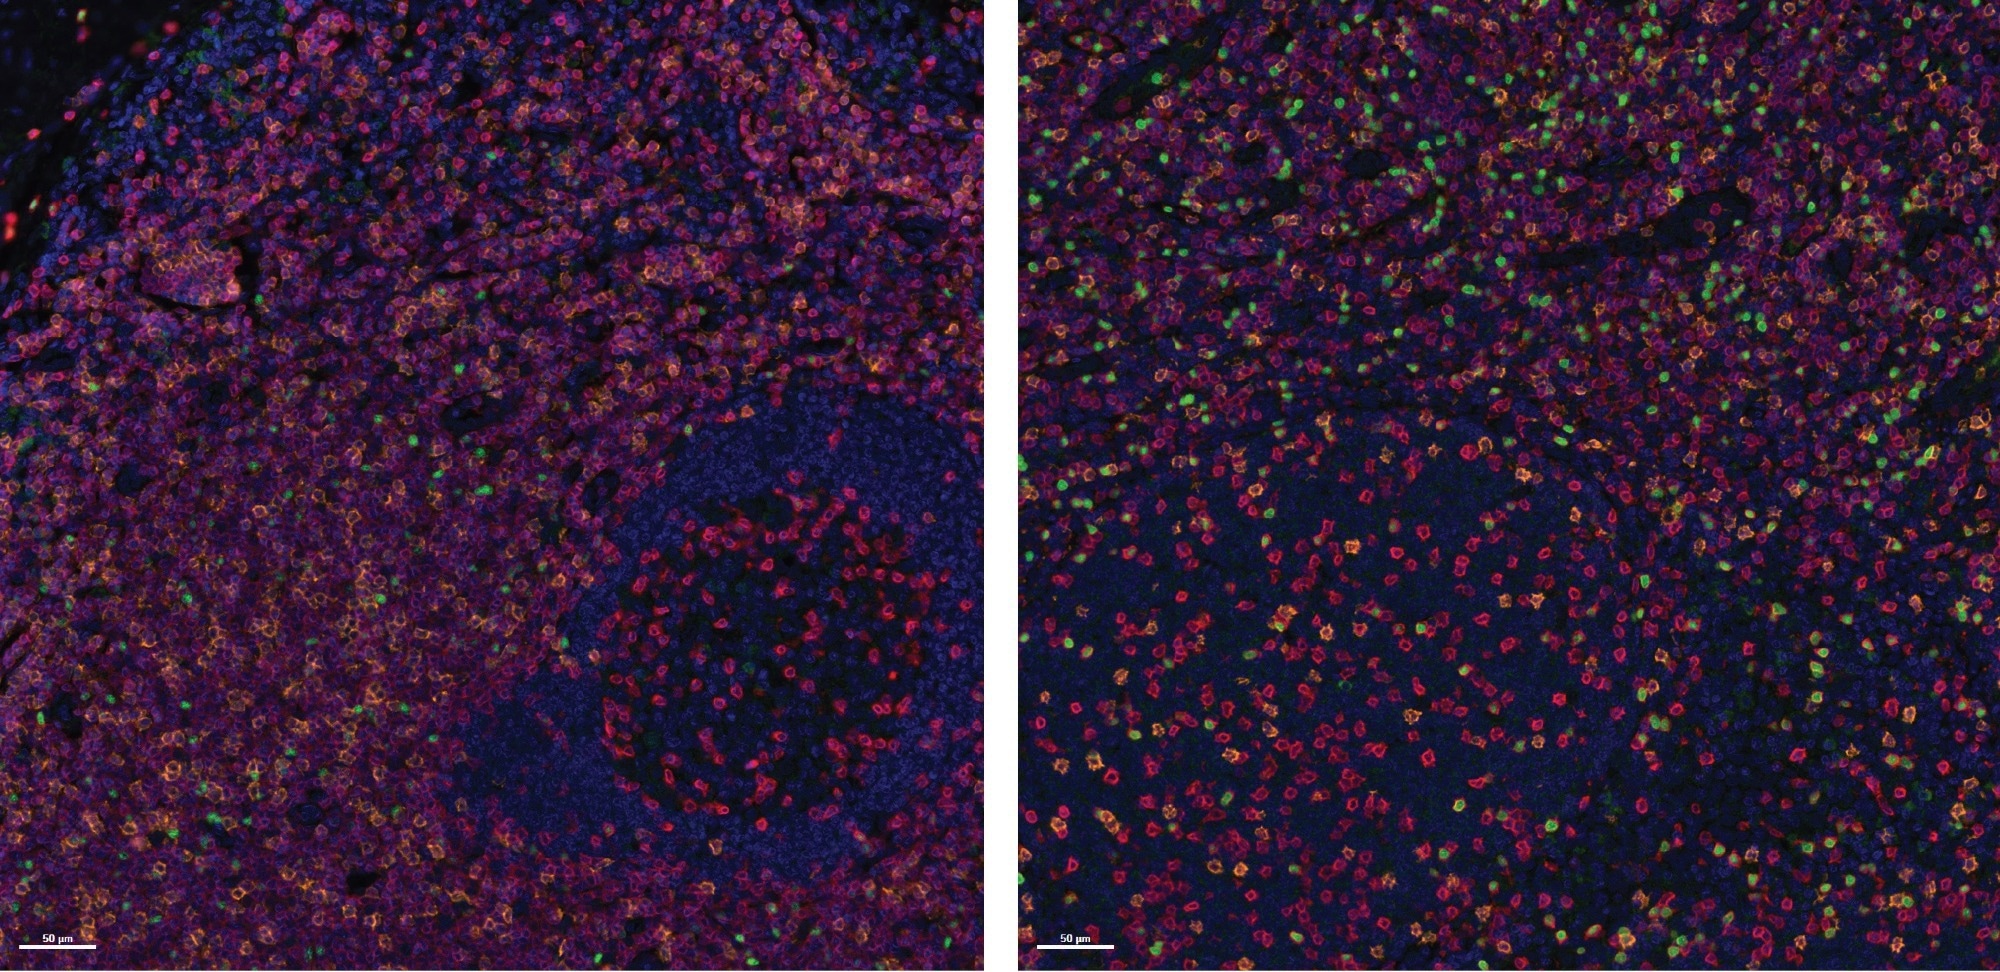
Figure 2. Specificity assessment on Healthy Tonsil FFPE samples. Representative images of two tonsil samples stained with the Histoprofile®-Tregs light panel. CD3 (Red), CD8 (Orange) and FoxP3 (Green). Scale bar: 50 μm. Image Credit: Cerba Research
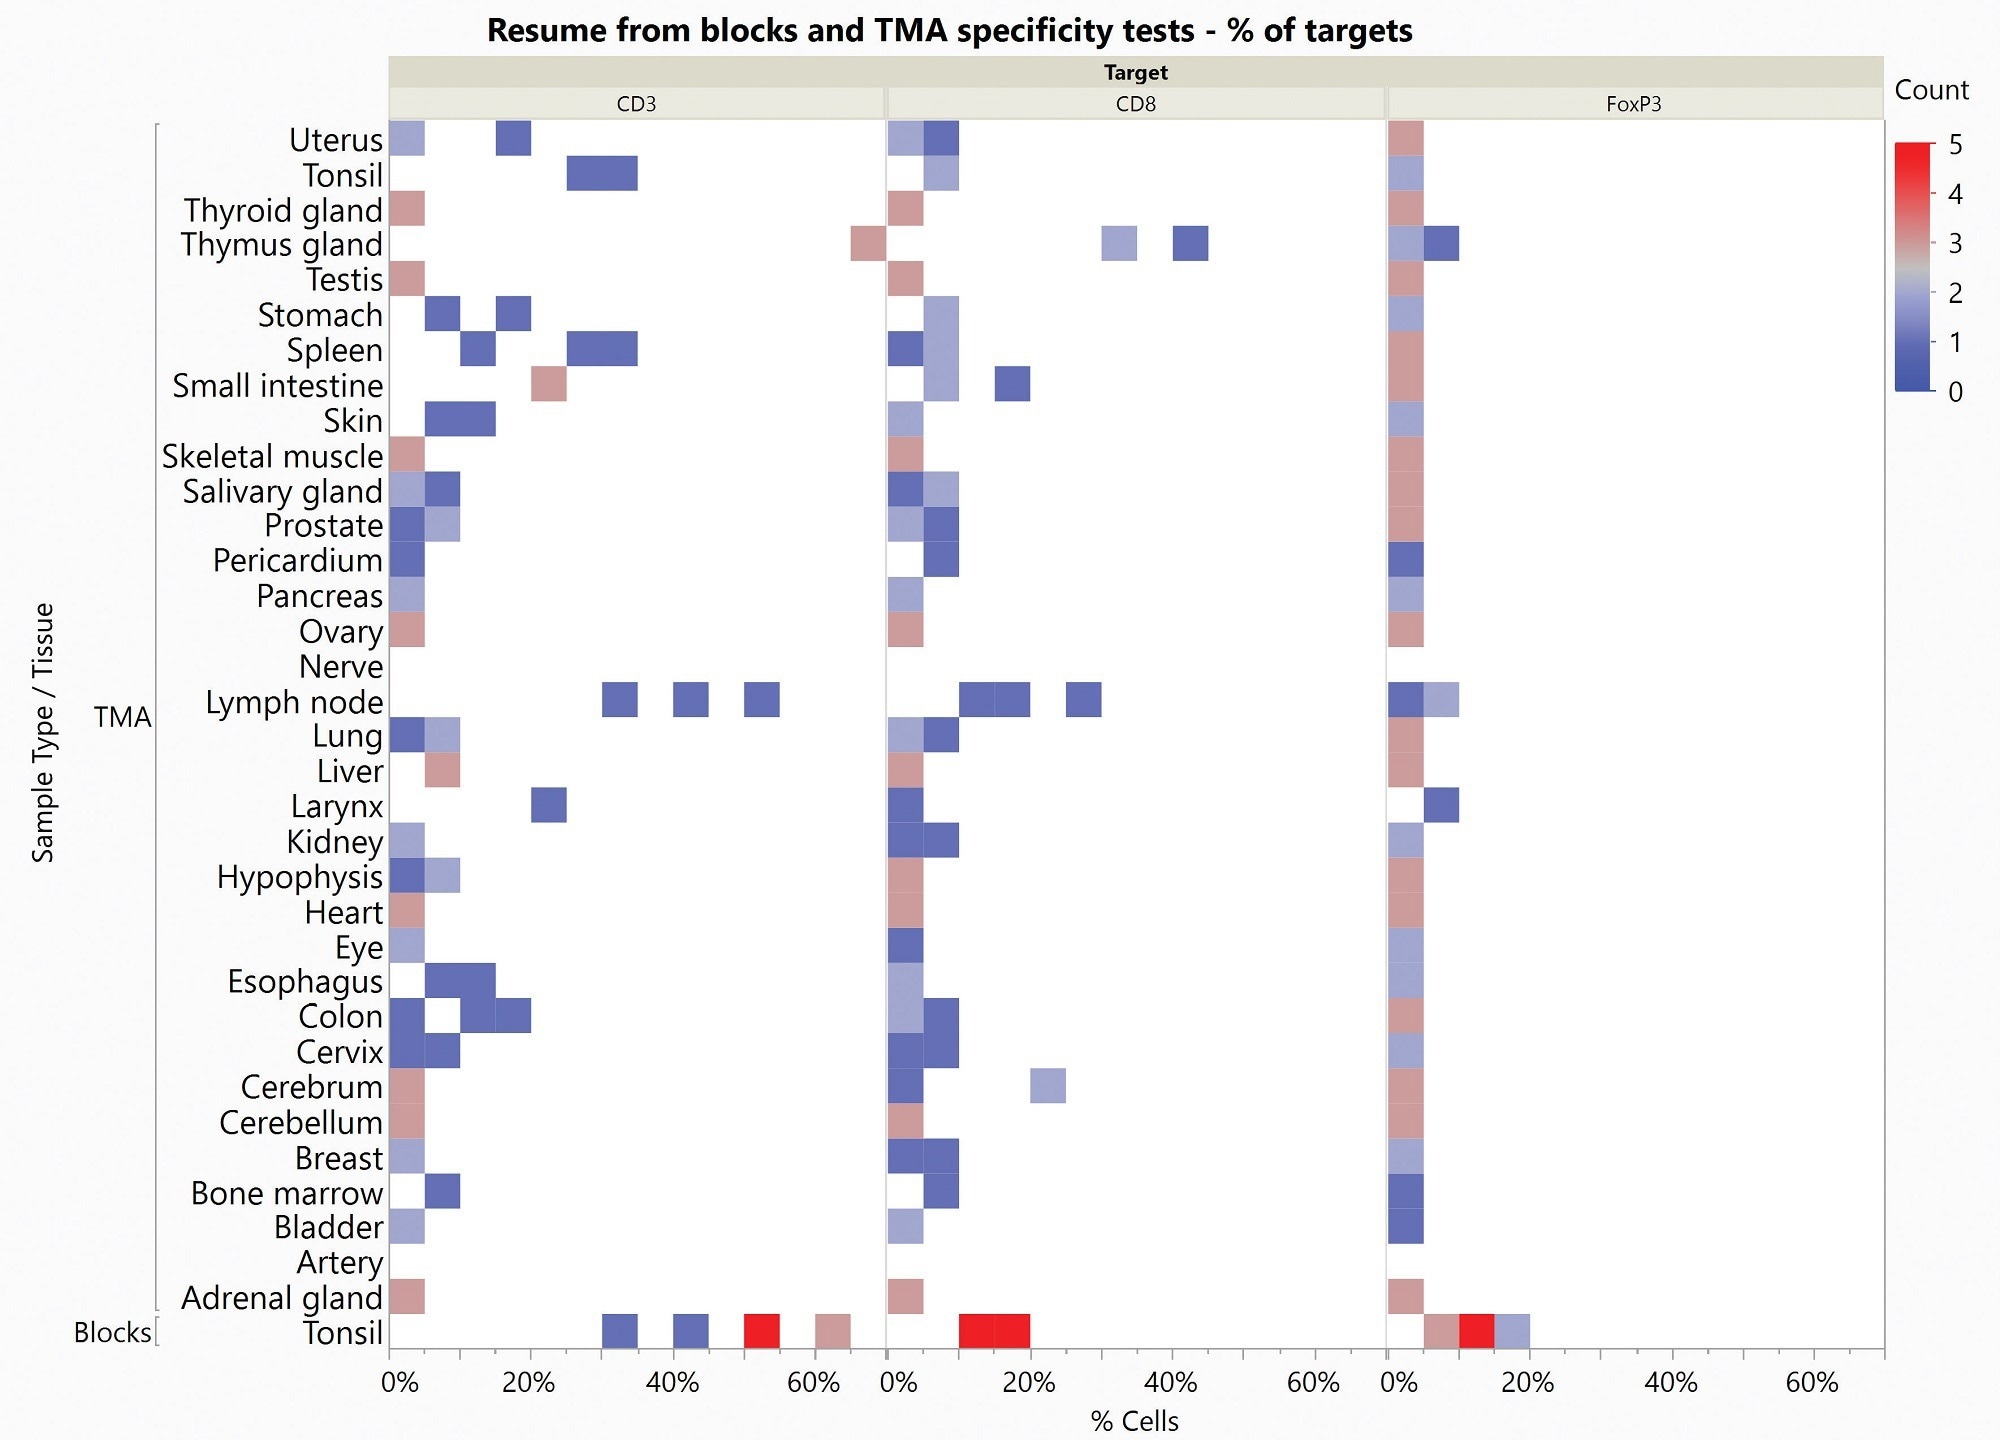
Figure 3. Heat Map of specificity results obtained on Healthy Tonsil Blocks and Healthy Multi-organ TMA. Count represents the number of stained samples for each tissue and each target in each percentage of positive cells range. Image Credit: Cerba Research
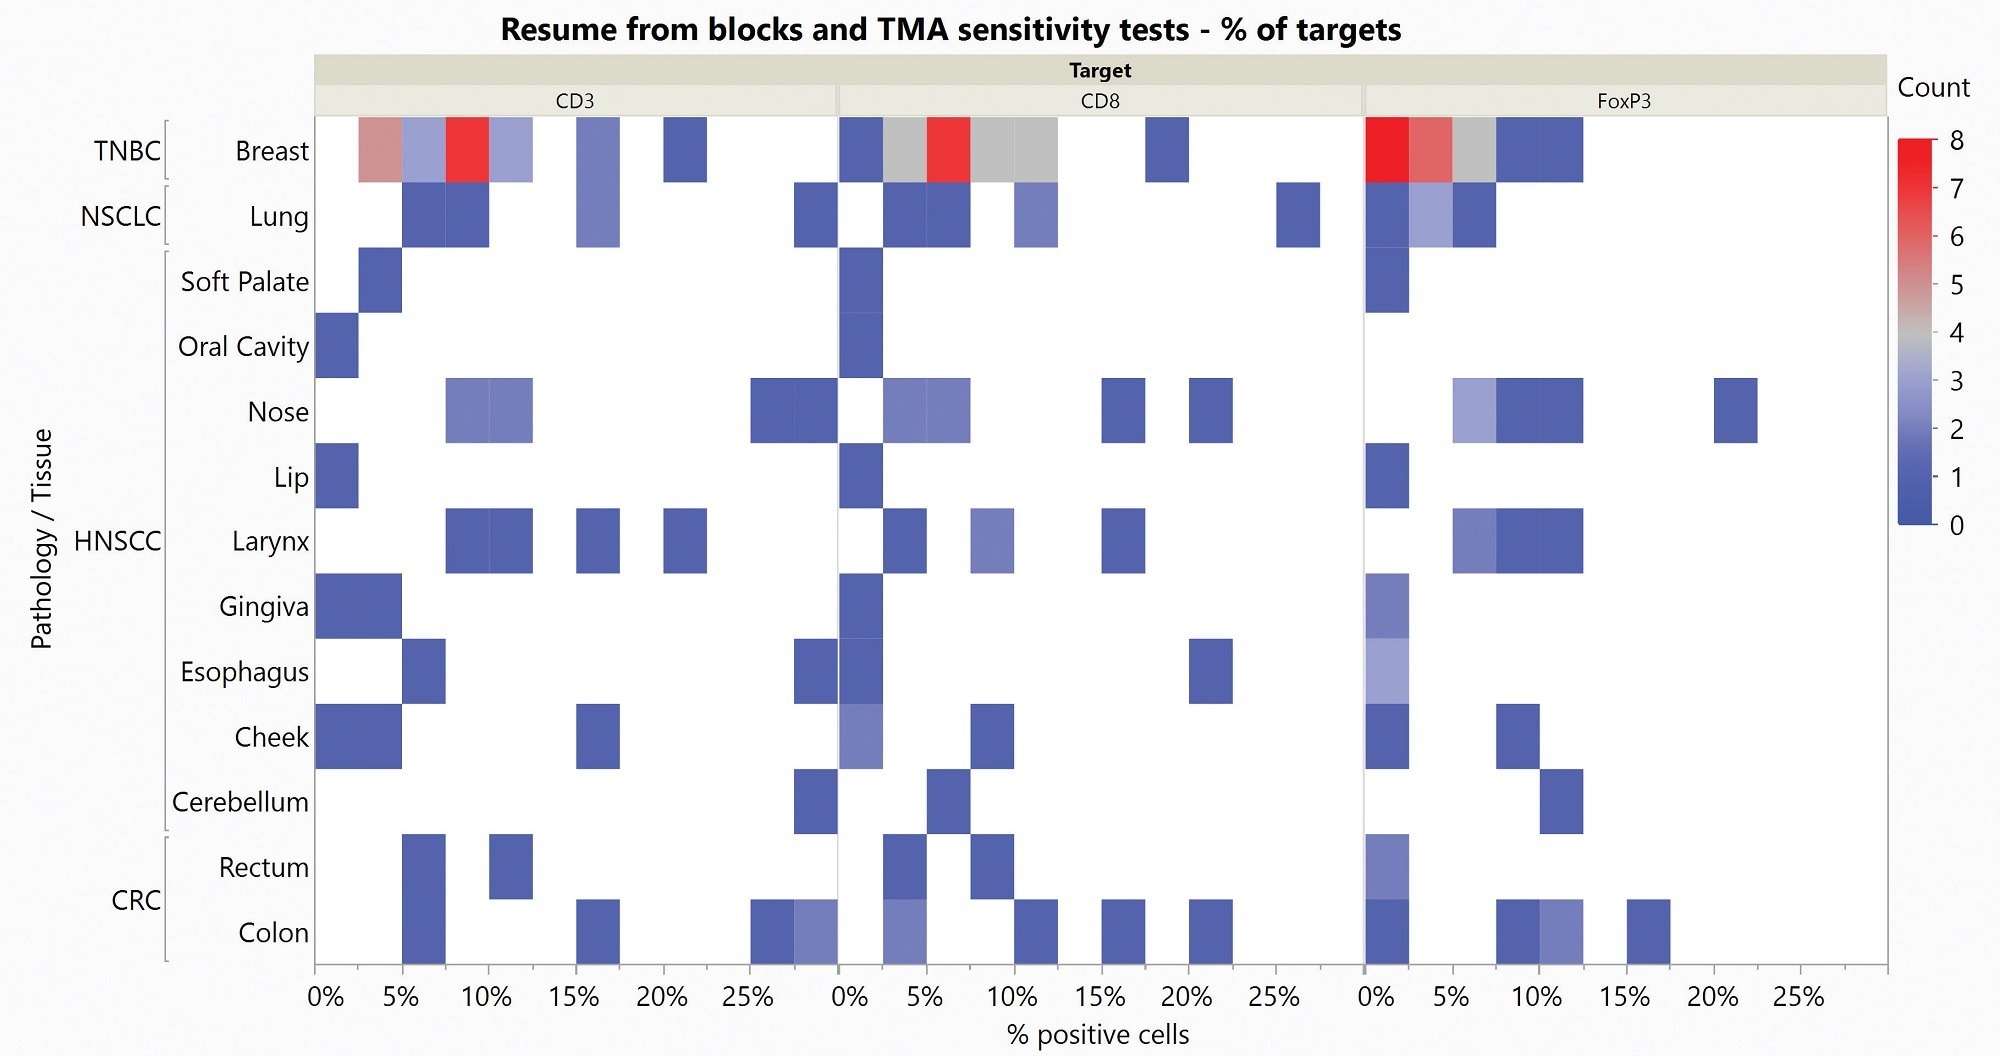
Figure 4. Heat Map of sensitivity results obtained on Blocks and Multi-organ TMA. Count represents the number of stained samples for each tissue and each target in each percentage of positive cells range. Image Credit: Cerba Research
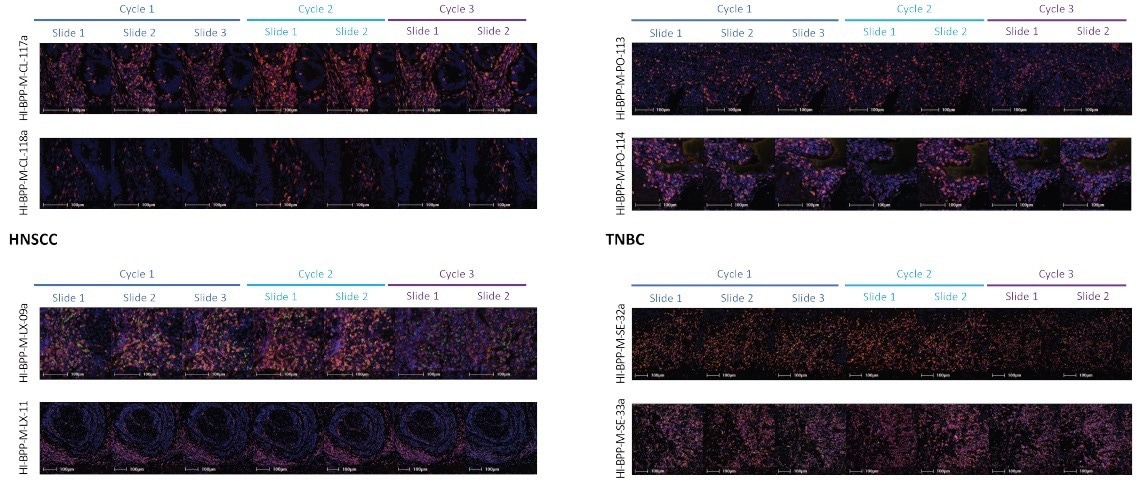
Figure 5. Representative images from precision assessment of the Histoprofile®-T-reg light protocol on NSCLC, TNBC, HNSCC and CRC. CD3 (Red), CD8 (Orange) and FoxP3 (Green). Scale bar = 100 μm. Image Credit: Cerba Research
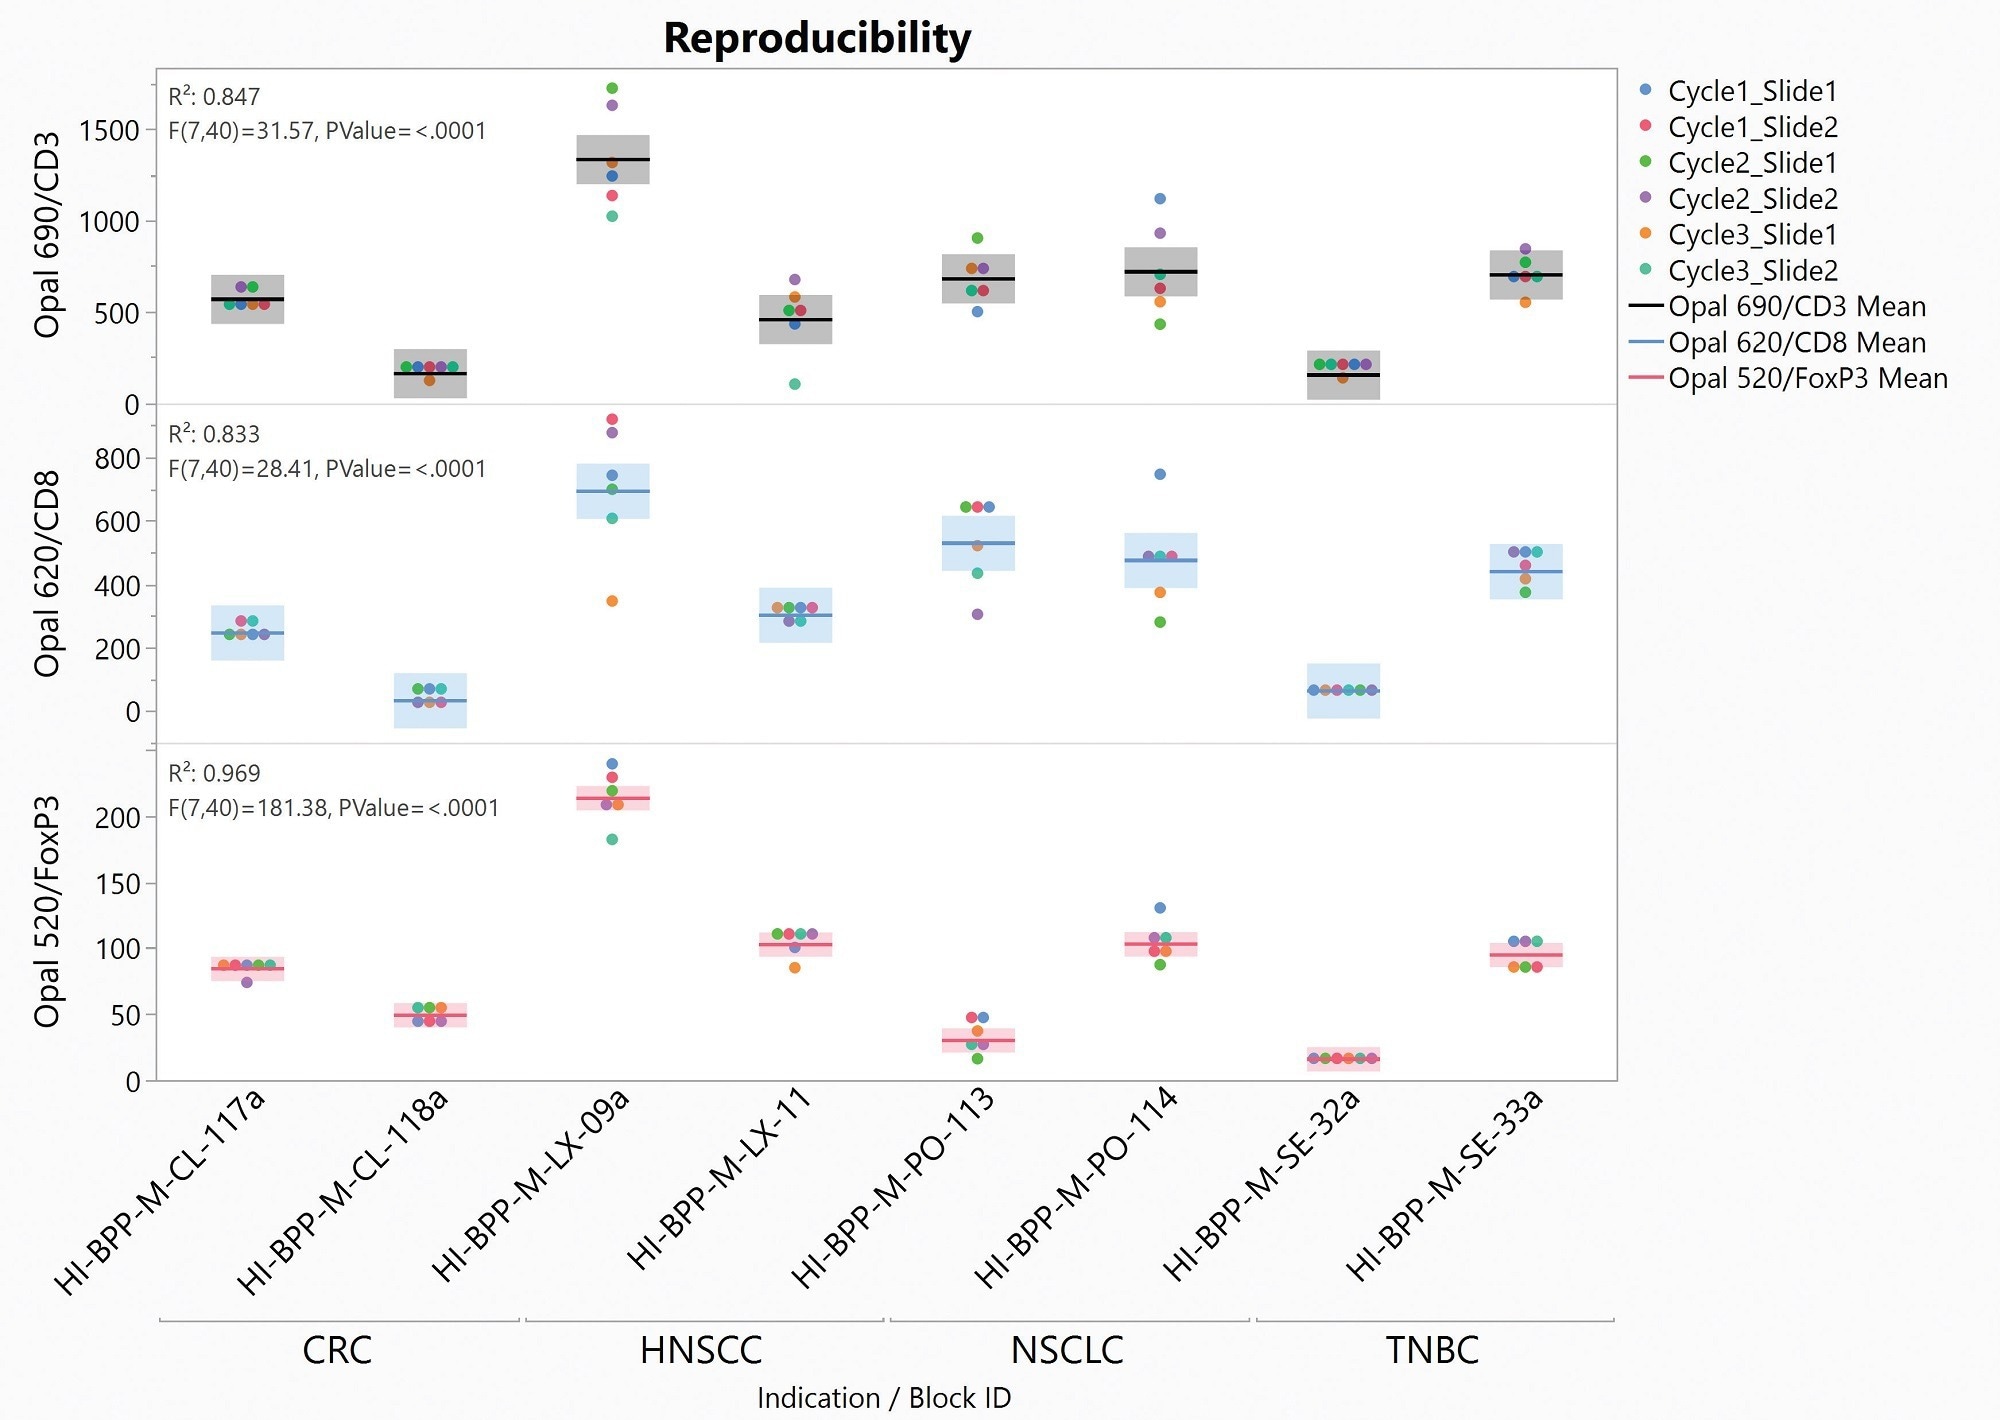
Figure 6. Distribution Graph of reproducibility test slides. CD3 (top row), CD8 (middle row) and FoxP3 (lower row) cell densities in function of sample and indications. Image Credit: Cerba Research
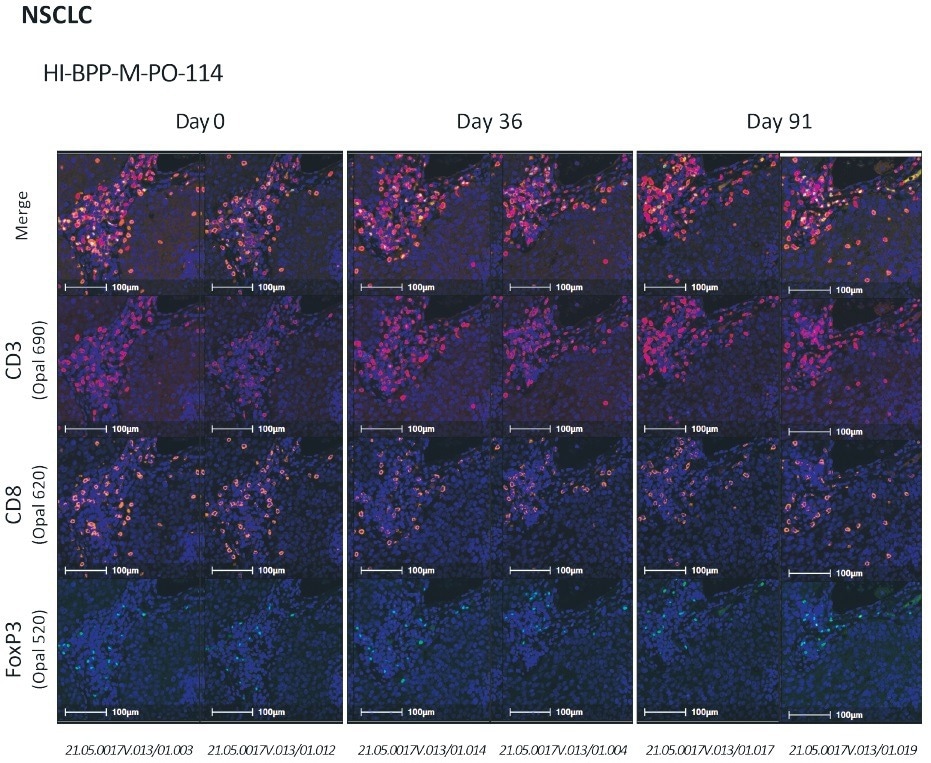
Figure 7. CD3/CD8/FoxP3 stability assessment on NSCLC.From top to bottom: merge, CD3 (red), CD8 (orange), FoxP3 (green). Scale bar = 100 μm. Image Credit: Cerba Research
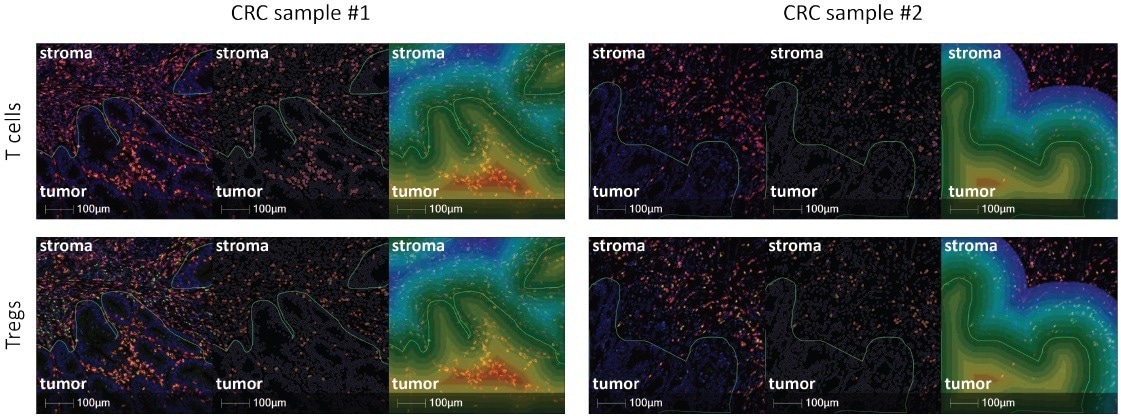
Figure 8. Representative images from spatial analysis using HaLo (Green line represents the Tumor/Stroma interface. Left image: Histoprofile®-Tregs light panel CD3 (red), CD8 (orange), FoxP3 (green). Middle image: Halo masks for T cells (top) and Tregs (bottom). Right image: Halo representation of the areas evaluated during the interface analysis. Each color represents a distance of 10 μm. Scale bar = 100 μm. Image Credit: Cerba Research
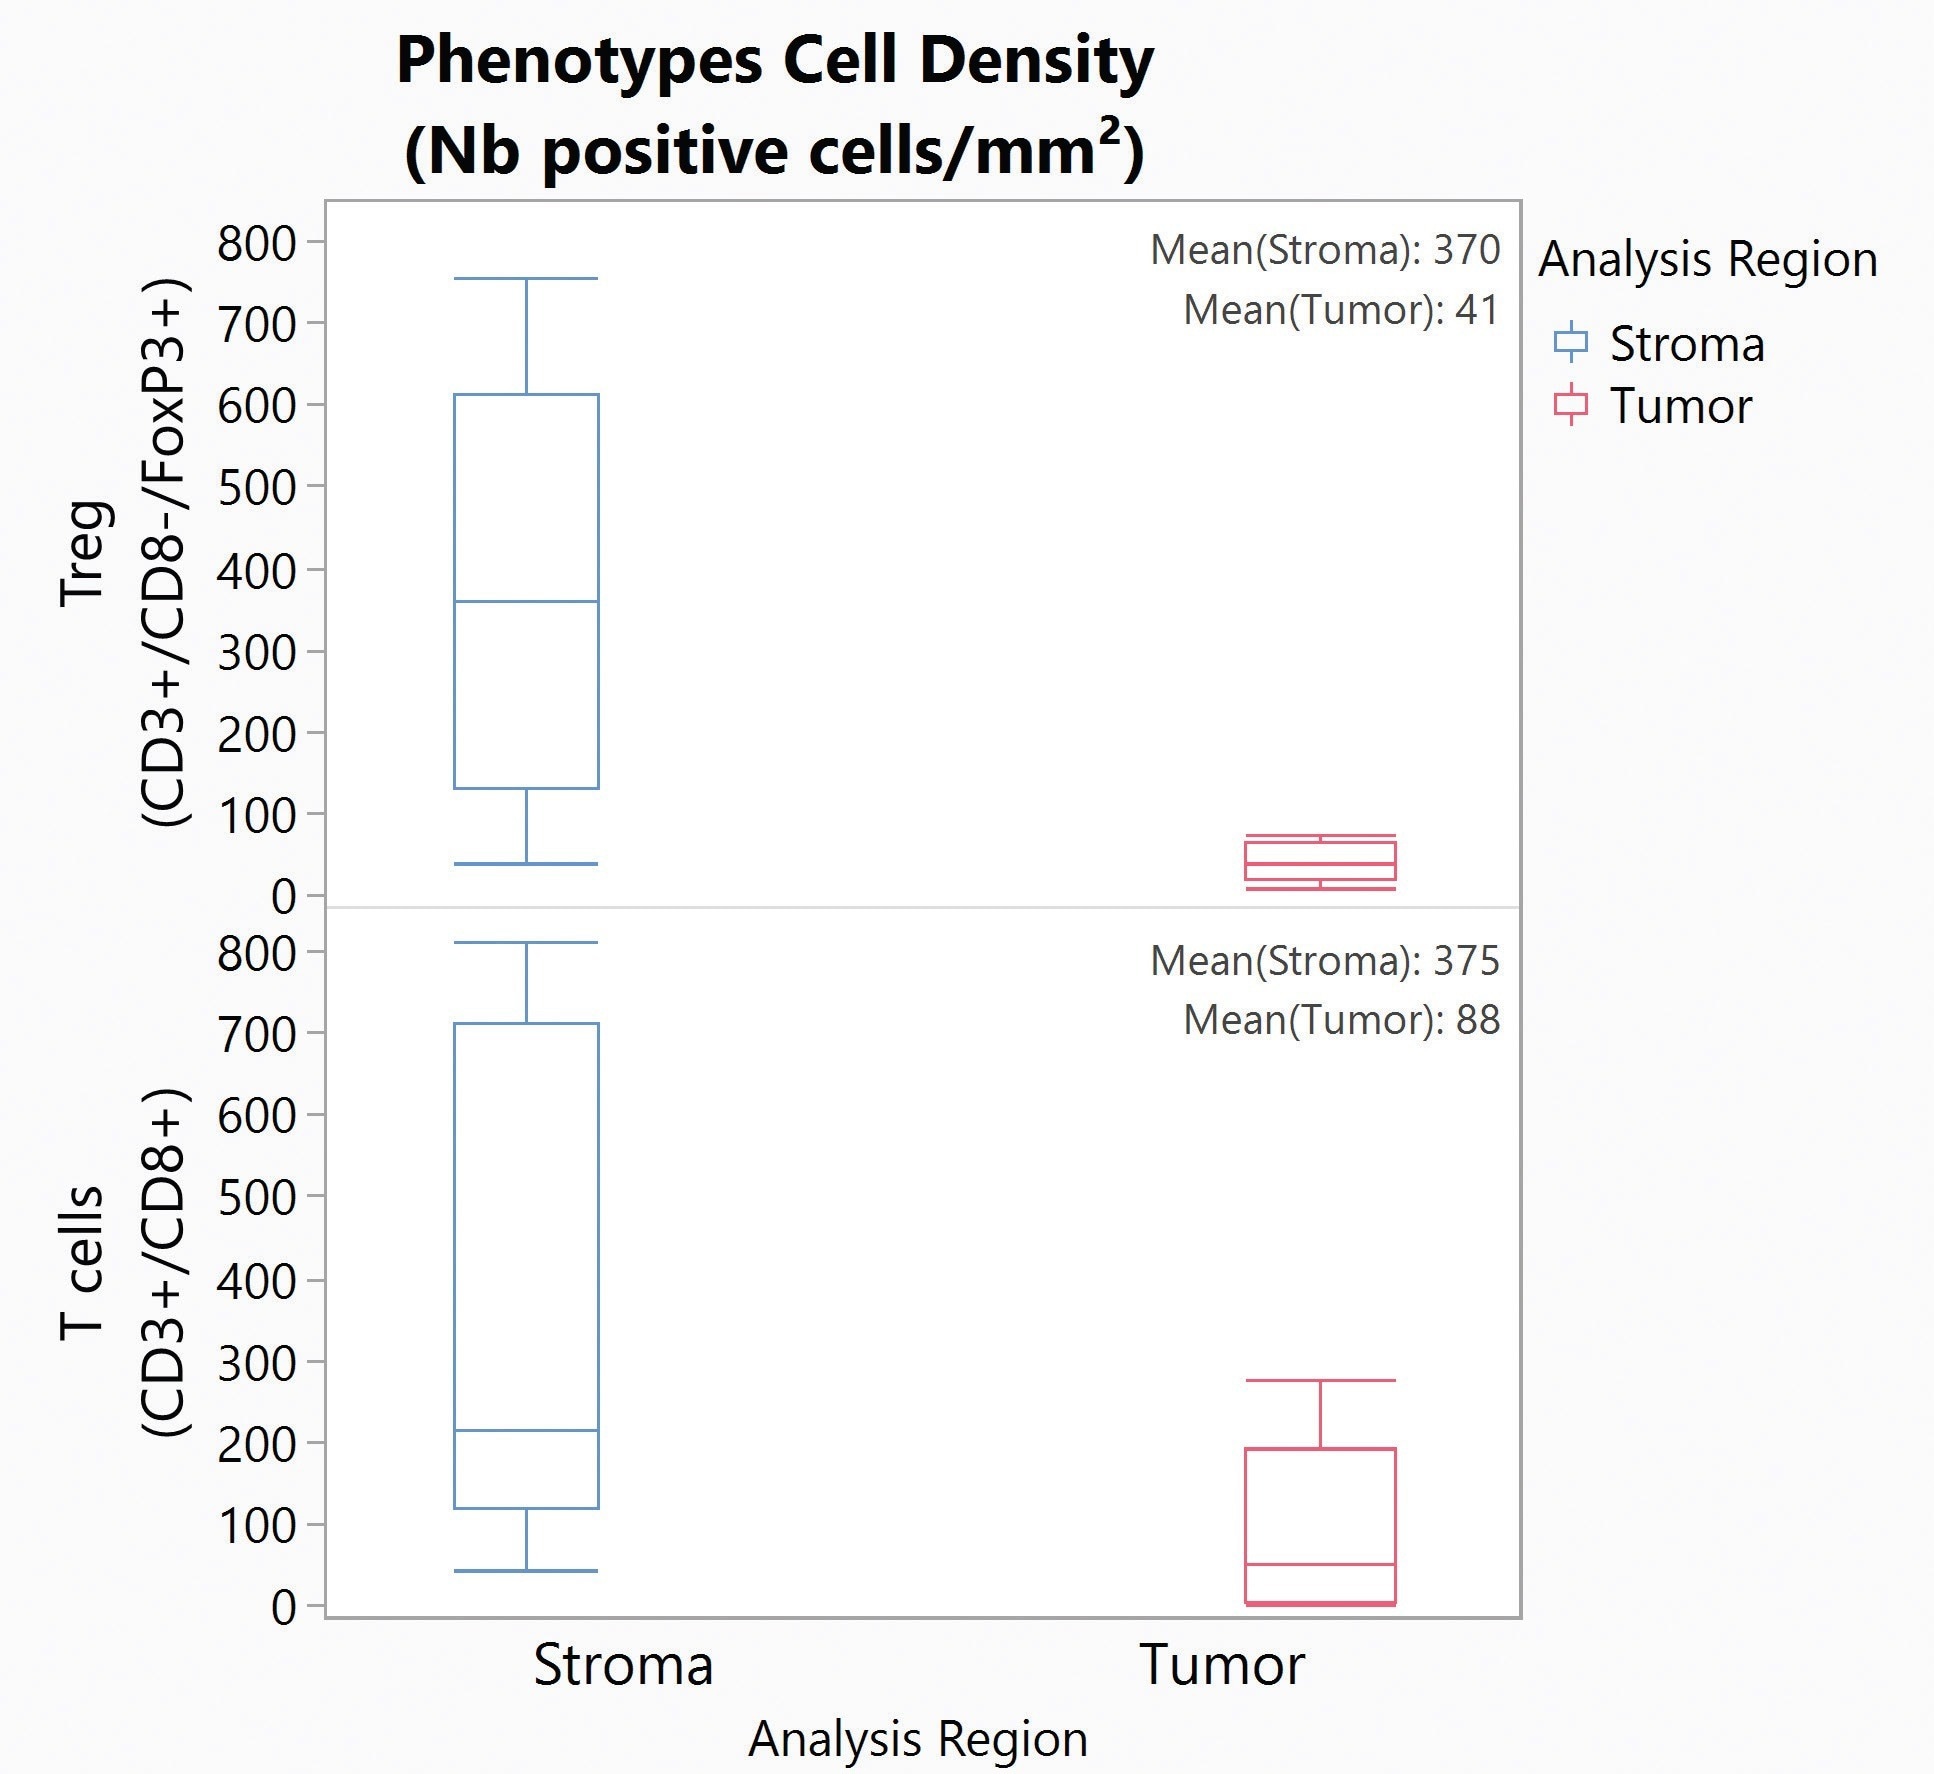
Figure 9. Box Plot for Tregs (top) and T cells (bottom) density in the Stroma (blue) and Tumor (red) for five CRC samples. Image Credit: Cerba Research

Figure 10. Area Plot showing Tregs (red) and T cells (blue) infiltration in the Tumor (left) from the Stroma (right) for five CRC samples. Image Credit: Cerba Research
About Cerba Research
For over 35 years, Cerba Research has been setting the industry standard for exemplary clinical trial conduct. Today, across five continents, with a focus on precision medicine, we are changing the paradigm of the central lab’s role in complex clinical research.
From protocol inception through development and to market, our passionate experts deliver the highest quality specialized and personalized laboratory and diagnostic solutions. Partner with us for the most efficient strategy to actualize your biotech and pharmaceutical products sooner and improve the lives of patients worldwide.
 Analyzing regulatory and effector T cells in tumors