Introduction
Quantification of nucleic acid concentrations is often performed by measuring light absorption in UV-VIS spectrometers. There are a few challenges faced in this measurement method. In UV-VIS spectrometers, light absorption measurements are performed at 260nm, and a specific conversion factor is used for calculating the concentration. Contaminations due to interfering particles, proteins or other organic materials can also be detected through measurements at varying wavelengths: 230, 280, 320 or 340nm.
However, photometric measurements are not very sensitive. A specific threshold value needs to be reached in order to distinguish the nucleic acid from other artifacts. For samples containing other nucleic acids as contaminants, it is difficult to accurately quantify high and low concentrations of nucleic acids. Further, determination of nucleic acids by photometric methods is difficult because all nucleic acids exhibit an optimum absorbance at 260nm. However, single stranded nucleic acids can be differentiated from the double stranded nucleic acids based on their absorbance because absorbance of the former is higher than the latter. This phenomenon is known as hyperchromicity (Figure 1).
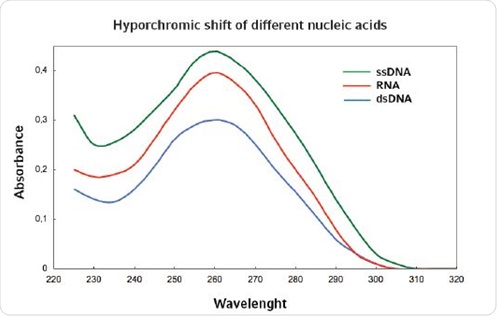
Figure 1. Hyperchromicity for different nucleic acids.
This differentiation is not visible naturally. Determining the concentration of one nucleic acid is affected by the presence of another. Once plasmid DNA isolation is carried out in the absence of RNA digest, overlapping absorbance maxima appear. Around 90% of the RNA remains in the eluate post classic plasmid preparation. In this form of plasmid isolation, some additional challenges, such as contaminations with phenol or proteins, may arise, making it difficult to accurately determine plasmid concentration by photometric methods.
Alternate Fluorescence Dye Measurements
Concentration of nucleic acids can be measured through an indirect method that determines molecules by using a fluorescent dye. By following this method, dsDNA, RNA, ssDNA, oligonucleotides and proteins can be accurately determined. This method provides higher specificity and sensitivity when compared to traditional light absorption methods by a factor of 1,000 to 10,000. An overview of a few common fluorescent dyes along with their respective detection limits is presented in Table 1.
Table 1. Examples of fluorescent dyes for the purpose of quantification of biomolecules. The data are from the manufacturers’ manuals.
|
Dye
|
Target molecule
|
Measurement range
|
|
PicoGreen
|
dsDNA
|
0.025 – 1000ng/mL
|
|
Hoechst H33258
|
dsDNA
|
0.1 – 10μg/mL (dsDNA)
|
|
Ethidium Bromide
|
dsDNA, RNA
|
0.1 – 10μg/mL (dsDNA)
|
|
RiboGreen®
|
RNA
|
1 – 1000ng/mL
|
|
Oligreen®
|
ssDNA, Oligo-DNA
|
0.1 - 1000ng/mL
|
|
NanoOrange®
|
Protein
|
10ng/mL - 10μg/mL
|
The key to the effectiveness of this method is the ability of dyes to bind to nucleic acid specifically, for example, dsDNA can be detected accurately at extremely low concentrations. The PicoGreen is a preferred dye for quantification of dsDNA, thanks to its higher specificity. Even minute quantities of solubilized dsDNA can be measured with this dye.
Further, even in samples that contain equal amounts of RNA or single stranded DNA, the PicoGreen dye is able to distinguish dsDNA. Even though other dyes like ethidium bromide interact with RNA, they are not capable of attaining low detection limits that PicoGreen can achieve. The Hoechst H33258 is more suited for dsDNA than the PicoGreen dye; however, it lacks the sensitivity exhibited by PicoGreen. An overview of the detection methods for dsDNA is listed in Table 2.
Table 2. Sensitivities of known detection methods for dsDNA and RNA, respectively.
|
|
Absorption
|
Fluorescence
|
|
|
|
Method of detection
|
A260
|
Hoechst H33258
|
Ethidium Bromide
|
PicoGreen
|
|
DNA Measurement range
|
1–50μg/mL
|
0.01–15μg/mL
|
0.1–10μg/mL
|
0.025– 1000ng/mL
|
|
RNA Measurement range
|
1–40μg/mL
|
NA
|
1–40μg/mL
|
Minimal sensitivity
|
|
Ratio DNA/ RNA
|
0.8
|
400
|
2.2
|
>100
|
Differences in Fluorescence and Absorption Methods of Measurement
The Beer-Lambert’s law may be used for determining the concentration of the molecules in a solution using UV-Vis absorption. The parameters required for calculations using these laws include coefficient of absorbance, substance-specific constant and the length of the optical path in the cuvette. As per the Beer-Lambert’s law, the concentration is given by the equation: A=E*C*L, where E is the coefficient of absorbance, C is the concentration and L is the length of the optical path.
For fluorescence-based determination of the concentration, the sample is illuminated by light of a specific wavelength. As in case of absorbance methods, light is first absorbed. Upon excitation of a fluorophore, either the fluorophore or its excited electrons do not return to their original energy levels directly but return to the original energy level happens in two steps. First returning to a marginally lower energy level, followed by a second step where it returns to its original energy level. This is depicted in Figure 2. Further, the wavelength of the light that is emitted is always longer than the light causing excitation, as shown in Figure 3.
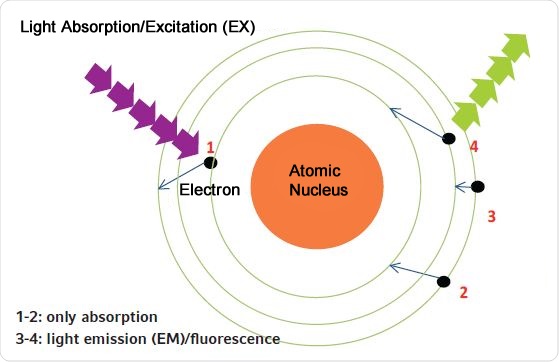
Figure 2. Principle of absorption and fluorescence measurements. 1. By light absorption, the electron is elevated to a higher energy level (absorbance measurement); 2. The electron returns to its original energy level; 3. The electron does not return directly to its original energy state; it moves to an intermediate level; 4. The electron jumps from the intermediate level to its original level (releasing fluorescent light).
_of_the_fluorophore_has_a_shorter_wavelength_than_the_fluorescent_light_emitted_(EM).jpg)
Figure 3. The light for excitation (EX) of the fluorophore has a shorter wavelength than the fluorescent light emitted (EM).
The major difference between absorbance measurements and fluorescence measurements in determining the concentrations is that fluorophore like PicoGreen is used as an indirect way of detecting molecules like the DNA in absorbance measurements. Moreover, sample concentrations are determined based on a previously produced standard curve. After combining the standard nucleic acid concentrations with the fluorescent dye, a fluorimeter is used to determine the relative fluorescence (RFU) following interaction with the standards.
The detection of dsDNA using the Eppendorf BioSpectrometer fluorescence with the PicoGreen assay is described in this article. Apart from demonstrating the standard method that involves the use of five standards as described by the manufacturer, this article will also demonstrate the possibility of obtaining reliable results with only two standards.
Nucleic acid measurement methods that use RiboGreen or OliGreen on the Eppendorf BioSpectrometer, are offered along with the standard methods. The main advantage of using the BioSpectrometer fluorescence is that it functions not only as a fluorimeter, but also as a complete UV/Vis scanning spectrometer. This capability is especially useful in the preparation of standard solutions, where spectrometric verification is a must for the standard stock solution. Therefore, the BioSpectrometer fluorescence is a one stop solution to prepare all the measurements needed for the analysis with the kit described above.
Materials and the Experimental Procedure
Materials
The following materials are required for the experiment:
- BioSpectrometer fluorescence
- VIS-Macro cuvettes
- Quant-iT PicoGreen dsDNA Kit
- Molecular grade water
- Two 50 mL test tubes
- 1.5/2 mL Eppendorf Safe Lock Tubes™
- Eppendorf MixMate®
- Eppendorf UVette®
- Eppendorf Research® pipettes
Generation of Standard Curve using dsDNA-Standards
The user manual of the PicoGreen dsDNA kit and the Quant-iT aided the preparation of the measurement solution. However, only 1mL measurement volume was used for measurement in the macro cuvettes in place of 2mL because of a low height of the light ray (8.5mm) in the Eppendorf BioSpectrometer fluorescence. In the preparation of the standard curve, the standard concentration needs to be in correspondence with the final volume of the whole preparation.
Calculations of sample concentrations that follow also need to consider the above point. Therefore, preparing the samples and standards in the same manner is essential. All instruments used for fluorescence measurements, especially pipettes, need to be calibrated, since these measurements are highly sensitive, as compared to absorbance measurements. Another recommendation for accurate results is the acclimatization of all the components of the kit to room temperature 2 hours before usage.
The first step is the preparation of the assay buffer, for which 1mL of the 20 x TE buffer provided by the kit is diluted using 19mL of water in a 50mL test tube. 100µL aliquots of the reagent concentrate solution are provided. From the aliquots, 50µL is extracted and diluted 200 times to 10mL, in the freshly made assay buffer. The 10mL volume contains 0.05mL reagent solution and 9.95mL assay buffer. As many as 20 measurements, which include samples and standards, can be made using this volume.
The DNA stock solution provided in the kit has a concentration of 100ng/µL. The stock solution is first diluted 50 times in the assay buffer. After dilution, the primary DNA solution should have a final concentration of 2ng/µL, and the starting solution for generating the standard curve should have a concentration of 2000ng/mL. The primary solution needs to be validated photometrically. When the dsDNA solution having a concentration of 2ng/µL is measured in a cuvette with a light path of 10mm, its optical density is measured as 0.04 at 260nm. Using the Eppendorf BioSpectrometer fluorescence, which is a comprehensive UV-VIS spectrometer, complete photometric validation of the primary solution and subsequent fluorimetric measurements can be made.
Photometric measurements can be performed using Eppendorf UVettes. The blank solution can be the freshly made 1 x TE buffer. The dsDNA method is chosen for individual photometric measurements. Figures 4A and 4B show the following settings:
- Background correction at 320nm or 340nm.
- Activation of the ‘scan’ for detection of contaminants in the primary solution before measurement in the area “check parameters”.
- Ratio 260/230
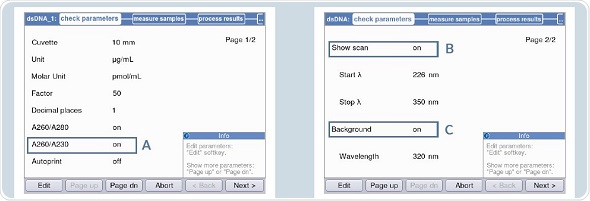
Figure 4. Settings for measurement of the primary solution in the Eppendorf Biospectrometer fluorescence A: A260/A230 B: Activation of “scan” C: Activation of background.
The primary solution used for standard curve generation corresponds to a concentration specified by the manufacturer, as shown in Figure 5.
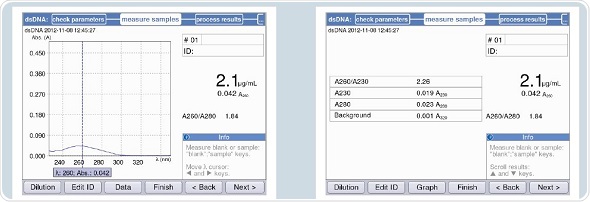
Figure 5. Verification of the concentration of the primary solution for the standard concentrations.
By altering the values for the standard curve appropriately, the expected concentrations may be detected. Consider the scenario where the dsDNA concentration is measured as 1.6µg/mL, then the generated standard concentrations may be: 800, 80, 8, 0.8, and 0ng/mL, as listed in Table 3 below.
Table 3. Pipetting scheme for the respective standard concentrations.
|
Dilution step
|
Assay buffer volume [μL]
|
Volume of dsDNA primary solution [μL]
|
Volume of diluted reagent solution [μL]
|
Final dsDNA concentration in total volume [ng/mL]
|
Standard number
|
|
1
|
0
|
500
|
500
|
1000
|
5
|
|
2
|
450
|
50
|
500
|
100
|
4
|
|
3
|
495
|
5
|
500
|
10
|
3
|
|
4
|
499.5* (495)
|
0.5 (5 μL 1:10)
|
500
|
1
|
2
|
|
5
|
500
|
0
|
500
|
0
|
1
|
*The primary solution was to be diluted 1:10 (e.g. 5μL DNA solution plus 45μL assay buffer). From this diluted solution, 5μL are diluted in 495μL assay buffer).
Once the dsDNA primary solution has been validated, it is possible to generate the subsequent solutions for standard measurements. As mentioned previously, only 1mL of the solution is taken for measurements in place of the 2mL as suggested by the kit manufacturer, which enables substantial saving in reagents. Typically, for each dilution step, two or three identical replicates are prepared. The pipetting strategy for each dilution is presented in Table 3.
The samples must be treated in a similar manner as the standard, which implies that a 500µL sample in 1 x TE buffer needs to be mixed with a 500µL reagent solution. Owing to a high signal, sample dilution needs to be performed using the freshly made 1 x TE buffer. The primary concentration can be automatically estimated and displayed by programming the dilution into the instrument. The blank solution is the standard consisting of 0ng/mL. The preparation of standards needs to be performed in the Eppendorf Safe-Lock tube, and the Eppendorf MixMate® can be used for uniform mixing of the standard before performing measurements.
Measurement and Programming of the Standard Curve
The quantification of dsDNA is done by following the PicoGreen method. Programming of the standard concentration and the number of standards may be done in the area “check parameters”.
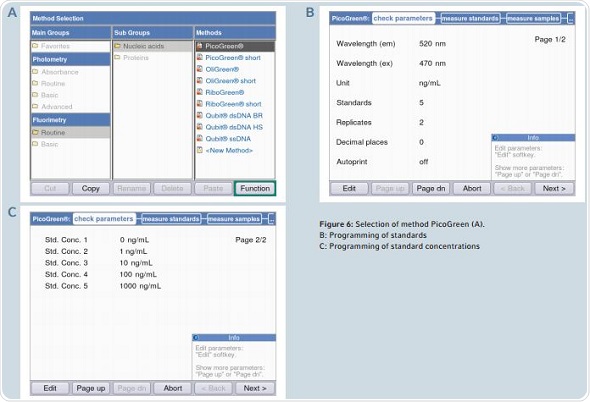
Figure 6. Selection of method PicoGreen (A). B: Programming of standards C: Programming of standard concentrations.
Pre-programming of all the parameters is done in accordance with the information contained in the protocol for the Quant-iT PicoGreen dsDNA Kit. The area “measure standards” can be reached by clicking the “next” soft-key. A decrease in the fluorescence signal in the sample is observed over time, which is termed as photobleaching. In order to avoid photobleaching, all measurements of the standards and samples need to be completed in quick succession. Figure 7 shows that the display alternates between table and graphic views during measurement. Two critical aspects for analysis are the liner progression of the curve and the coefficient of determination (R2), which cannot be less than 0.95. A warning will be issued by the instrument when the value of R2 is less than 0.95.
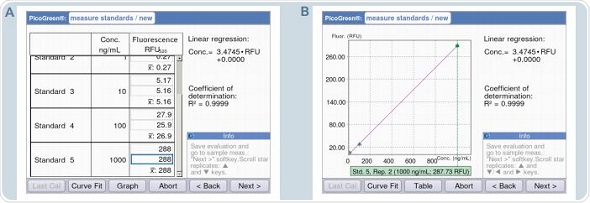
Figure 7. Generation of the standard curve with defined dsDNA standard concentrations. A: Table format / B: Graphic format.
Using PicoGreen “short” Method
The number of standards required can be reduced for measurements such as dsDNA quantification with PicoGreen that use strictly linear standard curves. The Eppendorf BioSpectrometer fluorescence offers the “short” methods exclusively for such measurements, allowing measurements for a zero standard and an additional standard of a specific concentration such that it falls within the linear range. For the “short” method, linear interpolation is followed for the analysis, as it is impossible to achieve linear regression with only two standards. Figure 8 shows that 0 and 500ng/mL are pre-programmed for the “short” method using PicoGreen.
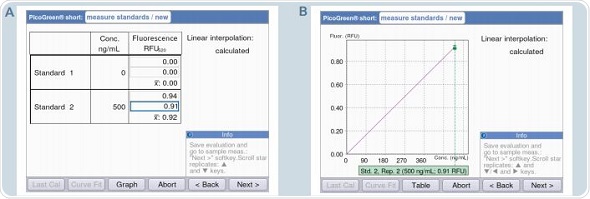
Figure 8. Generation of a standard curve using the PicoGreen “short” method A: Table format display / B: Graphic format display.
For the “short” method, programming can be completed with ease and quickly. It can be observed from the results that the sample quantifications performed through the “short” method produce results with the same accuracy as those obtained by conventional analysis that uses five standards.
Quantification of RNA, Oligo-DNA and ssDNA
The other quantification methods that are pre-programmed apart from the PicoGreen method are quantification of RNA using RiboGreen and quantification of oligoDNA or ssDNA using OliGreen. Corresponding protocols are provided by the Quant-iT “OliGreen ssDNA Reagent and Kit” and the Quant-iT “RiboGreen RNA Reagent and Kit (RNA)”. These methods follow the same quantification process as followed in the analysis using PicoGreen.
This holds for the “short” methods that can be pre-programmed as well. Applying non-linear regression for the standard curve of the RiboGreen kit is more advantageous than applying linear regression as suggested in the manual of the kit. In case of the Eppendorf BioSpectrometer fluorescence, regression may be chosen during the process of standard measurements, while the standard curve is generated. Any regression that is chosen must be an optimal fit into the shape of the standard curve. The optimal fit is chosen based on the value of coefficient of determination R2, the value of which should be between 0.95 and 1.
Experimental Procedures for Fluorimetric Measurements using the Eppendorf BioSpectrometer Fluorescence
The fluorophores mentioned above are highly light sensitive dyes and their fluorescence tends to decrease over time due to increase in the influence of light, termed as photobleaching. In order to avoid photobleaching, the reagents need to be kept in dark and cool storage environments. As the measurement progresses, the effect of photobleaching is more prominent, and hence, the sample measurements need to be taken in quick succession.
The stability of the fluorophores differs significantly, with RiboGreen losing its fluorescent properties quickly under the effect of light. However, PicoGreen exhibits reasonably higher stability. Different standard curves need to be generated for each measurement process because it is difficult to achieve 100% reproducible conditions for such highly sensitive methods that are influenced by changes in the intensity of light or temperature. It is recommended to perform sample preparations for a series under uniform light conditions in order to achieve reproducible results.
The fluorescent measurement methods require elaborate preparations for the actual measurements compared to UV-VIS spectroscopy; therefore, it would be beneficial to collect samples before the series of measurements begins. Apart from simplifying the measurement procedure, collection of samples at the beginning helps save reagents. The zero standard also serves as a blank for all measurements. As pointed out earlier, the pre-programmed regression analysis must be an optimal fit to the standard curve.
However, conditions may be altered for achieving a best fit while the standard curve is generated. By using the function “curve fit”, the method of analysis may be altered at any time during the measurement. Duplicate or triplicate measurements may be used for generating more accurate standard curves for each standard, which helps in detecting an abnormal value. Repeated measurements may be taken for each standard. However, the RFU values need to be closely monitored during measurement, and those values that are less than one should not be considered. The samples need to be mixed thoroughly, especially the standards before measurements are taken.
Results and Discussion
Both the PicoGreen-“short” and PicoGreen methods were compared. Some of the advantages that the pre-programmed “short” methods offer are:
- Standard measurement is completed faster
- Enables saving of substantial volumes of reagents
The BioSpectrometer fluorescence measures only two standards – 0 and 500ng/mL for PicoGreen-short, with the zero standard used as a blank simultaneously. Figure 7B shows a strictly linear standard curve for the PicoGreen analysis that uses 5 standards. Hence, it may be safely assumed that two standards are sufficient for analysis. Two standard curves – one using two standards and another using 5 standards, with concentrations as 0,1,10,100 and 1000ng/mL, were generated to facilitate direct comparison. This was followed by the quantification of the samples with concentrations of 10, 100 and 1000ng/mL based on both the standard curves. These results are illustrated in Figure 9. The first five screenshots (9A-C) show the analysis results using five standards, while 9D-F show analysis results using two standards.
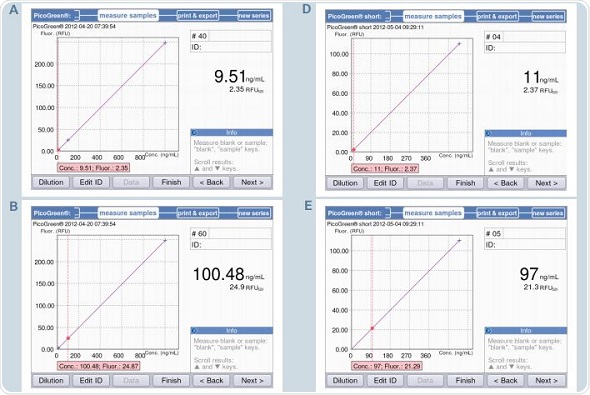
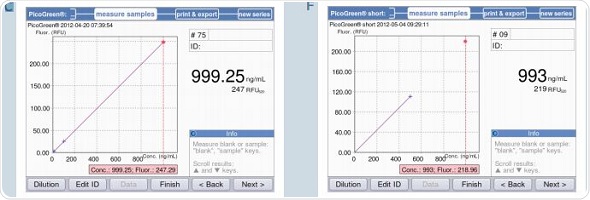
Figure 9. Quantification of dsDNA samples (10, 100 and 1000ng/mL) using the methods PicoGreen and PicoGreen “short”. A-C: Method PicoGreen D-F: Method PicoGreen –“short”.
It can be seen from the figure that both the results correlate with each other. However, using 5 standards for measurement produces more accurate results, while the two standard method is suitable for rapid sample verification. This observation is applicable when the sample is measured using a reference instrument based on the PicoGreen-“short” method that uses 2-point calibration, as shown in Table 4. There is only minimum deviation in the results, but they are well within the expected range.
Table 4. Comparison of dsDNA quantification using the method “PicoGreen short” on the BioSpectrometer fluorescence and a reference instrument.
|
Nominal concentration
[ng/mL]
|
Results in reference instrument (2 Standards)
[ng/mL]
|
Deviation from nominal value
[ng/mL] / [%]
|
Result in the Biospectrometer using PicoGreen-“short” (2 Standards)
[ng/mL]
|
Deviation from nominal value
[ng/mL] / [%]
|
Difference between BioSpectrometer and reference instrument
[%]
|
|
10
|
11.2
|
1.2 / 12
|
11
|
1 / 10
|
2.4
|
|
100
|
97.2
|
-2.8 / 2.8
|
97
|
-3 / 3
|
0.8
|
|
1000
|
993.1
|
-7 / 0.7
|
993
|
-7 / 0.7
|
0.0
|
The data presented in Table 4 and Figure 9 show the effectiveness of the PicoGreen-“short” method in accurate quantification of DNA. There is only a minimal deviation from the nominal values, and the variations from the reference instrument are also minimal. A significant benefit of the Eppendorf BioSpectrometer is that when a standard curve is used, the sample results are within the graph, corresponding to the standard curve. On the basis of this feature, it is possible to instantly verify that the concentration of the sample falls within the range of the generated standard curve, thus eliminating the occurrence of false estimation in the results.
Macro-cuvettes made of poly-methyl methacrylate (PMMA) were used for all of the above measurements using 1mL volume. Any cuvette that is commonly available can be combined with the Eppendorf BioSpectrometer fluorescence. Semi-micro cuvettes made of PMMA, macro-cuvettes made of quartz, ultra-micro-cuvettes made of quarts, or Eppendorf UVette® may be used for fluorescence measurements. Although the sample volume required by the UVette for measurement is only 60µL, the reduced sample volume requirement translates to reduced fluorescent signal.
Therefore, the samples present at the lower end of the curve are likely to show inaccurate results during measurement of low concentrations. Fluorescence measurements for quantifying nucleic acids can be performed at considerably lower concentrations of dsDNA when compared to standard UV-VIS spectroscopy methods. Quantification of dsDNA through both fluorescence and absorbance by the Eppendorf BioSpectrometer fluorescence provides a distinct measurement range in the market. The use of micro volume cuvettes like the Eppendorf µCuvetteTM G1.0 helps extend the measurement range from 1ng/mL up to 1.5mg/mL.
Conclusion
The Eppendorf BioSpectrometer fluorescence is a combination of a complete UV-VIS scanning spectrometer and a fluorimeter. It also includes the methods that can be implemented on the Eppendorf BioSpectrometer basic instrument as well. Other fluorescence-based standard techniques for quantifying nucleic acids and proteins are available in the integrated fluorimeter. The Quant-iT kits provide the pre-programmed methods. Apart from the conventional five standard analysis methods suggested in the kits, “short” methods that analyze nucleic acids with only two standards are also available.
In the case of the PicoGreen analysis, it was proved that measurements could be made with the same accuracy using only two standards. A reference instrument was used to validate the results. A considerable reduction in the reagent volumes used is possible by combining the “short” methods with the use of the Eppendorf UVette. The measurement range of dsDNA quantification can be extended between 1 and 1,500,000ng/mL by integrating Eppendorf µCuvette G1.0 and the Eppendorf BioSpectrometer fluorescence.
Acknowledgements
Produced from materials authored by Martin Armbrecht1, Jasper Gloe2 and Wolfgang Goemann2 from:
1Eppendorf AG, Hamburg, Germany.
2Eppendorf Instrumente GmbH, Hamburg, Germany
References
- F. Lottspeich, H. Zsorbas, Bioanalytik, 1.Auflage (1998), Spektrum Verlag [German] 3rd edition, Spektrum publishers
- Mulhardt, C., Der Experimentator, Spektrum Verlag (Spektrum publishers)
- Gallager, R.S, Current protocols in molecular biology, Quantitation of DNA and RNA with Absorption and Fluorescence Spectroscopy, Appendix 3D
- Armbrecht, M., Karow, K.: Eppendorf μCuvette G1.0 - A new micro-volume system for highly precise photometric determination of nucleic acids or proteins in the Eppendorf BioPhotometer and Eppendorf BioSpectrometer, Applicaton Note 261
About Eppendorf NA
Eppendorf NA, with headquarters in New York, are a subsidiary of Eppendorf AG (Hamburg, Germany) – manufacturer of laboratory instruments and consumables for the life sciences.
To make it easy for labs in the United States to benefit from Eppendorf quality, they provide total customer support and service: taking/tracking orders; product installation and training; application support; calibration services; general product maintenance and repair, and more!
Eppendorf's products
Eppendorf products are used in all types of life science research and testing settings – from basic laboratory applications to highly specialized cell and molecular biology applications. They are highly regarded for their quality design and performance – beginning with extensive research and development, adding state-of-the-art technology and ending with strict quality-controlled manufacturing are what make their products stand out from the rest. It is what has made them a brand you have been able to rely on for over 70 years.
Over the years Eppendorf has improved upon and added to their flagship products – pipettes and pipette tips, centrifuges and microcentrifuge tubes – to now include the most ergonomic liquid handling devices and automated pipetting stations, quiet centrifuges, fast and fully flexible thermal cyclers, sample-protecting deepwell plates, cell manipulation systems and microcapillaries, ultra-low temperature freezers, shakers, incubators and bioprocessing equipment.
Eppendorf's services
Customer Support Representatives are available M–F, 8:30 AM – 8:00 PM (EST).
Local Sales Representatives cover the entire US to give you the fastest best possible attention. They know their products – and better yet, they know your applications. Feel confident in their abilities to assess your needs and determine the best products and systems to give you the best results.
Field Specialists also cover the entire US to provide post-sales installation and training on their specialty systems and automation.
The Applications Hotline is manned by degreed scientists working in their own fully functional life science laboratory. They are on call and email-accessible to help you troubleshoot your application or answer any technical question you may have. The Eppendorf Services group provides a wide variety of support services such as pipette calibration, instrument maintenance programs, and expedited repair.
Sponsored Content Policy: News-Medical.net publishes articles and related content that may be derived from sources where we have existing commercial relationships, provided such content adds value to the core editorial ethos of News-Medical.Net which is to educate and inform site visitors interested in medical research, science, medical devices and treatments.