Introduction
UV-VIS spectrometers are commonly used for determining the concentration of nucleic acids through light absorption measurements. The absorbance measurements are carried out at 260nm, and a conversion factor specific to the sample is used for calculating the concentration. In order to quantify the contamination by proteins, interfering particles and other organic materials, the sample is subjected to quantitative analysis at 230, 280 and 320nm. Nevertheless, photometric measurements are not very sensitive, and consume large sample volumes for measurement.
Fluorescence-based detection methods are capable of quantifying considerably smaller nucleic acid concentrations. In this method, the target molecules are detected indirectly by using a fluorescent dye. A standard curve is used for determining the sample concentration. Fluorescence-based measurement techniques provides more specific results because the fluorophores emit fluorescent light only when they are associated with the target molecule. There is also an increase in sensitivity via fluorescence measurements. Figure 1 shows the principle behind fluorescence measurements.
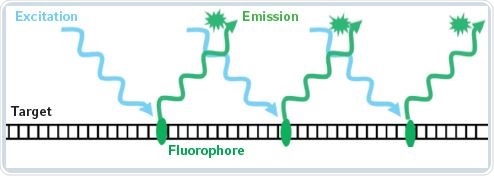
Figure 1. Principle of fluorescent measurement of nucleic acids
Fluorophores show selective binding to specific biomolecules, for example, a fluorophore shows binding affinity towards dsDNA molecules, while another binds only to RNA. This article examines the usefulness of the detection kits provided by Life Technologies and Promega with the help of the Eppendorf BioSpectrometer fluorescence. The chosen detection methods are for RNA quantification. The detection limit and the accuracy of the kits are assessed to throw light on the corresponding method parameters that are programmed on the Eppendorf BioSpectrometer fluorescence and the actual measurement process.
Materials and Methods
The materials used for the experiment include:
- Kits: QuantiFluor® RNA System (Promega), Quant-iT™ RiboGreen® RNA Assay Kit (Life Technologies); water (molecular biology grade), 1 x TE buffer, total RNA from human liver (Ambion®, # 7960), water (molecular biology grade)
- Instruments: Eppendorf BioSpectrometer® fluorescence and Eppendorf Research® pipettes
- Cuvettes, vessels: UVette®, Eppendorf Safe-Lock tubes.
Method
The Eppendorf BioSpectrometer fluorescence is programmed with the standard concentrations as per the protocols listed by the respective manufacturers. The standards for nucleic acid were also furnished in the kits. For each standard concentration, a total of three replicates were prepared and measured. The UVette with a final volume of 100µL was used for measurement. For measuring standards, the starting point begins with the lowest concentration and progresses towards the highest concentration. A complete series of measurements are invidually inserted into the cuvette shaft with identical alignment of the cuvette. A 200µL 1 x TE buffer is used to clean the cuvette after each measurement.
Details of the Measurement Protocol
All the components used for the experiment must be brought to room temperature before measurements are carried out. The “high concentration” version is chosen for both the kits.
Preparation of the 1 x TE working buffer
For preparation, the 20 x TE buffer is diluted using water as per the requirement. It is necessary to dilute the fluorescent dye in the kit to the ratio of 1:200 using the 1 x TE buffer for preparing the reagent solution.
Preparation of the RNA stock solution
All the instructions listed in the kit manual are followed stepwise. Before generating individual standards, the concentration of the RNA stock solution used for the standard curve should be verified by photometric methods. Table 1 lists the respective concentrations for both the kits as specified by the vendors. An UVette facing the 10mm light path with a total of 100µL volume is used for the measurements.
Table 1. Concentrations of the stock solutions
|
Kit
|
Absorbance of the stock solution at 260nm
|
Concentration of the stock solution [μg/mL]
|
|
Life Technologies: Quant-iT
|
0.05
|
2
|
|
Promega: Quantifluor
|
0.125
|
5
|
The Eppendorf BioSpectrometer fluorescence is not only capable of making fluorimetric measurements, but is also capable of performing control group measurements with the help of the comprehensive spectrometer module, as shown in Figure 2.
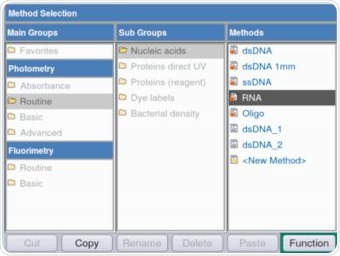
Figure 2. Selection of the RNA method for the purpose of verifying the RNA stock solution via absorbance measurements. Photometric as well as fluorimetric methods are available on the Eppendorf BioSpectrometer fluorescence.
It is evident from Figure 3 that parameters can be validated and/or modified as per the requirements through method selection. The maximum absorbance on the measured RNA curve was observed at a wavelength of 260nm. Figure 4 shows an example of the result.
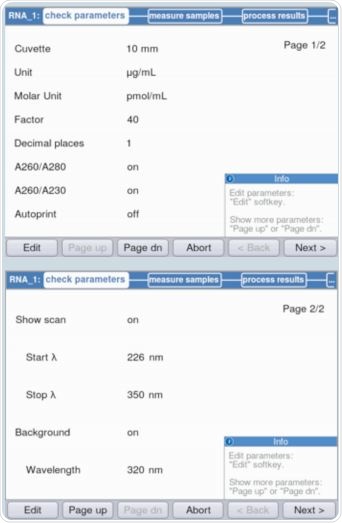
Figure 3. Verification of parameters prior to absorbance measurement.
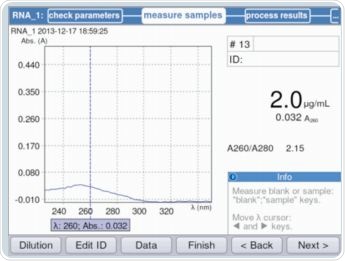
Figure 4. Calculation of the RNA concentration of the stock solution for the purpose of calculating the individual standards (example: Quant-iT Kit by Life Technologies)
Standards and samples are prepared in parallel
Each of the three Eppendorf Safe-Lock tubes were filled with 50µL of each sample and the standard solution using a pipette. Next, 50µL of the reagent is added to these three tubes and mixed thoroughly, followed by an incubation that lasts for 5 minutes at room temperature. The Eppendorf BioSpectrometer fluorescence set at an excitation and emission wavelength of 470nm and 520nm, respectively, is then used to measure the fluorescence of the individual standards and the samples. The sample and standard concentrations for the two kits are listed in Table 2.
Table 2. Standards and samples to be measured with the respective RNA detection kits
|
RNA standards Quant-iT/Life Technologies RNA detection kit
|
Sample concentration (liver RNA)
|
RNA-standards Quantifluor/Promega RNA detection kit
|
Sample concentration (liver RNA)
|
|
[ng/mL]
|
[ng/mL]
|
[ng/mL]
|
[ng/mL]
|
|
0
|
20
|
0
|
20
|
|
20
|
40
|
39
|
40
|
|
100
|
60
|
78
|
60
|
|
500
|
200
|
156
|
200
|
|
1000
|
400
|
313
|
400
|
|
-
|
800
|
625
|
800
|
|
-
|
1000
|
1250
|
1000
|
|
-
|
-
|
2500
|
-
|
Based on the instructions provided in the manuals for the respective kits, the standard concentrations are chosen. For evaluating the recovery, accuracy and lower limit of detection under identical conditions, the same sample concentrations are always chosen.
Programming Standards on the Instrument
Figure 5 shows that RiboGreen method is chosen for measurements through the following path: Fluorimetry/Routine/Nucleic acids/RiboGreen. Both quadratic and linear regressions are followed for analyzing the RNA samples, as shown in Table 2.
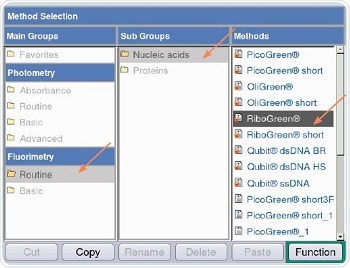
Figure 5. Method selection
Based on the kit being used, either five or eight standards, each having three replicates, are programmed. By using the “Next>”option, the user is led to the “measure standards” area, as shown in Figure 6. This is the area where standards are quantified in the order of the lowest concentration to the highest concentration, as shown in Figure 7.
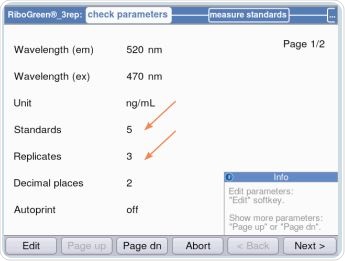
Figure 6. Establishing standards and replicates
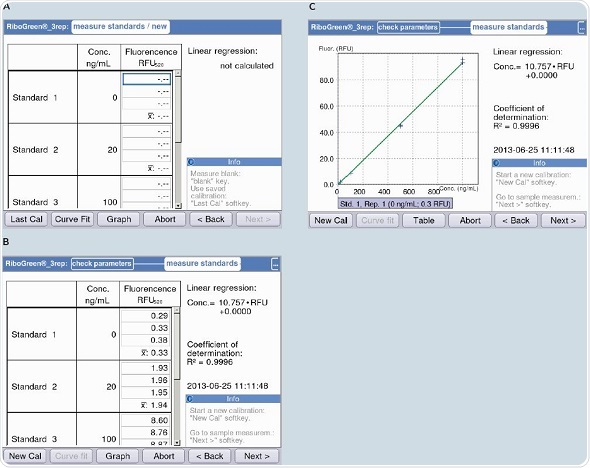
Figure 7. Measurement of the standard curve with the example of the RNA quantification kit “Quant-iT“(Life Technologies). Regression accuracy is displayed during measurement (R2 value). A) Beginning of measurement of the standard curve. B) Table format display of the standard curve. C) Graphic plot of the standard curve.
First linear regression is used for analyzing the standard curve; subsequently quadratic regression is also used for the analysis. By using the “curve fit” option available in the Eppendorf BioSpectrometer fluorescence, the regression analysis can be adjusted during the generation of the standard curve. The available regression options include, “linear regression”, “spline interpolation”, “linear interpolation”, “cubic regression” and “quadratic regression”.
Results and Discussion
The first step is to assess the accuracy of the standard curves for both the kits. Both linear and quadratic regression were performed for curve analysis. The relative fluorescence limits (RFU) that were measured for the RNA standards from the Life Technologies kit are shown in Table 3, and the relative curves are shown in Figure 8.
Table 3. RNA standard curves Life Technologies
|
Concentration (ng/mL)
|
0
|
20
|
100
|
500
|
1000
|
|
-
|
0.29
|
1.93
|
8.60
|
44.85
|
92.88
|
|
-
|
0.33
|
1.96
|
8.76
|
44,07
|
93.05
|
|
RFU
|
0.38
|
1.95
|
8.87
|
45.48
|
95.52
|
|
Average (RFU)
|
0.33
|
1.94
|
8.74
|
44.80
|
93.82
|
|
SD (RFU)
|
0.05
|
0.01
|
0.14
|
0.71
|
1.48
|
|
CV (%)
|
/
|
0.75
|
1.60
|
1.58
|
1.58
|
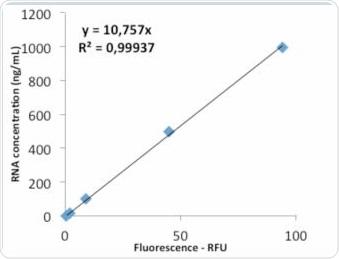
Figure 8a. Standard curve “Life Technologies” – evaluation via linear regression.
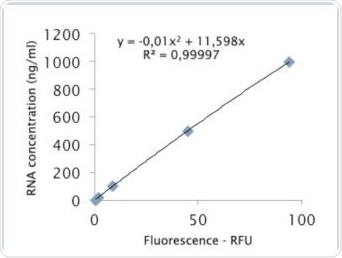
Figure 8b. Analysis via quadratic regression.
The value of R2 shown in Figure 8a clarifies that the standard curve follows linear regression. The quadratic regression depicted in Figure 8b shows a marginally improved agreement. Further tests were performed to examine whether the quadratic regression would enable more accurate sample determination. As seen in Table 2, the RNA samples were analyzed by both linear as well as quadratic regression, and the corresponding deviations from the expected value were compared. Tables 4a and 4b show the results of these comparisons.
Table 4a. Analysis of the RNA samples via linear regression – Life Technologies
|
Nominal concentration (ng/mL)
|
20
|
40
|
200
|
400
|
800
|
1000
|
|
Calculated concentration (ng/mL)
|
21
|
41
|
194
|
395
|
806
|
1011
|
|
22
|
43
|
193
|
397
|
800
|
992
|
|
22
|
40
|
192
|
390
|
803
|
982
|
|
Average
|
22
|
41
|
193
|
394
|
803
|
995
|
|
SD
|
0
|
1
|
1
|
3
|
3
|
15
|
|
CV (%)
|
1.89
|
3.01
|
0.68
|
0.87
|
0.35
|
1.49
|
Table 4b. Analysis of the RNA samples vial quadratic regression – Life Technologies
|
Nominal concentration (ng/mL)
|
20
|
40
|
200
|
400
|
800
|
1000
|
|
Calculated concentration (ng/mL)
|
23
|
44
|
206
|
413
|
813
|
1002
|
|
24
|
46
|
205
|
414
|
808
|
984
|
|
24
|
43
|
203
|
408
|
810
|
975
|
|
Average
|
24
|
45
|
205
|
412
|
810
|
987
|
|
SD
|
0
|
1
|
1
|
3
|
3
|
13
|
|
CV (%)
|
1.88
|
3.00
|
0.67
|
0.84
|
0.32
|
1.36
|
As per these tables, the results acquired with both the regression analyses were similar. The values acquired by linear regression for low concentrations, ranging from 20 to 40ng/mL, were near the nominal values. The concentrations that were calculated using both the methods are shown in Table 5. The deviation of the measured values from the respective nominal values is shown in terms of percentage.
Table 5. Deviation of target concentration from nominal concentration – Life Technologies
|
Nominal concentration [ng/mL]
|
Measured concentration – linear regression [ng/mL]
|
Deviation [%]
|
Measured concentration – quadratic regression [ng/mL]
|
Deviation [%]
|
|
20
|
22
|
10
|
24
|
20
|
|
40
|
41
|
2.5
|
45
|
12.5
|
|
200
|
193
|
3.5
|
205
|
2.5
|
|
400
|
394
|
1.5
|
412
|
3
|
|
800
|
803
|
0.4
|
810
|
1.3
|
|
1000
|
995
|
0.5
|
987
|
1.3
|
The Promega RNA kit QuantiFluor™ was also used for measuring RNA concentrations that are listed in Table 2. The corresponding results acquired for the RNA standards given by the kit are shown in Table 6. As with the results from the Life Technologies kit, individual repetitions were in good agreement. Figures 9a and 9b represent the graphs obtained from linear and quadratic regression, respectively. It was observed that in the quadratic regression analysis on the Promega kit, the standard curve showed substantially higher precision (R2), than the linear regression analysis.
Table 6. RNA standard curve Promega
|
Concentration (ng/mL)
|
0
|
39
|
78
|
156
|
313
|
625
|
1250
|
2500
|
|
RFU
|
0.83
|
1.54
|
2.48
|
4.59
|
10.08
|
21.97
|
47.21
|
107.47
|
|
0.85
|
1.55
|
2.62
|
4.66
|
9.99
|
20.64
|
48.24
|
104.32
|
|
0.78
|
1.55
|
2.52
|
4.77
|
10.13
|
22.35
|
47.83
|
101.13
|
|
Average
|
0.82
|
1.55
|
2.54
|
4.67
|
10.07
|
21.65
|
47.76
|
104.31
|
|
SD (RFU)
|
0.04
|
0.01
|
0.07
|
0.09
|
0.07
|
0.90
|
0.52
|
3.17
|
|
CV (%)
|
/
|
0.36
|
2.89
|
1.96
|
0.73
|
4.16
|
1.09
|
3.04
|
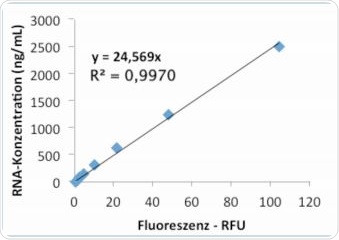
Figure 9a. Standard curve “Promega” – evaluation via linear regression.
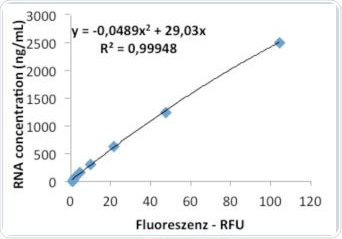
9b. Evaluation via quadratic regression.
Further evaluations were conducted to verify whether a change in the regression of the standard curve could result in enhanced precision during analysis. The analysis results of linear and quadratic regression are shown in Tables 7a and 7b, respectively.
Table 7a. Analysis of the RNA samples via linear regression – Promega
|
Nominal concentration (ng/mL)
|
20
|
40
|
200
|
400
|
800
|
1000
|
|
Calculated concentration (ng/mL)
|
28
|
41
|
153
|
328
|
723
|
914
|
|
-
|
29
|
41
|
157
|
324
|
703
|
933
|
|
-
|
29
|
39
|
158
|
337
|
720
|
925
|
|
Average
|
29
|
40
|
156
|
330
|
715
|
924
|
|
SD
|
1
|
1
|
3
|
6
|
11
|
10
|
|
CV (%)
|
3.42
|
3.04
|
1.80
|
1.94
|
1.51
|
1.06
|
Table 7b: Analysis of the RNA samples via quadratic regression – Promega
|
Nominal concentration (ng/mL)
|
20
|
40
|
200
|
400
|
800
|
1000
|
|
Calculated concentration (ng/mL)
|
33
|
49
|
181
|
383
|
820
|
1022
|
|
-
|
35
|
49
|
186
|
378
|
798
|
1043
|
|
-
|
35
|
46
|
187
|
392
|
816
|
1034
|
|
Average
|
34
|
48
|
184
|
384
|
812
|
1033
|
|
SD
|
1
|
1
|
3
|
7
|
12
|
10
|
|
CV (%)
|
3.42
|
3.03
|
1.78
|
1.90
|
1.43
|
0.99
|
It was seen from these tables that the quadratic regression analysis using the BioSpectrometer fluorescence for the Promega kit yielded more accurate results. However, the concentration values measured between the lower concentration ranges – from 20 to 40ng/mL, were nearer to the nominal value in case of linear regression analysis. Nevertheless, the quadratic regression provided more accurate values across the entire concentration range, which exceeded 1000ng/mL. The summary of the measured RNA concentrations through both analysis methods, and the corresponding percentage deviation from nominal value are listed down in Table 8.
Table 8. Deviation of target concentration from nominal concentration – Promega Kit
|
Nominal concentration [ng/mL]
|
Measured concentration – linear regression [ng/mL]
|
Deviation [%]
|
Measured concentration – quadratic regression [ng/mL]
|
Deviation [%]
|
|
20
|
29
|
45
|
33
|
65
|
|
40
|
40
|
0
|
49
|
22.5
|
|
200
|
156
|
22
|
184
|
8
|
|
400
|
330
|
17.5
|
384
|
4
|
|
800
|
715
|
10.6
|
812
|
1.5
|
|
1000
|
924
|
7.6
|
1033
|
3.3
|
The sample replicates are in agreement with the Promega kit; hence, sample measurement needs to be optimized at the analysis stage instead of at the sample preparation stage.
Conclusions
Evaluation of Results
The Eppendorf BioSpectrometer fluorescence is compatible with the RNA detection kits from Life Technologies and Promega. Based on the sample analyses conducted on the Life Technologies kit, it may be concluded that standard curve can be produced by both quadratic and linear regression. In case of the Promega RNA kit, the analysis results of the linear regression or the standard curve exhibited substantial deviation from the nominal value.
The ability of the Eppendorf BioSpectrometer in modifying the regression analysis with respect to the curve, so that the actual shape of the standard curve is accurately obtained, is demonstrated by the observation detailed above. In addition to this observation, it was also seen that the Life Technologies kit exhibited better precision between the concentration ranges of 20-40ng/mL, than the Promega kit. The summary of the RNA quantification performed by these kits is provided in Table 9. The results acquired through quadratic regression are provided by corresponding examples for both kits.
Table 9. Evaluation of RNA samples via Quant-iT™ and QuantiFluor RNA determination kits (standard analysis via quadratic regression)
|
Nominal concentration [ng/mL]
|
Measured concentration – Life Technologies [ng/mL]
|
Deviation [%]
|
Measured concentration – Promega [ng/mL]
|
Deviation [%]
|
|
20
|
24
|
20
|
33
|
65
|
|
40
|
45
|
12
|
5 49
|
22.5
|
|
200
|
205
|
2.5
|
184
|
8
|
|
400
|
412
|
3
|
384
|
4
|
|
800
|
810
|
1.3
|
812
|
1.5
|
|
1000
|
987
|
1.3
|
1033
|
3.3
|
Operation on the Eppendorf BioSpectrometer fluorescence
Due to fewer standards present in the Life Technologies, programming the BioSpectrometer fluorescence is quicker. Furthermore, fewer standards are required for sufficient sample evaluation. It has been demonstrated earlier for the fluorimetric determination of dsDNA by Life Technologies that the number of standards may be reduced to two. In order to avoid the large deviations in measurements caused by the photobleaching effect that occurs due to prolonged exposure of samples to light, the standards and samples should be exposed to light for as little time as possible.
The use of amber tubes during sample and standard preparation may minimize the effects of photobleaching. The Eppendorf BioSpectrometer fluorescence not only offers a choice of various regression analyses for standard curves, but also enables the pre-programming of the corresponding measurement parameters for each analysis method. Based on this advantage, the sample concentrations can be converted and displayed directly as per the programmed standard curve. Moreover, the Eppendorf BioSpectrometer fluorescence also functions as a UV-VIS spectrometer, enabling the photometric verification of the stock solution and all other measurements on a single instrument.
Reduction of Measurement Volume
There was a significant reduction in the volume of samples and standards (100µL) required for measurement by using UVette, enabling as many as 4000 measurements to be recorded for both kits. For the Quant-iT kit and the QuantiFluor assay, the standard number of measurements was 200 and 400 respectively. The volume requirements of the reagents are brought down considerably by integrating the Eppendorf BioSpectrometer and the UVette, thus enabling significant reduction in costs, compared to using standard cuvettes.
Acknowledgements
Produced from materials authored by Martin Armbrecht1 and Sandrine Hamels2 from:
1Eppendorf AG, Hamburg, Germany.
2Eppendorf Application Technologies, Namur, Belgium.
References
- Gallagher, Sean R. (2001), Quantification of DNA and RNA with Absorption and Fluorescence Spectroscopy, Current Protocols in Cell Biology, Appendix 3D
- Armbrecht M, Gloe J, Goemann W (2013) – Determination of nucleic acid concentrations using fluorescent dyes in the Eppendorf BioSpectrometer® fluorescence, Eppendorf Application Note 271
About Eppendorf NA
Eppendorf NA, with headquarters in New York, are a subsidiary of Eppendorf AG (Hamburg, Germany) – manufacturer of laboratory instruments and consumables for the life sciences.
To make it easy for labs in the United States to benefit from Eppendorf quality, they provide total customer support and service: taking/tracking orders; product installation and training; application support; calibration services; general product maintenance and repair, and more!
Eppendorf's products
Eppendorf products are used in all types of life science research and testing settings – from basic laboratory applications to highly specialized cell and molecular biology applications. They are highly regarded for their quality design and performance – beginning with extensive research and development, adding state-of-the-art technology and ending with strict quality-controlled manufacturing are what make their products stand out from the rest. It is what has made them a brand you have been able to rely on for over 70 years.
Over the years Eppendorf has improved upon and added to their flagship products – pipettes and pipette tips, centrifuges and microcentrifuge tubes – to now include the most ergonomic liquid handling devices and automated pipetting stations, quiet centrifuges, fast and fully flexible thermal cyclers, sample-protecting deepwell plates, cell manipulation systems and microcapillaries, ultra-low temperature freezers, shakers, incubators and bioprocessing equipment.
Eppendorf's services
Customer Support Representatives are available M–F, 8:30 AM – 8:00 PM (EST).
Local Sales Representatives cover the entire US to give you the fastest best possible attention. They know their products – and better yet, they know your applications. Feel confident in their abilities to assess your needs and determine the best products and systems to give you the best results.
Field Specialists also cover the entire US to provide post-sales installation and training on their specialty systems and automation.
The Applications Hotline is manned by degreed scientists working in their own fully functional life science laboratory. They are on call and email-accessible to help you troubleshoot your application or answer any technical question you may have. The Eppendorf Services group provides a wide variety of support services such as pipette calibration, instrument maintenance programs, and expedited repair.
Sponsored Content Policy: News-Medical.net publishes articles and related content that may be derived from sources where we have existing commercial relationships, provided such content adds value to the core editorial ethos of News-Medical.Net which is to educate and inform site visitors interested in medical research, science, medical devices and treatments.