Key Issues
- Non-destructive, non-invasive measurement of food oil and fat unsaturation
- Raman-predicted unsaturation levels agree with off-line iodine value measurements
- In-line capability allows for real-time process control
Introduction
In today’s food industry, knowing the degree of unsaturation and relative amounts of cis and trans isomerization in edible fats and oils is vital. This is necessary for both quality and process control and is required for nutritional information in food labeling.
Total oil and fat unsaturation is shown as the Iodine Value (IV). Currently, the IV is verified by titration or chromatographic techniques. These approaches are only utilized in the laboratory for offline analysis due to their need for extensive sample preparation and the lengthy amount of time taken to conduct the measurements. However, there is an increasing requirement for online process control and monitoring and.
Raman spectroscopy is a technique for laboratory or process measurements in fats and oils.1,2 This article shows that this analysis can be performed with dispersive Raman instrumentation developed for process control.
Experimental
A Kaiser Raman analyzer, working at 532 nm, was utilized to gather the Raman data. Dependent upon the sample, signal was collected for 60-300 s.
Determination of total unsaturation
Figure 1 illustrates the Raman spectra of butter, vegetable oil, margarine and vegetable shortening between 1150 and 1775 cm–1. Total unsaturation can be found quantitatively by measuring the ratio of the C=C stretch (vC=C) centered at 1661 cm–1 to the CH2 scissoring deformation (δCH2) at 1444 cm–1.1–3 Calculating band intensity ratios is a direct approach to quantifying total unsaturation. Visually inspecting the spectra offers a fast initial understanding of lipid saturation. The position and width of the band at ~1444 cm-1 and ~1661 cm-1 will shift to a lower Raman shift and become narrower as saturation rises.
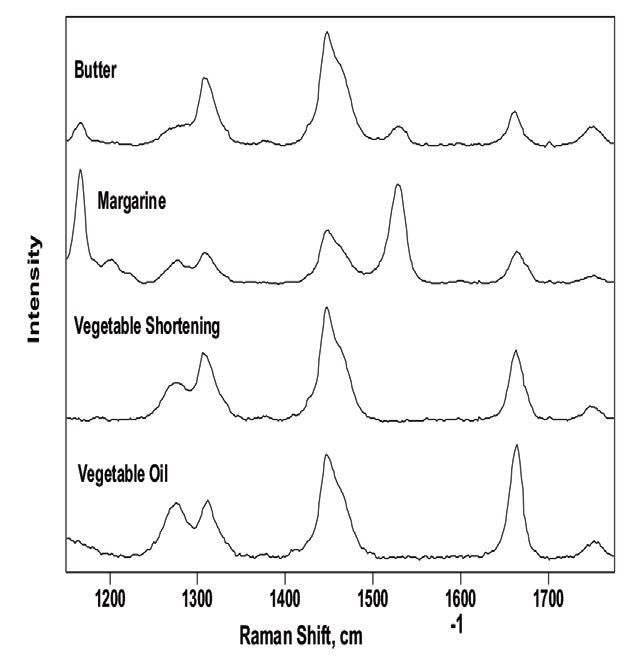
Figure 1. Background-corrected Raman spectra of commercial food oils and fats. The bands at 1165 and 1525 cm–1 of the butter and margarine spectra are attributed to the coloring agent ß-carotene. Image Credit: Kaiser Optical Systems, Inc.
Cis isomer content
It is also possible to verify Cis isomer content from the Raman spectrum. The band at 1272 cm–1 is attributed to in-plane =C–H deformation in an unconjugated cis double bond. The intensity of this band ratioed to the in-phase methylene twisting vibration at 1306 cm–1 offers a direct cis isomer measurement. This is shown by making a comparison of the Raman spectrum of vegetable oil to that of partially hydrogenated vegetable shortening. Hydrogenation leads to a favorable reduction in the cis/ trans isomer ratio.3 Figure 1 shows unhydrogenated vegetable oil containing notably more cis isomer character than partially hydrogenated vegetable shortening.
Background correction in highly fluorescent samples
Figure 2 displays the background-corrected, full Raman spectra of and peanut and vegetable oils. The ratio of background level to the δCH2 vibration intensity is displayed in parentheses by each spectrum. The fluorescence seen from commercial samples has been credited to assorted coloring agents.123 Figure 2 shows that it is possible to easily observe the Raman spectra from these samples, even where notable background is present.
This study utilized 532 nm excitation, which provides two benefits: increased sensitivity and detector efficiency. However, there is also an increase in the fluorescence signal at 532 nm. In some samples, fluorescence at 532 nm from additives or from the material itself can overpower the Raman signal. For such samples, utilizing a longer wavelength laser either at 785 nm or 1000 nm will reduce the fluorescence.
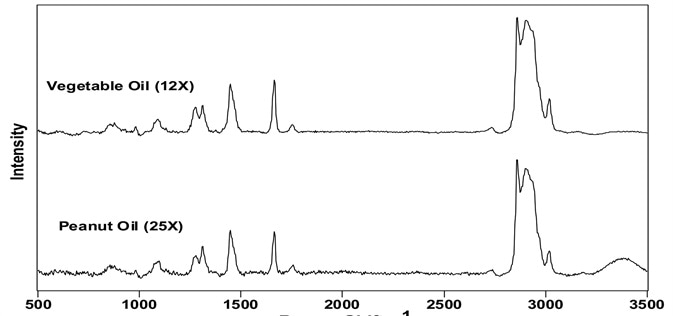
Figure 2. Background-corrected spectra of vegetable and peanut oils. The number in parenthesis indicates the background-corrected intensity of the 1444 cm-1 band. Image Credit: Kaiser Optical Systems, Inc.
Conclusion
The high-throughput Kaiser Raman analyzer enables low laser powers to be used and limited exposure times for remote Raman measurements. It is ideally suited to applications outside the laboratory environment due to its robust construction and compatibility with fiber optic sampling probes. This technique is also ideal for on-line determination of total unsaturation and cis isomer level in commercial fat and oil samples.
References
- Lee, H.; et.al. Prediction of Crude Protein and Oil Content of Soybeans Using Raman Spectroscopy. Sensors and Actuators B: Chemical 2013, 185, 694–700.
- Jiménez-Sanchidrián, C.; Ruiz, J. R. Use of Raman Spectroscopy for Analyzing Edible Vegetable Oils. Applied Spectroscopy Reviews 2016, 51 (5), 417–430.
- Dymińska, L.; et.al. Quantitative Determination of the Iodine Values of Unsaturated Plant Oils Using Infrared and Raman Spectroscopy Methods. International Journal of Food Properties 2017, 20 (9), 2003–2015
About Kaiser Optical Systems, Inc.
Kaiser Optical Systems, Inc. (Kaiser), an Endress+Hauser company, is the global leader in Raman spectroscopic instrumentation for laboratory, process, and manufacturing environments. Our solutions harness the powerful analytical information of Raman Spectroscopy to help our customers understand, measure, and control their chemistries.
As a trusted partner in Raman for over 30 years, Kaiser has a long history in production, including GMP manufacturing, with many proven successes. Our unmatched expertise, high quality solutions, and exceptional customer service sets Kaiser far above any other Raman option in the marketplace. Kaiser Raman technology is currently used throughout the chemical, food and beverage, oil and gas, pharmaceutical, and biopharmaceutical industries to optimize process efficiency and deliver quality products. Kaiser’s manufacturing and headquarters facility is in Ann Arbor, Michigan.
Sponsored Content Policy: News-Medical.net publishes articles and related content that may be derived from sources where we have existing commercial relationships, provided such content adds value to the core editorial ethos of News-Medical.Net which is to educate and inform site visitors interested in medical research, science, medical devices and treatments.