Key issues
- Specific and quantitative process knowledge in accordance with the U.S. FDA Process Analytical Technology (PAT) initiative
- Process conditions affect protein crystal structure
- Quick optimization of protein crystallization conditions
- Raman non-destructively measures protein crystal formation
Introduction
Optimizing the conditions in which crystallization takes place helps to guarantee good quality products. Using real-time, in-process analysis of the crystallization process can confirm crystal form and identify any impurities.
Raman spectroscopy is a popular and proven method of analysis when studying crystallization. This is due to the fact that it is non-destructive and can measure both chemical composition and molecular structure in samples. Using online Raman is an efficient way of quickly understanding how conditions such as temperature, pH, agitation rate, or solvent, influence the process of crystallization.
The aim of the investigation detailed in this article was to demonstrate the efficacy of Raman spectroscopy as a method to enhance the understanding of the crystallization process, using lysozyme as a model protein.
In-situ Raman spectroscopy was utilized to investigate how temperature, concentration of precipitating agent, time of crystallization, and possible interactions between these factors, influenced the process.
Raman advantages
The Raman spectrum of proteins contains spectral contributions from the protein backbone and side chains. The amide III envelope at ~1240 cm-1 and the amide I envelope at ~ 1650 cm-1 give information on the higher order structure, including the presence of α-helix, β-sheet, or random coil.
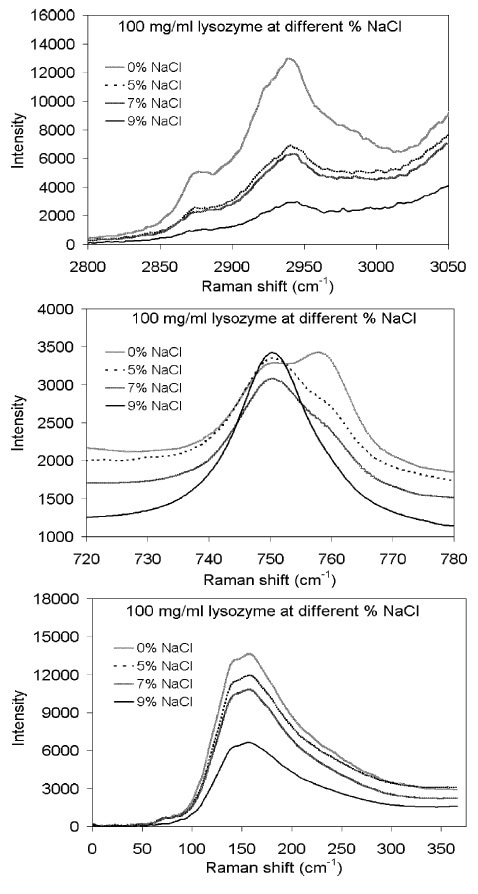
Citing an example by Mercado et al., bands at 750, 760 and 2950 cm-1 yielded useful protein structure information, which reported on the chemical environment of tryptophan (750, 760 cm-1) and CH3 groups in aliphatic residues (2940 cm-1).1
Intensities of these bands, and the 760:750-cm-1 band area ratio, were sensitive to the effects of NaCl concentration, temperature, and time on lysozyme crystallization.
This article details the results of a study that reports the use of Raman spectroscopy in a Quality by Design (QbD) approach to optimize a protein crystallization process. Lysozyme was chosen as a model protein as its crystallization has been widely studied, which ensured that validation of the process monitoring approach was easy to carry out.
Experimental
A D-optimal experimental design was used. This had foundation in three factors: concentration of precipitating agent (NaCl), temperature, and time. A Kaiser Raman analyzer monitored the process. Each sample was kept at a temperature of 15 to 45 °C for a period of 9 hours. Spectra were collected in 20, 10-second exposures with a period of 10 minutes thermal equilibrium in between each exposure. The spectra of solid lysozyme were gathered with a 10× non-contact optic, and the spectra from the aqueous solution were gathered with a ¼ inch immersion probe.
Results
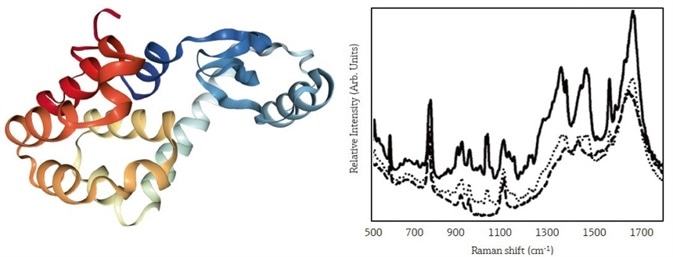
Figure 1 illustrates the effect of the variety of acetate concentrations on the Raman spectrum of lysozyme.

Figure 1. The structure of lysozyme (left) is affected by crystallization conditions. The Raman spectrum of lysozyme (right) measures protein structure changes. Reprinted with permission from Reference 1. © 2008 Springer. Image Credit: Kaiser Optical Systems, Inc.
Acetate concentrations were:
- 90 mg/mL (solid line)
- 30 mg/mL (dotted line)
- 0 mg/mL (dashed line)
Additionally, peaks that were useful for quantitative analysis can be seen at 2940, 760, 750, and 155 cm–1.
Figure 2 illustrates the relationship of lysozyme concentration in solution against the concentration of NaCl as a precipitating agent. The lysozyme bands at 150 and 2940 cm–1 vary in direct correlation with NaCl concentration. However, the shape of the overlapping 750- and 760- cm–1 region is more complex, showing that one decreases when the other increases. The 2940-cm–1 band proved to be the most useful for quantitative process monitoring, but the 760/750-cm–1 ratio also showed high levels of validity.

Figure 2. The Raman spectrum of lysozyme changes upon addition of sodium chloride salt, indicating increased protein crystallization. Reprinted with permission from Reference 1. © 2008 Springer. Image Credit: Kaiser Optical Systems, Inc.
Conclusions
This study produced results demonstrating that Raman spectroscopy generates rich, quantitative process knowledge, which facilitates the rapid, multivariate monitoring of a protein crystallization process. It also shows that Raman spectroscopy possesses strong potential for the real-time control of a scaled-up process.
In order to extend this technique to find application in the biopharmaceutical laboratory or process development environments, Kaiser’s Raman Rxn2™ analyzer platform can be used. In manufacturing environments, the same can be achieved with Kaiser’s Raman Rxn4™ analyzer platform.
References
- Mercado, J. et al. “Design and In-Line Raman Spectroscopic Monitoring of a Protein Batch Crystallization Process.” J. Pharma. Innov. 2008; 271–279.
About Kaiser Optical Systems, Inc.
Kaiser Optical Systems, Inc. (Kaiser), an Endress+Hauser company, is the global leader in Raman spectroscopic instrumentation for laboratory, process, and manufacturing environments. Our solutions harness the powerful analytical information of Raman Spectroscopy to help our customers understand, measure, and control their chemistries.
As a trusted partner in Raman for over 30 years, Kaiser has a long history in production, including GMP manufacturing, with many proven successes. Our unmatched expertise, high quality solutions, and exceptional customer service sets Kaiser far above any other Raman option in the marketplace. Kaiser Raman technology is currently used throughout the chemical, food and beverage, oil and gas, pharmaceutical, and biopharmaceutical industries to optimize process efficiency and deliver quality products. Kaiser’s manufacturing and headquarters facility is in Ann Arbor, Michigan.
Sponsored Content Policy: News-Medical.net publishes articles and related content that may be derived from sources where we have existing commercial relationships, provided such content adds value to the core editorial ethos of News-Medical.Net which is to educate and inform site visitors interested in medical research, science, medical devices and treatments.