Sponsored Content by DeNovix Inc.Reviewed by Louis CastelSep 1 2022
To evaluate the purity of nucleic acid and protein samples, molecular scientists frequently compare the recorded spectrophotometric absorbance of a sample at 260 nm to the value measured at 280 nm.
Before employing samples in time-consuming or costly downstream applications, many scientists also consider the ratio of the absorbance values at 230 nm and 260 nm as an important additional measure of purity.
Figures 1 and 2 illustrate a nucleic acid sample and a protein sample as detected on a DeNovix DS-11 Spectrophotometer:
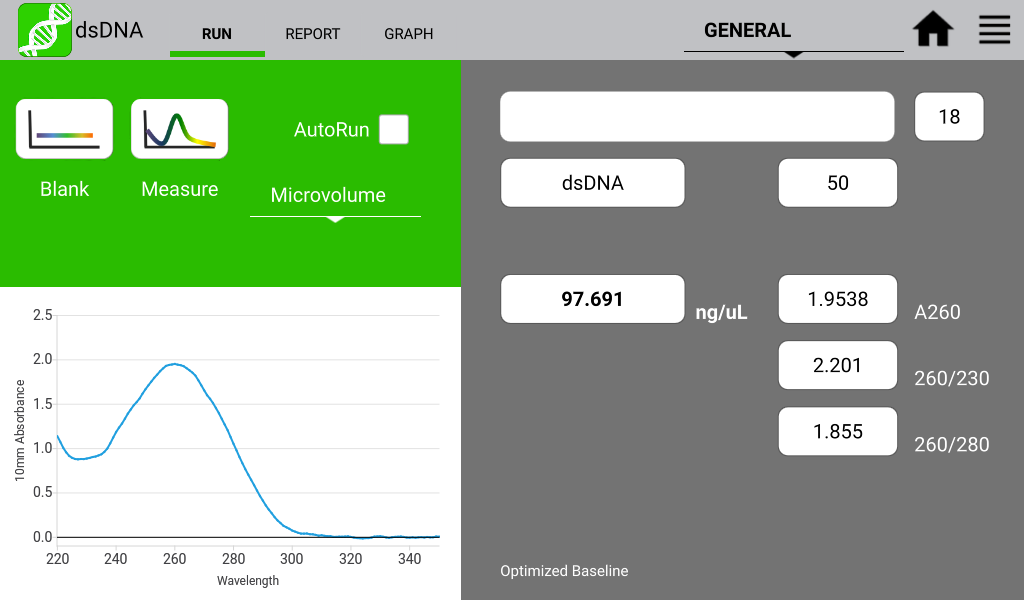
Figure 1. Typical dsDNA spectrum. Image Credit: DeNovix Inc.
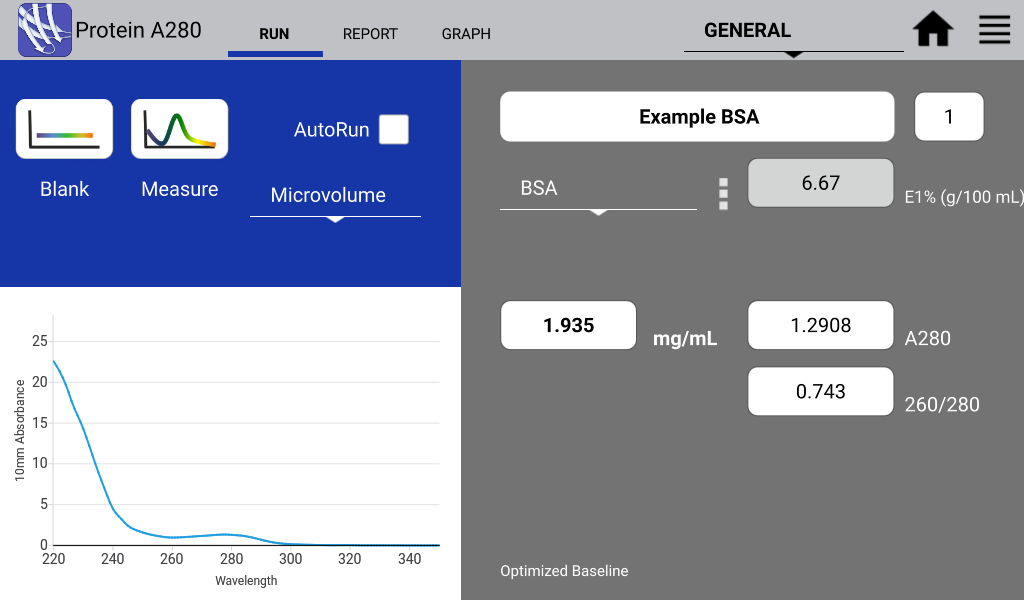
Figure 2. Typical BSA spectrum. Image Credit: DeNovix Inc.
260/280 Nucleic acid purity ratios
It is common to practice utilizing 260/280 ratios to assess the accuracy of nucleic acid tests. The most common application of this ratio is to indicate the existence of phenol and/or protein in an isolated nucleic acid sample. These ratios fall within the generally acceptable range shown in Table 1, although they do not ensure sample purity.
Table 1. Acceptable Range for 260/280 Ratios. Source: DeNovix Inc.
| Sample Type |
Ideal |
High |
Low |
| DNA |
~1.8 |
>2.0 |
<1.7 |
| RNA |
~2.0 |
>2.2 |
<1.9 |
| Possible contamination |
|
Basic |
Acidic Phenol or Protein |
260/230 Nucleic acid purity ratios
The presence of unwanted chemical compounds, including Trizol, phenol, Guanidine HCL, and Guanidine Thiocyanate, is indicated by the 260/230 ratio.
In general, 260/230 ratios between 2.0 and 2.2 are considered appropriate. Values above this can be a sign of contamination with the aforementioned substances.
Protein 260/280 purity ratio
A common contamination found in whole cell lysates is DNA. The 260/280 ratio can be used to gauge the purity of an isolated protein when evaluating purified proteins. For typical proteins, a 260/280 ratio of 0.6 is appropriate. Higher ratios can be a sign that DNA has contaminated isolated proteins.
Note: When working with buffers that have UV region absorbance, colorimetric spectrophotometric techniques like the BCA or Bradford tests are typically advised.
Troubleshooting purity ratios
Below is a list of the three most typical reasons for aberrant 260/280 ratios:
- Sample contamination from residual guanidine, phenol, and other isolation process reagents. A frequent contaminant in nucleic acid isolations from plant sources is carbohydrates.
- Concentrations are extremely close to the minimum detection limit, or samples are considerably diluted. For nucleic acid samples with concentrations less than 10 ng/µl, ratios may not be an accurate measure of purity.
- The Blank measurement solution was incorrect. The pH and ionic strength of the Blank solution should be comparable to those of the sample solution. Low 260/230 ratios could be the result of using water as the Blank measurement for samples suspended in TE.
Microvolume vs. cuvette
It has been stated that small changes in a solution’s pH can cause variations in nucleic acid 260/280 ratios.1 Acidic solutions may underestimate the 260/280 ratio value by 0.2–0.3, whereas basic solutions may overestimate the ratio value by 0.2–0.3. When comparing ratios for samples measured on the microvolume mode and then diluted for measurement with a cuvette, make sure the undiluted and diluted samples have the same ionic strength and pH.
Variance from other instrument brands
When assessing the same sample on diferent spectrophotometers, it is not uncommon to see small variations in purity ratios. When evaluating the same nucleic acid sample on two spectrophotometers with a 1 nm wavelength accuracy standard, a difference in the 260/280 ratio of up to about 0.4 can be observed.
The absorbance of nucleic acid at 260 nm is typically measured on a plateau region of the spectrum, whereas the absorbance at 280 nm is typically measured on a steeply sloped portion of the spectral curve. Since one value is measured on a plateau and another on a slope, a small shift in wavelength accuracy has a large effect on 260/280 ratios.
The DS-11 Series has a wavelength accuracy of 0.5 nm. Larger wavelength precision features limit the ability of instruments to accurately report 260/280 ratios.
Summary
The ratio limits displayed in this article are ideal values that are widely accepted. The ratio limits that anticipate sample functionality in the user’s downstream applications must be empirically determined.
The DS-11 Series EasyApps software generates automatic alerts when samples exceed these standards, or custom thresholds can be set.
DS 11 Series | Spectrophotometer | Fluorometer
References
- William W. Wilfinger, Karol Mackey, and Piotr Chomczynski, Effect of pH and Ionic Strength on the Spectrophotometric Assessment of Nucleic Acid Purity: BioTechniques 22:474-481 (March 1997).
About DeNovix, Inc.
WELCOME TO DENOVIX
Award-Winning products for Life Science
Our multi-award winning products include the Reviewers’ Choice Life Science Product of the Year and Platinum Seal awarded- DS-11 Series Spectrophotometer / Fluorometer and CellDrop™ Automated Cell Counter. CellDrop is the first instrument of its kind to Count Cells Without Slides. These powerful instruments integrate patented DeNovix technology with easy-to-use software designed by life scientists for life scientists.
Researchers tell us they love the industry leading performance, smart-phone-like operation, and the flexible connectivity of the instruments. When support is needed, the DeNovix team is here to help. DeNovix received the prestigious Life Sciences Customer Service of the Year based on independent reviews posted by scientists worldwide!
CellDrop: Sustainable laboratory product of the year
The CellDrop Automated Cell Counter has been awarded Sustainable Laboratory Product of the Year in the SelectScience® Scientists’ Choice Awards®!
CellDrop’s patented DirectPipette™ technology distinguishes it as the only cell counter to eliminate the need for cell counting slides. This innovation saves millions of single-use plastic slides from use and disposal each year.
Sponsored Content Policy: News-Medical.net publishes articles and related content that may be derived from sources where we have existing commercial relationships, provided such content adds value to the core editorial ethos of News-Medical.Net which is to educate and inform site visitors interested in medical research, science, medical devices and treatments.