Computational Drug Target Prioritization for Reversing the Pro-inflammatory Phenotype in Human iPSC-derived Reactive Astrocytes
Astrocytes, the predominant glial population in the human central nervous system, play crucial roles in neuroprotection, immunity, and homeostasis. However, when exposed to certain neuroinflammatory cues, astrocytes adopt a pro-inflammatory, neurotoxic phenotype. Neurotoxic astrocytes contribute to chronic neuroinflammation, a major driver of a variety of neurodegenerative diseases.
By identifying and targeting the signalling pathways that drive neurotoxic astrocyte formation, new therapeutic methods can be developed to curb neurodegeneration. This study aims to identify novel therapeutic targets in human astrocytes and to predict and evaluate candidate compounds with the potential to inhibit or reverse the pro-inflammatory, neurotoxic phenotype.
Methods
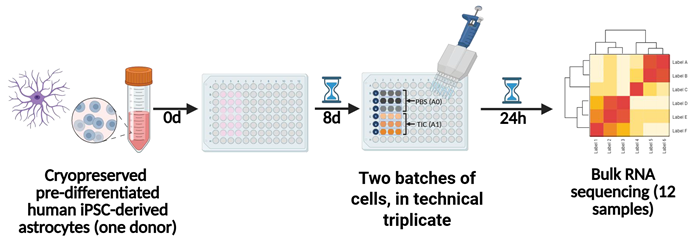
Figure 1. Generation of astrocyte RNAseq data. Human iPSC-derived astrocytes (hereafter referred to as astrocytes) were thawed, plated into 96-well plates and cultured for 8 days. For bulk RNA sequencing (RNA-seq), cells from two different batches were stimulated with the proinflammatory “TIC” cytokine cocktail (TNFα, IL-1α and C1q) or PBS for 24 hours. Cells were lysed and RNA extracted in triplicate. RNA-seq libraries were generated using the Roche KAPA mRNA HyperPrep kit and data was analyzed using DESeq2. Image Credit: Concept Life Sciences
Astrocyte RNAseq data generation is presented in Figure 1. Human iPSC-derived astrocytes (referred to hereafter as astrocytes) were thawed, plated into 96-well plates, and cultured for eight days.
For bulk RNA sequencing (RNA-seq), cells from two distinct batches were stimulated for 24 hours with either a proinflammatory “TIC” cytokine cocktail (TNFα, IL-1α and C1q) or PBS.
Cells were lysed, RNA was extracted in triplicate, and RNA-seq libraries were generated using the Roche KAPA mRNA HyperPrep kit. DESeq2 was used for data analysis.
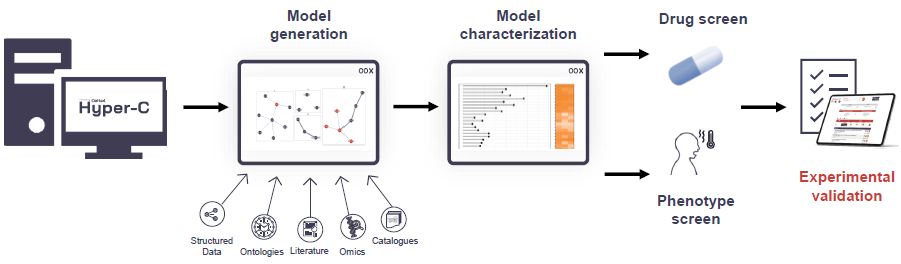
Figure 2. Model generation and evaluation. The astrocyte model is generated by combining multiple data sources within the Delta4 knowledge graph (KG) Hyper-C. All gene-cell associations from genes to astrocytes and gene-mechanism associations to core concepts such as ‘astrocyte activation’ and ‘neuroinflammation’ build the core of the model (275 genes), which are enriched by single-cell astrocyte-specific expressed genes with Tau scores > 0.9 from the Human Protein Atlas (HPA) (51 genes), differentially expressed genes as described above with strong connections to the core of the model via the Hyper-C PPI network (156 genes) as well as relevant genes for neurotoxic and neuroprotective subsets of the astrocyte model from selected reviews (97 genes) (Cameron et al., 38086421; Escartin et al., 33589835; Lawrence et al., 36915214). Image Credit: Concept Life Sciences
In Figure 2, a model generation and assessment is displayed. The astrocyte model was generated by combining several data sources within the Delta4 knowledge graph (KG) Hyper-C.
The model core (275 genes) comprises all gene-cell associations from genes to astrocytes and gene-mechanism associations to core concepts, including ‘astrocyte activation’ and ‘neuroinflammation’.
The model was enriched with single-cell astrocyte-specific expressed genes with Tau scores below 0.9 from the Human Protein Atlas (HPA) (51 genes) and differentially expressed genes as detailed above.
These genes are strongly connected to the model core via the Hyper-C PPI network (156 genes) and possess relevant genes for neurotoxic and neuroprotective subsets of the astrocyte model from selected reviews (97 genes) (Cameron et al., 38086421; Escartin et al., 33589835; Lawrence et al., 36915214).
Astrocyte model
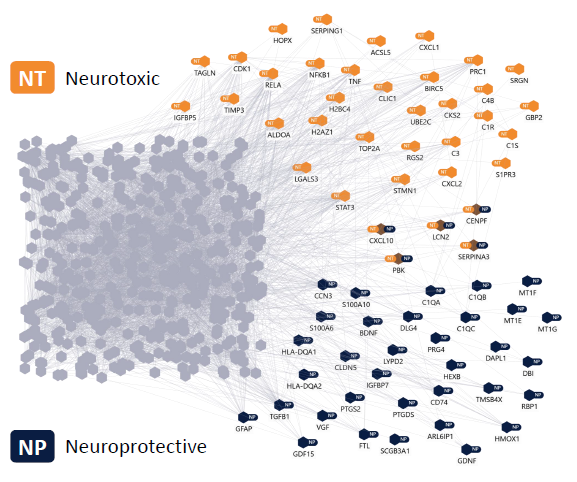
Figure 3. Astrocyte model. Astrocyte model with labelled subnetworks for neurotoxic (orange) and neuroprotective (blue) phenotypes. The model has a size of 522 genes. Edges are based on the Hyper-C PPI network. Image Credit: Concept Life Sciences
Figure 3 shows an astrocyte model containing 522 genes. Subnetworks associated with neurotoxic and neuroprotective phenotypes are highlighted in orange and blue, respectively. Edges are derived from the Hyper-C PPI network.
Mechanistic model characterization
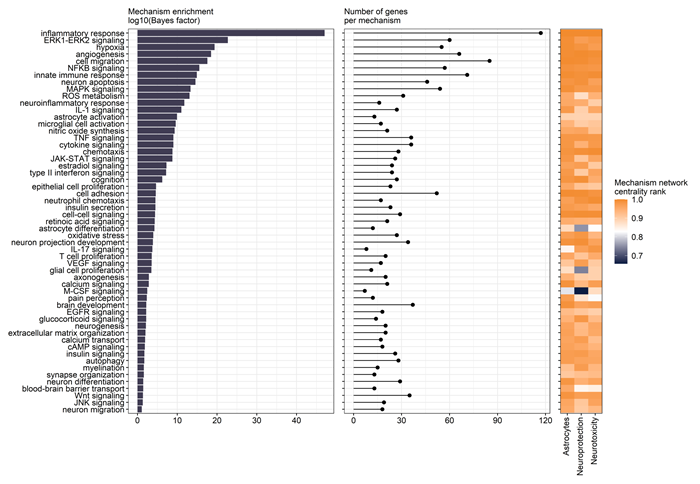
Figure 4. Mechanism enrichment. The astrocyte model, as well as the two subnetworks of neuroprotection and neurotoxicity are embedded in the Hyper-C KG together with mechanisms and their corresponding gene sets. Gene set enrichments with Hyper-C centrality ranks are calculated, integrating knowledge beyond gene sets from experimental (RNAseq) and additional data from all integrated data sources in Hyper-C (e.g. literature, ontologies, other structured data). Image Credit: Concept Life Sciences
Figure 4 represents mechanism enrichment. The astrocyte model and the two neuroprotection and neurotoxicity subnetworks are embedded in the Hyper-C KG with mechanisms and their corresponding gene sets. Gene set enrichments with Hyper-C centrality ranks were determined, incorporating knowledge beyond gene sets from both experimental (RNAseq) and additional data from Hyper-C integrated data sources (e.g. literature, ontologies, and other structured data).
Phenotype assessment
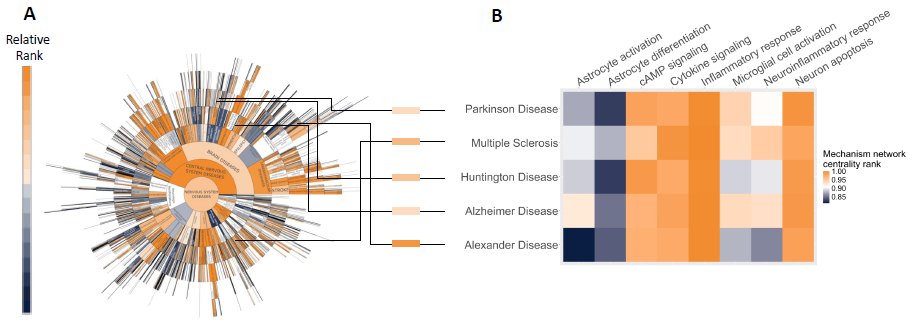
Figure 5. Mechanism centrality in selected Phenotypes. (A) Sunburst of all screened nervous system diseases indicating network interference in Hyper-C with the astrocyte model (visualized with OntoloViz, Ley et al. 2023). (B) Selected phenotypes are shown with enriched mechanisms from Figure 4 in the context of disease and astrocytes. Image Credit: Concept Life Sciences
Figure 5 is a mechanism centrality in chosen Phenotypes. A represents sunburst of all screened nervous system diseases signifying network interference in Hyper-C with the astrocyte model (visualized with OntoloViz, Ley et al. 2023). B are the chosen phenotypes displayed with enriched mechanisms from Figure 4, contextualized within astrocytes and disease.
Drug screening
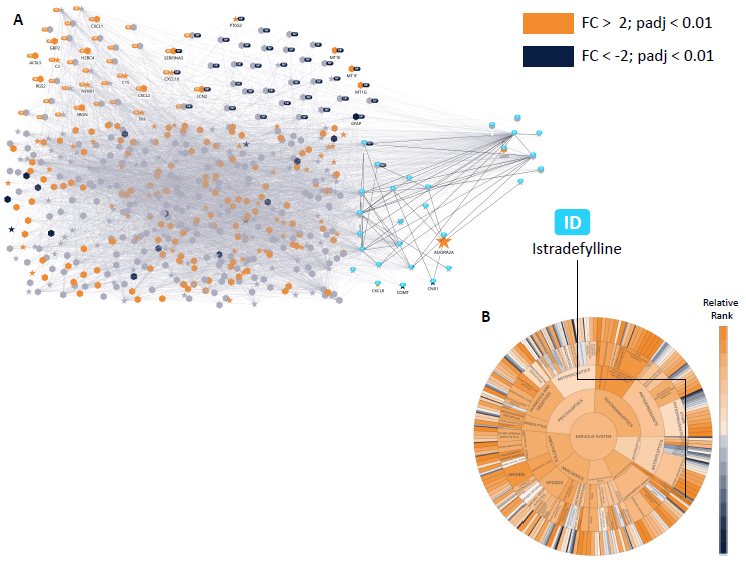
Figure 6. Astrocyte model with drug screening result. Screening the Hyper-C drug library with the astrocyte model recovered the approved drug Istradefylline for Parkinson’s Disease in the top 3 % of all drugs (> 4000). Relative ranks for drugs in the nervous system are shown in (B). All drug targets in the astrocyte model are highlighted as ‘stars’ in (A), with the drug target of Istradefylline, ADORA2A, labelled additionally. Up- and downregulation from RNAseq is shown in orange and blue respectively and gene symbols are labelled for selected nodes. ADORA2A is an upregulated receptor in reactive astrocytes, while Istradefylline is a selective antagonist of the same receptor, which is also described in the literature to regulate microglial activation in late phases of inflammation (Ogawa et al, 30026035). Drug repositioning methodology follows Perco et al. 2025. Image Credit: Concept Life Sciences
Figure 6 presents an astrocyte model with therapeutic screening results.
Screening of the Hyper-C drug library with the astrocyte model recovered the approved Parkinson’s disease drug Istradefylline in the top 3 % of all therapeutics (greater than 4000). Relative ranks of nervous system therapeutics are displayed in (B).
All therapeutic targets in the astrocyte model are indicated as ‘stars’ in (A), with additional labeling of the drug target of Istradefylline, ADORA2A. Upregulation (orange) and downregulation (blue) from RNAseq are both depicted, with gene symbols labelled for selected nodes.
ADORA2A acts as an upregulated receptor in reactive astrocytes. Istradefylline, a selective antagonist of the same receptor, has also been detailed in the literature as a regulator of microglial activation during late-stage inflammation (Ogawa et al, 30026035). Drug repositioning methodology follows Perco et al. 2025.
Conclusions
- This study presents an astrocyte model with subsequent mechanistic evaluation and drug target prioritization.
- The method successfully recovered Istradefylline, an approved Parkinson’s disease therapy with clear mechanistic interference in astrocytes, counteracting the upregulated receptor ADORA2A.
- Using this methodology, potential new therapeutics and therapeutic combinations (Fillinger L et al., 2025) can be identified with clear mechanistic interference to counteract disease phenotypes.
Acknowledgments
Produced from materials originally authored by Samuel M Walter, Tamara Modebadze, Mark Gurney, Megan Paterson, Hollie Scott, Sarah McCafferty, Kinga Keska-Izworska, Lucas Fillinger, Matthias Ley, Paul Perco, Klaus Kratochwill, Elise Malavasi. Concept Life Sciences, Edinburgh, United Kingdom, Delta4, Vienna, Austria. Equal contributors.
References and further reading
- Perco, P., et al. (2025). Computational Drug Repositioning in Cardiorenal Disease: Opportunities, Challenges, and Approaches. PROTEOMICS. https://doi.org/10.1002/pmic.202400109.
- Fillinger, L., et al. (2025). Computational modeling approaches and regulatory pathways for drug combinations. Drug Discovery Today, [online] 30(5), p.104345. https://doi.org/10.1016/j.drudis.2025.104345.
- Ley, M., et al. (2023). OntoloViz: a GUI for interactive visualization of ranked disease or drug lists using the MeSH and ATC ontologies. Bioinformatics Advances, [online] 3(1). https://doi.org/10.1093/bioadv/vbad113.
About Concept Life Sciences
Concept Life Sciences is a leading contract research organisation (CRO) serving the global life sciences industry. For over 25 years, the company, and its heritage companies, have provided consultative and collaborative drug discovery and development services. Our approach, supported by passionate scientists and world-leading capabilities, enables clients to overcome complex scientific challenges across a broad range of therapeutic areas, improving program success rates. The company has successfully helped 29 candidates advance to the clinic.
The company offers sophisticated translational biology services coupled with exceptional end-to-end chemistry capabilities across all modalities, including small molecules, biologics, peptides and cell & gene therapies, with the ability to seamlessly integrate capabilities and provide bespoke solutions to address client needs.
Collectively, the company’s high-quality services and commitment to customer service across the drug development pathway enhance efficiency in drug discovery, helping clients advance their drugs to clinic in as little as 32 months, well ahead of the industry average of 60 months.
Driven by a passion for science, Concept Life Sciences has around 230 employees, with around 70% holding PhDs. The company operates from state-of-the-art UK facilities, headquartered near Manchester, with additional operations in Edinburgh, Dundee, and Sandwich. The headquarters is one of the UK’s largest medicinal chemistry CRO sites with key discovery services all under one roof.
Sponsored Content Policy: News-Medical.net publishes articles and related content that may be derived from sources where we have existing commercial relationships, provided such content adds value to the core editorial ethos of News-Medical.Net which is to educate and inform site visitors interested in medical research, science, medical devices and treatments.