Introduction
The quantification and characterization of DNA is often regarded as a laborious process in bioscience laboratories. A number of companies are therefore offering a variety of off the-shelf products for quantifying DNA. This article outlines some of the basic products that are commonly used for the quantification and profiling of DNA.
DNA is quantified for a wide range of applications such as plasmid transfection, PCR amplification, and next generation sequencing. In order to achieve high-quality DNA measurements, it is important to ensure that the sample is not contaminated as a result of upstream reactions, as this can affect the quantification results, as well as other downstream processes such as NGS and PCR processes, for which pure DNA samples are required.
Although many users tend to follow methods they are already familiar with, it is important to review those methods, because inaccurate quantification can result in needless consumption of DNA and cause valuable time and resources to be wasted.
Thermo Scientific NanoDrop 2000™
Spectrophotometry is the traditional method used to measure DNA. Most labs know of the Nanodrop series, which determines the quantity of ultraviolet radiation that gets absorbed by bases in solutions in order to assess the concentration of RNA or DNA in a sample.
The NanoDrop 2000™ (Figure 1) is able to measure a sample using just 1μl of sample and in less than five seconds. This instrument is connected to a computer and the results are recorded using software that can be either printed or exported as a report.
Although this method is fast and simple, it is unable to differentiate between free nucleotides, RNA, single-stranded DNA, and double-stranded DNA. Since all of these nucleic acids absorb at 260nm, they contribute to the overall absorbance of the sample, potentially leading to overestimation of the sample and inaccurate quantification results.
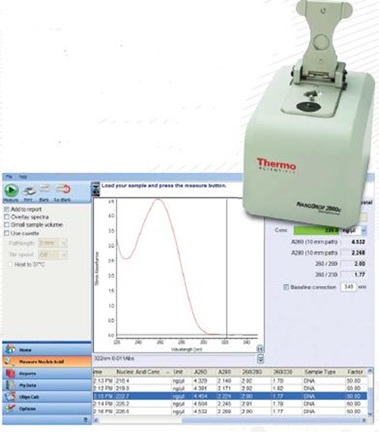
Figure 1. The NanoDrop 2000™ and an example of the absorbance profile generated when measuring good quality, “pure” DNA.
The NanoDrop™ estimates the quality of a sample through absorbance measurements at 260nm. Sample purity is indicated by the ratio of absorbance at 260 to 280nm, with a ratio of 1.8 generally considered to indicate pure DNA.
A much lower ratio would suggest the presence of contaminants such as phenol and protein that tend to absorb at approximately 280nm. The presence of free nucleotides, RNA, wavelength precision of the instrument, and sample pH can all affect the absorbance measurements.
Even the slightest change in sample pH can alter the 260:280 ratio, with a basic solution usually causing an increase in this ratio and an acidic solution decreasing it. Therefore, when samples are compared, the pH must be the same between diluted and undiluted samples. Thus, in order to obtain excellent accuracy, we recommend using a fluorescence-based approach in the quantification of immunoprecipitated DNA.
Figure 2 shows fluorescence measurements using the NanoDrop 2000™ device.
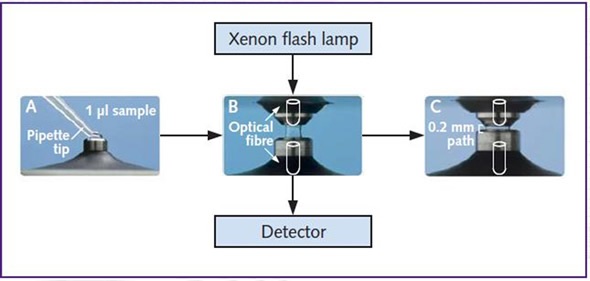
Figure 2. Fluorescence measurements using the NanoDrop 2000™. Sample is pipetted directly onto the pedestal (A). Once the arm is closed a sample column is formed between the xenon flash lamp and detector (B). The pedestal then moves to automatically adjust for optimal path length and absorbance readings are captured through the optical fibre by the detector (C).
Life Technologies Qubit 2.0®
When compared to spectrophotometers, UV-induced fluorescence using intercalating dyes offer a more precise and sensitive method of quantifying DNA. The intercalating dye only interacts with double-stranded DNA and is therefore less likely to be contaminated with unnecessary nucleic acids.
For instance, the Qubit 2.0® fluorometer (Figure 3) can measure DNA using sample concentrations as low as 10pg/μl, which is perfect when measuring immunoprecipitated DNA that is outside the UV spectrometer range.
On the other hand, the Qubit 2.0® only offers information with respect to the total concentration of DNA in the sample and does not provide any data regarding possible impurities.
Another drawback is that a dye buffer mixture has to be prepared and the sample needs to be diluted until it reaches the desired quantification range. This takes a little longer than using the NanoDrop 2000™ instrument, which has a wide quantification range. However, these negative factors are compensated for by the increased measurement precision.
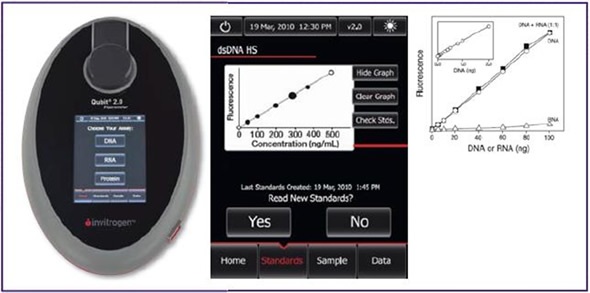
Figure 3. Life Technologies’ Qubit 2.0®. Lightweight and compact, the Qubit 2.0® takes up very little lab space and can be used for the quantification of DNA, RNA and protein. Data can be exported from the device by using a USB flash drive (left).
Agilent Bioanalyzer 2100©
The Bioanalyzer 2100© system from Agilent Technologies is a chip-based nucleic acid analysis system. Microfluidic technology is used to pass 1μl of sample through a micro-channel, which is filled with a fluorescent dye and sieving polymer.
When electrical voltage is applied, the sample moves through the channel which is imprinted onto the surface of the chip. As the sample migrates, fragments of DNA are separated based on their size and ultimately detected in real-time, therefore enabling rapid data analysis and manipulation.
A ladder comprising fragments of known concentrations and sizes is used to create a curve of migration time against fragment size.
Following this, an electropherogram is generated which then plots migration time against fluorescence intensity. This can be shown as a “virtual gel” using a densitometry plot, as illustrated in Figure 4.
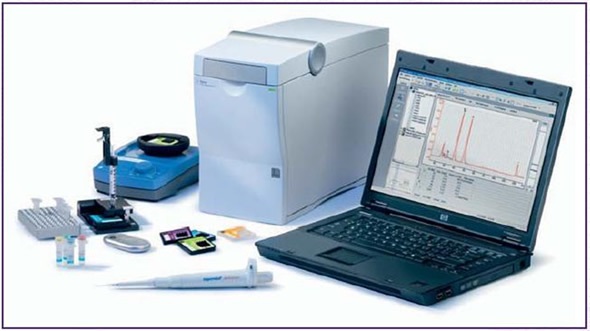
Figure 4. The Agilent 2100 Bioanalyzer© and high-sensitivity DNA assay components. Beside the instrument, a vortex and chip priming station are used to prepare samples for analysis. The 2100 work area software has several tabs which display data for evaluation of chip runs that can be presented as result tables, gel-like images, histograms, dot plots, or, as above, electropherograms.
When compared to conventional analysis methods, the Bioanalyzer offers a number of benefits. Firstly, DNA fragment analysis not only offers information regarding DNA concentration, but also the size range of fragments that make up the nucleic acid sample.
Figure 5 shows a classic example of the fragmentation profile of chromatin obtained from HEC50 cells using the Chromatrap ChIP-Seq kit.
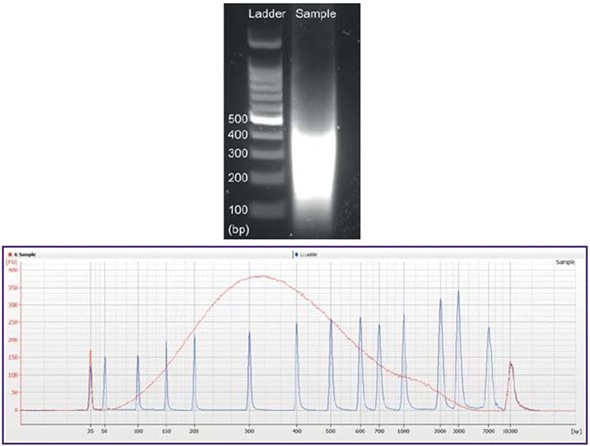
Figure 5. Sonicated chromatin (red) was analysed using the Bioanalyzer 2100 using the DNA high sensitivity chip (below). Ladder (blue) was overlaid on the measured sample as an internal reference. The corresponding sample as seen on a traditional agarose gel stained with SYBR® Safe (left).
However, although this Bioanalyzer does offer quantitative and qualitative information, the instrument is expensive when compared to the Qubit 2.0® and NanoDrop 2000™ instruments and in many laboratories, cost is an important factor to consider.
However, the opportunity for precise quantification should not be missed based on cost because accurate DNA validation will save time and money in the long-term.
The Table shown below compares the quantification parameters of the Qubit 2.0®, NanoDrop 2000™ and Bioanalyzer 2100© instruments.
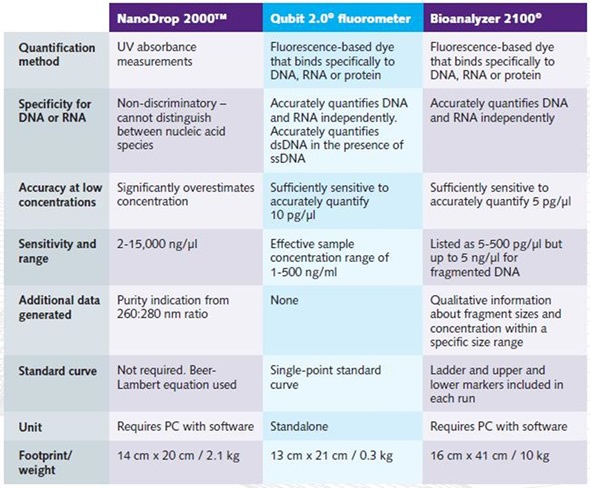
Table. Comparison of the quantification parameters of the NanoDrop 2000™, Qubit 2.0® and Bioanalyzer 2100©.
Conclusion
A fluorometric technique can be used for precise validation of DNA in downstream processes. Although the NanoDrop 2000© instrument is low-cost, reliable and enables measurement of the basic quantity of RNA/DNA in a sample, it is not suitable for applications where the highest precision is required for DNA quantification.
In such situations, fluorescence-based quantification provides an ideal solution. The benefits offered by the Qubit 2.0® and Bioanalyzer 2100© are evident with regard to their sensitivity and sizing ability.
About Chromatrap®
 Chromatrap® is a product of Porvair Sciences, a wholly owned subsidiary of Porvair plc. We are one of the largest manufacturers of Ultra-Clean microplates, 96 well well filtration plates and Microplate handling equipment for life science and synthetic chemistry. With offices and Class VIII clean room manufacturing located in the UK, combined with a world-wide network of distributors and dedicated distribution hub in the USA, we pride ourselves on our continuous innovation, research and flexibility to meet customer demands. We offer OEM production and contract manufacturing through our North Wales facility.
Our porous polymeric material, BioVyon™, whose chemical functionalisation can endow it with internal surface properties individually configured to capture and separate target species out of difficult mixtures, has opened up many possibilities in the field of BioSciences where molecules of interest such as DNA, RNA, proteins etc can be selectively pulled out of complex mixtures of biological origin. The materials have proven to be a remarkably good substrate for accepting novel chemistries such as the organically bound Protein A and Protein G in Chromatrap®.
Using our 25 years experience of microplate manufacturing, Porvair Sciences has now developed a high-throughput bead-free ChIP assay based on our filtration plates containing our Chromatrap chemistry. Chromatrap-96 enables large scale epigenetic screening to become a reality in many laboratories and eliminates many of the long and laborious steps previously undertaken in such work.
Sponsored Content Policy: News-Medical.net publishes articles and related content that may be derived from sources where we have existing commercial relationships, provided such content adds value to the core editorial ethos of News-Medical.Net which is to educate and inform site visitors interested in medical research, science, medical devices and treatments.