Introduction
A necessary step in the preparation of biomolecules for downstream applications is determining their concentration by photometric methods, once the nucleic acids or proteins are isolated. Biomolecules are often diluted after isolation if their concentration levels are high. It is extremely important to maintain accuracy during individual dilution steps, so that the originating concentration is not miscalculated, which, in turn, avoids miscalculations in the subsequent applications. A common challenge faced in dilution is that most samples cannot be reused after dilution, and rebuilding the original concentration is a cumbersome process.
Microliter measurement systems help eliminate the need for serial dilutions due to their ability to measure highly concentrated samples in their undiluted state. Measurements on such systems can be made with just a few microliters of the sample. These systems employ a shortened light path for taking measurements. Figure 1 compares the measurements taken using a normal cuvette against those taken by a microliter cuvette. It can be seen that in case of a normal cuvette that has a 10mm light path, the light is blocked by a sample of a specific concentration, and it cannot reach the detector. However, in a microliter measurement cell with shortened path length, the light passes through the sample and reaches the detector. The concentration of the sample is a function of the abbreviated light path.
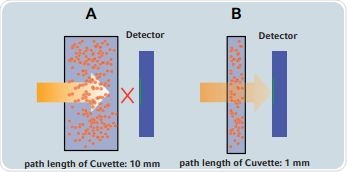
Figure 1. Abbreviation of the light path for photometric determination of highly concentrated samples (not to scale): A) Standard cuvette B) Microliter measurement cell, while the sample concentration may not be determined in a cuvette with a path length of 10mm, the sample can be measured in a cuvette with a path length of 1mm
Part 1- Handling of the µCuvette
The Eppendorf µCuvette, shown in Figure 2, was developed based on the measurement principle decribed above. It can be seen that the µCuvette is made up of two arms with a small quartz plate fitted at the end of each arm. The sample application area is demarcated by two black markings at the end of the arms for easy sample application.
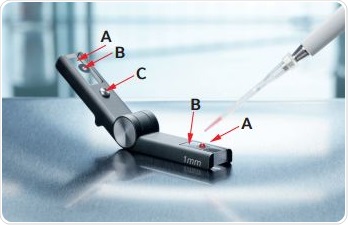
Figure 2. The µCuvette: A: Sample application area and optical measurement window B: Quartz plates C: Spacer
Measurement Range of the Cuvette
In case of a µCuvette, the 1mm light path can measure 10 times higher sample concentrations than that would be achievable with conventional cuvettes of standard 10mm path length. Another perspective is that the same sample will exhibit absorbance that is 10 times lower in the 1mm light path when compared to the 10mm light path. The theoretical ranges for measurement of chosen biomolecules are listed in Table 1.
Table1. Measurement range for selected biomolecules in the Eppendorf BioSpectrometer
|
Sample
|
μCuvette –
1mm path length
(0.005-3E)
|
μCuvette –
1mm path length – optimum
(0.05-2E)
|
Standard Cuvette
z.B. Eppendorf UVette - 10mm path length
(0.005-3E)
|
Standard Cuvette
z.B. Eppendorf UVette -10mm path length – optimum
(0.05-2E)
|
|
dsDNA
|
2.5 – 1500μg/mL
|
25-1000μg/mL
|
0.25 – 150μg/mL
|
2.5-100μg/mL
|
|
RNA
|
2 – 1200μg/mL
|
20-800μg/mL
|
0.2 – 120μg/ml
|
2-80μg/mL
|
|
Protein (BSA)
|
0.075 - 45mg/mL
|
0.75-30mg/mL
|
0.0075- 4,5mg/mL
|
0.075-3mg/mL
|
The values in the table are based on the instrument specifications of the Eppendorf BioSpectrometer and Eppendorf BioPhotometer, along with cuvettes that feature a 10mm light path, or a µCuvette with a 1mm light path, respectively. Additionally, the ideal concentration range that would result in a respective linear standard curve is also shown. Design of the µCuvette is suitable for use in instruments such as the BioSpectrometer and the BioPhotometer, because the light beam of these instruments was optimized to the dimensions of the measurement window of the µCuvette.
The optimization of the light beam in BioSpectrometers allows the measurements even with smaller sample volumes when compared to the BioPhotometers. The µCuvette not only eliminates time and effort consuming serial dilutions, but also requires only minute sample volumes for measurement. The respective sample volumes required for measurements using BioPhotometer or BioSpectrometers are shown in Table 2.
Table 2. Sample volumes required for determination in Eppendorf BioPhotometers and BioSpectrometers (max. 10μL)
|
Sample
|
Eppendorf BioPhotometer
|
Eppendorf BioSpectrometer
|
|
Nucleic acids
|
≥ 2μL
|
≥ 1.5μL
|
|
Protein
|
≥ 4μL
|
≥ 3μL
|
After completion of measurements, the sample recovery for further processing can be done easily using a pipette. Sample volume specifications are based on their aqueous solutions. The volume of DNA solutions that contain a comparatively high protein concentration may be marginally higher. An important criterion for measurement is that solutions containing detergents should not be used. Highly concentrated nucleic acid solutions are likely to show reduced surface tension; therefore, an increase in the volume may be required for ensuring the formation of the required liquid column.
Measurements Performed in the BioPhotometer or BioSpectrometer
The instrument parameters of BioSpectrometer or BioPhotometer need to be set before measurements are done using the µCuvette. For instance, the optical length is a key parameter that needs to be set to 1mm. The concentration of the sample can be determined from the measured absorbance, considering the shorter path length. The background correction function is recommended to be activated in both the instruments to handle the expected background signals if any, caused by contaminations. At low concentrations, even low intensity background signals may affect the results significantly. Background correction function is advocated in all classes because the actual sample concentration is usually not known before measurements.
Measurement in the BioSpectrometer
Direct definition of parameters before measurement is possible in the BioSpectrometer. Unlike in the BioPhotometer D30, the BioSpectrometer is capable of displaying the entire absorbance spectrum of the sample for a defined area. The selection of the wavelength for background correction can be done freely, as shown in Figure 4.
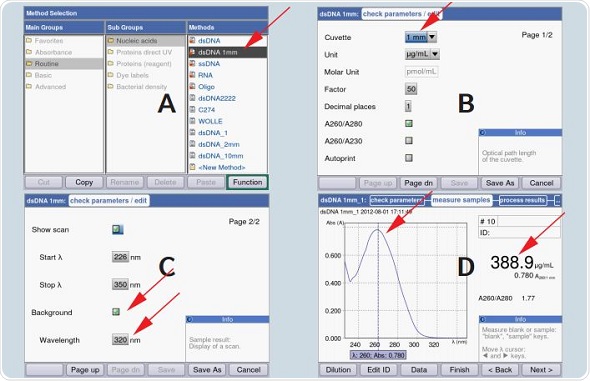
Figure 3. Parameter selection on the BioSpectrometer for application of the 1mm light path and for activation of background correction: A) Selection of method dsDNA_1mm B) Select optical path length to 1mm (only required if dsDNA_1mm is not employed) C) If desired, you may activate the scan display and/or background correction D) Example of a measurement of a dsDNA-solution using the µCuvette in the BioSpectrometer
The BioSpectrometer presents a pre-programmed method for dsDNA measurement with the 1mm path length, thereby simplifying its operation.
Measurement Process in the BioPhotometer/BioSpectrometer
The measurement process involves application of the blank solution to the µCuvette’s black rimmed area. Figure 5 shows the formation of a liquid column between the sample carriers when the two arms are folded together.
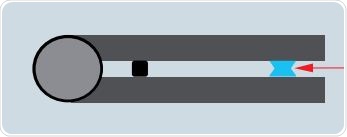
Figure 4. Diagram of the µCuvette. The sample has formed a liquid column (red arrow). The height of the column is equivalent to a light path of 1mm.
The sample needs to be checked for the presence of air bubbles and/or particles before measurement. The transfer of the µCuvette to the cuvette shaft for measuring the blank solution can be carried out only if the sample does not have such contaminants. Following the transfer, a lint-free tissue is used for removing the blank solution. After this step, the sample is ready for application and subsequent measurement, as shown in Figure 6.
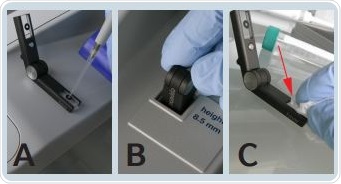
Figure 5. Measurement process with the µCuvette: A) Sample application B) Insertion into the cuvette shaft C) Removal of the blank or sample solution
Problems with Non-Formation of the Liquid Column
Obtaining proper results is not possible when a sample column is not formed, which is shown in Figure 7A. However, when a proper liquid column is formed, appropriate results may be expected. This is shown in Figure 7B. Identical dsDNA samples were measured in both the cases. Figure 7 depicts the absorbance spectrum of a dsDNA solution. The 260/280 ratio and the sample concentration were easily measured. In case of the scenario shown in Figure 7A, neither of these measurements could be derived because the liquid column was not formed.
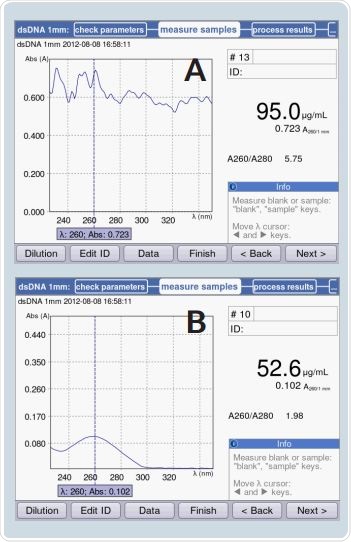
Figure 6. Measurement results with dsDNA samples: A) Without formation of liquid column B) With formation of liquid column
Handling and Cleaning
Contamination of the sample application area can be avoided by using gloves during the measurement process. Frozen samples should be thawed completely and mixed thoroughly for experiments using the µCuvette similar to analyses with standard cuvettes featuring a 100 light path. The temperature of the sample and the µCuvette needs to be the same at the start of the measurement.
After each measurement, the µCuvette should be cleaned using de-ionized water to avoid contamination. For persistent contaminants like those from nucleic acids, a wipe containing 6% sodium hypochlorite can be used to clean the µCuvette for their removal. The absence of edges in the sample carrier area prevents build-up of residue. The user manual of the µCuvette provides complete details of the cleaning process.
Part 2: Experiments using the µCuvette
Comparing the Autoabsorbance of the µCuvette with Cuvettes from Competitive Manufacturers
Autoabsorbance measurements were made across the 200 to 400nm range in the BioSpectrometer for determining the dynamic range of the µCuvette. Figure 8 shows the comparison of the resultant absorbance spectrum with those of other cuvettes, or microcuvettes. Water was contained in each of the cuvettes, and measurements were made against air in an empty cuvette shaft.
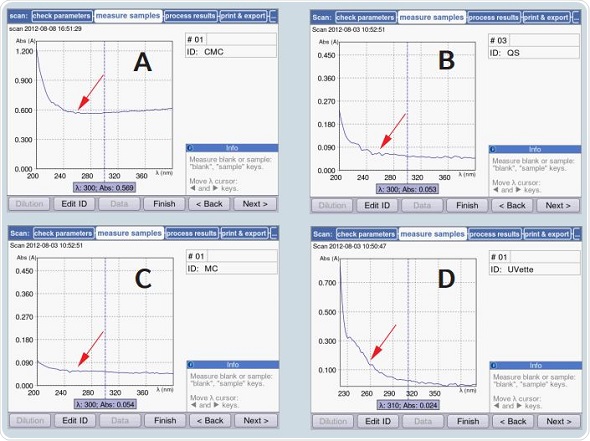
Figure 7. Comparison of autoabsorbance of the µCuvette with that of other cuvettes. The red arrow indicates the autoabsorbance of the cuvette at 260nm: A) Microcuvette by a competing manufacturer B) Quartz cuvette C) µCuvette D) UVette
As per the data shown in Figure 8, the autoabsorbance of the µCuvette can be compared to that of a quartz cuvette, with <0.1A at 260nm, but is much lower than the autoabsorbance exhibited by the microcuvette of a different manufacturer, which is roughly 0.6A at 260nm. Moreover, the UVette exhibits a very low value of autoabsorbance for a plastic cuvette, having only 0.12A. The entire spectrum of the BioSpectrometer and the BioPhotometer may be completely utilized due to the low autoabsorbance of the µCuvette.
Deviations of the µCuvette Measurements w.r.t Microliter Measurement Cell by a Different Manufacturer
An ATP stock solution was measured at various absorbance values of 0.1, 0.5, 1.0, 1.5 and 2.0, by taking a 1mm light path as reference. The ATP solution was diluted appropriately using a 0.1M Tris buffer having a pH value of 7.27. The buffer was also treated as a blank solution. Measurements were made in a quartz-ultra-micro cuvette under a 10mm light path by diluting all the solutions in 1:10 ratio. The measured values were taken as reference values for subsequent measurements that were performed in the microliter measurement cells.
The background correction was activated for all measurements performed on the BioPhotometer and the BioSpectrometer through the pre-programmed dsDNA method. About 3µL was employed and 100µL was used in an ultra-micro cuvette in order to take measurements in the microliter measurement cells. For each concentration and each cuvette, the measurements were performed 10 times, respectively. Tables 3a-e summarize the measured results.
Table 3a. Measurements at 260 nm: E = 0.1
Table 3b. Measurements at 260nm: E = 0.5
Table 3c. Measurements at 260nm: E = 1.0
Table 3d. Measurements at 260nm: E = 1.5
Table 3e. Measurements at 260nm: E = 2.0
It can be seen from the µCuvette results that the values were in line with the expected results, and also with the measurements acquired with the ultra-micro cuvette. This means that the µCuvette has a lower deviation when compared to a competing microliter measurement cell. Such low standard deviations imply that the µCuvette can provide a high degree of precision in measurements.
Conclusion
Photometric measurements of minute volumes of highly concentrated samples can be effectively performed using the microvolume cuvette, the µCuvette. The easy handling of the µCuvette enables it to provide a highly optimized microvolume measurement system in conjunction with the Eppendorf BioPhotometers and BioSpectrometer.
This measurement system works well for determining nucleic acids and proteins. The low autoabsorbance of µCuvette provides a dynamic range that was earlier feasible only with quartz cuvettes. In addition, high levels of precision and accuracy can be observed in the µCuvette measurements.
Acknowledgements
Produced from materials authored by Martin Armbrecht and Katja Karow from Eppendorf AG, Hamburg, Germany.
About Eppendorf NA
Eppendorf NA, with headquarters in New York, are a subsidiary of Eppendorf AG (Hamburg, Germany) – manufacturer of laboratory instruments and consumables for the life sciences.
To make it easy for labs in the United States to benefit from Eppendorf quality, they provide total customer support and service: taking/tracking orders; product installation and training; application support; calibration services; general product maintenance and repair, and more!
Eppendorf's products
Eppendorf products are used in all types of life science research and testing settings – from basic laboratory applications to highly specialized cell and molecular biology applications. They are highly regarded for their quality design and performance – beginning with extensive research and development, adding state-of-the-art technology and ending with strict quality-controlled manufacturing are what make their products stand out from the rest. It is what has made them a brand you have been able to rely on for over 70 years.
Over the years Eppendorf has improved upon and added to their flagship products – pipettes and pipette tips, centrifuges and microcentrifuge tubes – to now include the most ergonomic liquid handling devices and automated pipetting stations, quiet centrifuges, fast and fully flexible thermal cyclers, sample-protecting deepwell plates, cell manipulation systems and microcapillaries, ultra-low temperature freezers, shakers, incubators and bioprocessing equipment.
Eppendorf's services
Customer Support Representatives are available M–F, 8:30 AM – 8:00 PM (EST).
Local Sales Representatives cover the entire US to give you the fastest best possible attention. They know their products – and better yet, they know your applications. Feel confident in their abilities to assess your needs and determine the best products and systems to give you the best results.
Field Specialists also cover the entire US to provide post-sales installation and training on their specialty systems and automation.
The Applications Hotline is manned by degreed scientists working in their own fully functional life science laboratory. They are on call and email-accessible to help you troubleshoot your application or answer any technical question you may have. The Eppendorf Services group provides a wide variety of support services such as pipette calibration, instrument maintenance programs, and expedited repair.
Sponsored Content Policy: News-Medical.net publishes articles and related content that may be derived from sources where we have existing commercial relationships, provided such content adds value to the core editorial ethos of News-Medical.Net which is to educate and inform site visitors interested in medical research, science, medical devices and treatments.