The stability of proteins is dependent on ligand interactions, buffer conditions or changes in conformation, and in the past, has been studied through the laborious process of Circular Dichroism (CD) Spectroscopy.
Furthermore, the thermal shift assay is based on temperature-induced denaturation and can be observed with SYPRO® Orange. This fluorescence dye is a naturally quenched dye and interacts with the hydrophobic core of proteins, which is visible following denaturation.
This interaction stimulates the SYPRO® Orange dye to emit a fluorescence signal. Carrying out a melting curve with the qTOWER3 real-time PCR thermal cycler therefore facilitates a simple and quick determination of the temperatures at which protein melts.
The midpoint, or melt peak, of the melting curve produced relates to the melting temperature (Tm value) of the protein under the present conditions.
Protein thermal shift assays are fast and sensitive tools for the examination of protein thermal stability, and can assist in evaluating protein ligand binding, which allows for the identification of optimal buffer conditions, or the analysis of protein variations.
In this trial, the Tm values of α-Chymotrypsinogen A in TBS with three diverse NaCl concentrations were determined.
Materials and Methods
Chemicals
- NaCl stock solution (5 M and 0.2 M in TBS buffer)
- 10 mg/mL
- SYPRO® Orange (1:200)
- TBS buffer (10 mM)
Instruments
For measurements, the qTOWER³, including the Protein 1 – SYPRO® Orange Color module (490 nm / 580 nm), was employed. All samples were measured three times, with 20 μl per reaction. Furthermore, a negative control was used for reference.
This naturally quenched dye interacts with the hydrophobic core of proteins which becomes visible following denaturation. The quenching effect instigated by water is lessened and measurement can be carried out on the growing fluorescence signal.
As a result, the temperature in the middle of the thermal denaturation process is labelled as melting temperature Tm. Changes to the Tm signify an alteration in protein stability.
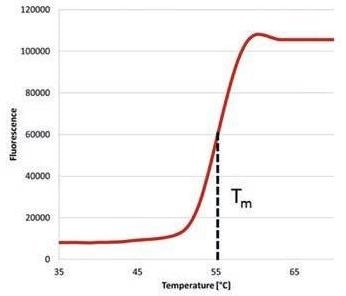
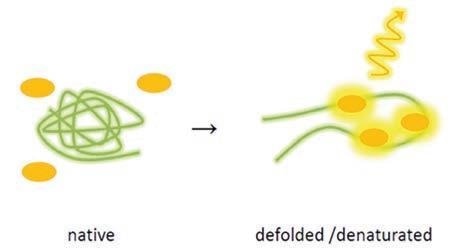
Figure 1. Melting curve of a Protein detected by using qTOWER3 in combination with SYPRO® Orange
Table 1. Temperature and time protocol
| Profile |
Temp. |
Holding |
Ramp. rate |
| Equilibration |
25 °C |
10 sec |
max. |
| Melting curve* |
25 – 90 °C and 6 sec with ΔT = 1 °C |
* Data acquisition: Color Module Protein 1 (490 – 580 nm) and Gain 5
Table 2. NaCl dilutions in TBS containing 1 mg/ml α-Chymotrypsinogen A
| Component |
20 mM NaCl |
500 mM NaCl |
2 M NaCl |
| α- Chymotrypsinogen A |
1 µl |
1 µl |
1 µl |
| TBS buffer |
59 µl |
59 µl |
38 µl |
| NaCl solution (5 M) |
- |
7 µl |
28 µl |
| NaCl solution (0.2 M) |
7 µl |
- |
- |
| SYPRO® Orange |
3 µl |
3 µl |
3 µl |
| Final Volume |
70 µl |
70 µl |
70 µl |
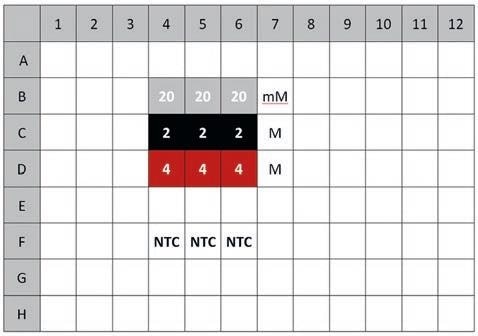
Figure 2. Plate layout for melting curve analysis
Results and Discussion
The melting curve of α-Chymotrypsinogen A and accordant analysis can be seen in Figures 3 and 4. The qTOWER3’s qPCRsoft control and analysis software automatically carries out the calculation and display of first derivatives of the melting curves.
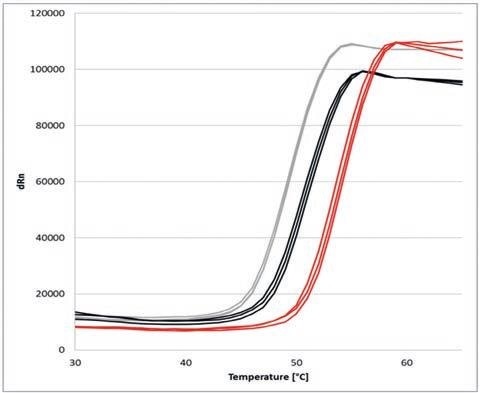
Figure 3. Melting curves of α-Chymotrypsinogen A under influence of different NaCl concentrations: 20 mM (grey), 500 mM (black) and 2 M (red)
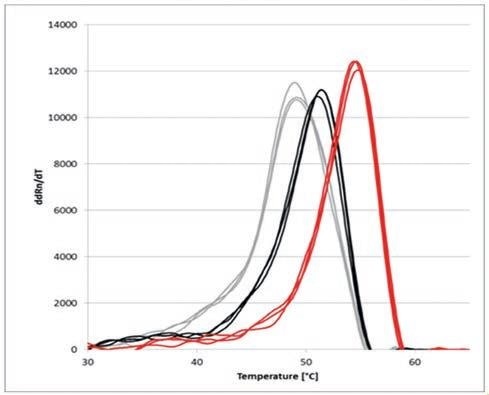
Figure 4. Melting curve derivatives of the thermal shift assay using SYPRO® Orange and qTOWER3 ; NaCl concentrations: 20 mM (grey), 500 mM (black) and 2 M (red)
Table 3. Melting points of α-Chymotrypsinogen A
| NaCl |
Tm |
Mean Tm |
| 20 mM |
49.1 °C |
49.1 °C |
| 20 mM |
49.2 °C |
| 20 mM |
49.0 °C |
| 500 mM |
51.4 °C |
51.3 °C |
| 500 mM |
51.1 °C |
| 500 mM |
51.4 °C |
| 2 M |
51.4 °C |
54.6 °C |
| 2 M |
51.6 °C |
| 2 M |
51.7 °C |
The change in Tm indicates a clear influence of the various NaCl concentrations on the thermal stability of the protein.
As NaCl concentrations increase, the thermal stability of α-Chymotrypsinogen A also sees an increase. Higher salt concentrations result in the development of hydration shells surrounding the proteins, subsequently stabilizing α-Chymotrypsinogen A.
As such, the melting point Tm is moved by almost 6 degrees Celsius, from approximately 49 degrees Celsius at 20 mM NaCl, to approximately 55 degrees Celsius at 2 M NaCl.
Conclusion
Unlike a traditional CD Spectroscopy assay, which can require around 60 minutes for each sample, this analysis was carried out in ten minutes for nine samples, with exceptional resolution of the investigated melting point.
A major benefit of using the qTOWER3 technology in thermal shift assays is that even in instances where the maximum number of 96 samples is used, the experimental time does not change. The high reproducibility is a result of straightforward processes, the high accuracy of qTOWER3 qPCR system, and the remarkable sensitivity of SYPRO® Orange.
About Analytik Jena US
Analytik Jena is a provider of instruments and products in the areas of analytical measuring technology and life science. Its portfolio includes the most modern analytical technology and complete systems for bioanalytical applications in the life science area.
Comprehensive laboratory software management and information systems (LIMS), service offerings, as well as device-specific consumables and disposables, such as reagents or plastic articles, complete the Group’s extensive range of products.
About Life Science
The Life Science product area demonstrates the biotechnological competence of Analytik Jena AG. We provide a wide product spectrum for automated total, as well as individual solutions for molecular diagnostics. Our products are focused to offer you a quality and the reproducibility of your laboratory results.
This will surely ease your daily work and speed up your work processes in a certain way. All together we support you through the complete process of the lab work. Besides we offer customized solutions and are able to adapt our products to your needs. Automated high-throughput screening systems for the pharmaceutical sector are also part of this segment’s extensive portfolio.
About Analytical Instrumentation
Analytik Jena has a long tradition in developing high-performance precision analytical systems which dates back to the inventions made by Ernst Abbe and Carl Zeiss. We have grown to become one of the most innovative manufacturers of analytical measuring technology worldwide.
Our business unit Analytical Instrumentation offers excellent competencies in the fields of optical spectroscopy, sum parameters and elemental analysis. Being proud of our core competency we grant all our customers a long-term warranty of 10 years for our high-performance optics.
About Lab Automation
With more than 25 years of market experience, Analytik Jena with its CyBio® Product Line is a leading provider for high quality liquid handling and automation technologies. In the pharmaceutical and life science industries, our products enjoy the highest reputation for precision, reliability, robustness and simplicity.
Moreover, the Automation Team designs, produces and installs fully automated systems tailored to our clients' application, throughput and capacity requirements. From stand-alone CyBio® Well up to fully customized robotic systems we handle your compounds, biomolecules and cells with great care.
Sponsored Content Policy: News-Medical.net publishes articles and related content that may be derived from sources where we have existing commercial relationships, provided such content adds value to the core editorial ethos of News-Medical.Net which is to educate and inform site visitors interested in medical research, science, medical devices and treatments.