A macromolecule is a very large molecule of high molecular weight and is made up of smaller subunits known as monomers. The majority of common macromolecules include synthetic and natural polymers, polypeptides and proteins.
The molecular weight of a macromolecule correlates closely to its biological, physical and chemical properties. This means that molecular weight measurement is one of the key factors for macromolecular characterization.
Molecular weight measurement involves techniques like end-group analysis, gel permeation centrifugal sedimentation, chromatography and osmotic pressure. Static light scattering (SLS) is another method for the characterization of molecular weight.
In this study, the BeNano 90 Zeta (Bettersize Instruments) was used to characterize the molecular weight of polyethylene oxide (PEO) standard dissolved in water by utilizing the SLS technique. The results will demonstrate the ability of BeNano 90 Zeta for characterizing molecular weight.
Theory and instrumentation
The scattering intensity of a macromolecule in the solution is detected in an SLS experiment then analyzed to gather the molecular weights of macromolecules, typical samples including proteins and polymers.
The macromolecules scatter light in all directions when a vertically polarized laser beam irradiates onto the sample. According to the Rayleigh equation, the scattering intensity at a certain angle and the molecular weight is related by:
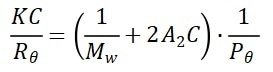 |
Equation 1 |
Where θ is the detection angle, C is the sample concentration, Rθ is the Rayleigh ratio that is employed to characterize the intensity ratio between the scattered light and the incident light at angle θ, Mw is the sample’s weight-average molecular weight, and A2 is the second virial coefficient.
The shape factor Pθ and the constant K are defined in Equations 2 and 3.
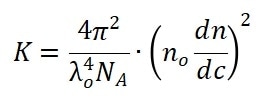 |
Equation 2 |
In Equation 2, the λ0, NA, n0 and dn/dc are the wavelength of the incident laser in a vacuum, Avogadro’s number, refractive index of the solvent and the refractive index increment of the suspension with respect to concentration under constant temperature, respectively.
Equation 3 defines the shape factor Pθ with λ0, NA, n0, θ and Rg, which is the macromolecule’s radius of gyration.
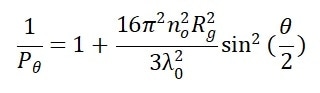 |
Equation 3 |
As shown in Equation 1, the only terms which are still unknown in the Rayleigh equation are Mw, A2 and Pθ.
The sample is thought to scatter homogeneously at all angles when the macromolecule’s radius of gyration Rg is a lot lower than the wavelength of the incident light λ0 (usually smaller than 1/40 of the incident wavelength), where the Pθ approximate to 1.0.
The molecular weight calculations based on any angle supply accurate and identical results. The Rayleigh equation is simplified in this circumstance into:
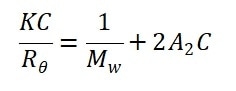 |
Equation 4 |
In this study, the Mw (molecular weight) of the PEO standard was established on the BeNano 90 Zeta. The scattered intensity of PEO solutions was identified at 90° with multiple concentrations.
By plotting and linearly fitting the KC/Rθ values versus the concentration profiles of the suspensions, the Debye plot is created.
In order to calculate the second virial coefficient A2, the slope of the linear regression equation is employed, while the extrapolation of the linear regression to zero concentration yields the reciprocal of molecular weight.
Experiment
For reference, a toluene standard with known Rayleigh ratio was prepared and utilized. PEO aqueous solutions were prepared at the concentration 20, 10, 5, 2.5, 2.0, 1.5, 1.0 and 0.5 mg/mL, and filtrated by 0.22 μm PES filter.
The device measured the scattering intensity of the standard toluene sample (ISTD), dark count rate (ID), scattering intensities of the solvent (Is) and scattering intensities of the samples at different concentrations (I1, I2, I3…In).
With respect to the solvent, the residues of absolute scattering intensities of the samples at different concentrations were calculated as:
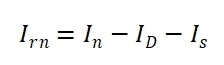 |
Equation 5 |
The Rayleigh ratio of samples at different concentrations was calculated by utilizing the calculated absolute scattering intensities (Irn), ISTD and the known Rayleigh ratio of the standard toluene sample (RSTD). These were as follows:
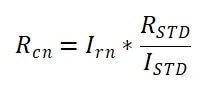 |
Equation 6 |
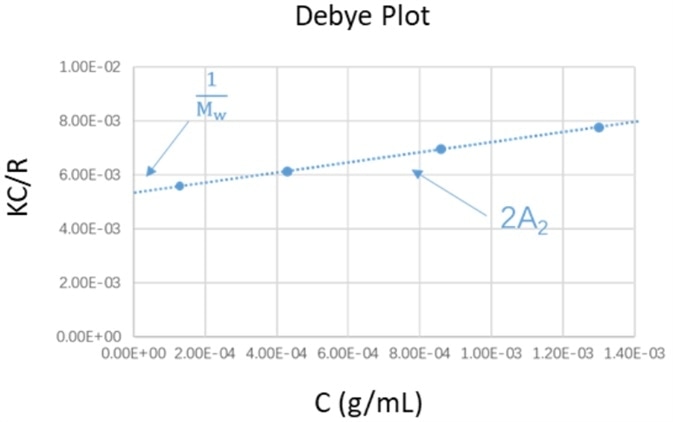
Figure 1. Schematic diagram of Debye plot. Image Credit: Bettersize Instruments
With the calculated Rcn, by plotting the KC/Rcn against the concentration profiles, the Debye plot was created. The second virial coefficient and molecular weight were gathered through the intercept and slope from the linear regression of the Debye plot.
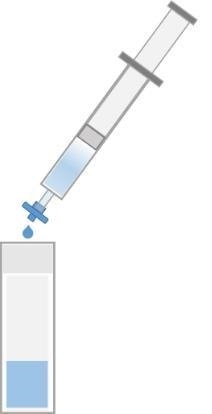
Figure 2. Illustration of sample filtration. Image Credit: Bettersize Instruments
Next, the experimental results were compared with the literature values to confirm the accuracy of the results.
Results and discussion
The literature values of weight-average molecular weight (Mw) and the refractive index increment for the PEO standards examined in this article are 20.217 kDa and 0.132, respectively.
Table 1. Molecular weight and second virial coefficient results from Debye Plot. Source: Bettersize Instruments
Intercept
[1/kDa] |
Calculated Mw
[kDa] |
Slope
[L*mol/g2] |
A2
[mL*mol/g2] |
| 0.0435 |
22.989 |
3.006 |
0.001503 |
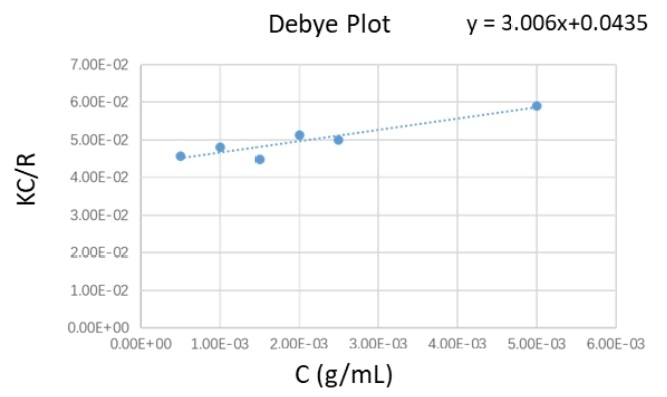
Figure 3. The Debye plot of PEO suspensions at different concentration profiles. Image Credit: Bettersize Instruments
Figure 3 shows the Debye plot, which was created from the experimental data. The molecular weight Mw and the second virial coefficient were calculated from the linear regression equation of the Debye plot, as shown in Table 1.
The weight-average molecular weight result of the PEO standard gathered by the BeNano 90 Zeta was 22.98 kDa, and the deviation between this measured value and the literature value of 20.217 kDa was around 10 %, as seen in Table 1.
Conclusion
The weight-average molecular weight measurement of the PEO standard was carried out in this study, and the measured value was established using the Debye plot.
The measured value is quite near to the literature value, which shows that the BeNano 90 Zeta is a reliable, useful tool for characterizing the molecular weight of proteins.
Acknowledgments
Produced from materials originally authored by Shelly Zhang, Zhibin Guo and Hui Ning from Bettersize Instruments.
About Bettersize Instruments

With over 25 years experience developing and manufacturing particle characterization instruments, Bettersize has introduced breakthrough technology in the field of particle size & shape measurement.
By achieving high quality and superior performance, our instruments provide precise analysis results of particle size, particle shape, and powder characteristics, helping scientists and engineers to understand material properties, facilitate research and improve production efficiency.
Bettersize product line for particle size and shape analysis includes instruments of all needs and budgets, from basic to advanced research models. These instruments are widely applied in Pharmaceuticals, Battery materials, Mining and minerals, Metals, Chemicals and Surface coatings, measuring materials with size ranges from nanometer to millimeter.
Focused on technology innovation, instruments manufacturing, application support and after-sales services, Bettersize provides expertise and professional solutions and assures customers the highest confidence in our products.
Sponsored Content Policy: News-Medical.net publishes articles and related content that may be derived from sources where we have existing commercial relationships, provided such content adds value to the core editorial ethos of News-Medical.Net which is to educate and inform site visitors interested in medical research, science, medical devices and treatments.