Proteins consisting of amino acids are key macromolecules that play essential roles in all kinds of activities in living organisms. In particular, amino acids are bound by peptide bonds to create polypeptides that are folded further into specific tertiary conformations.
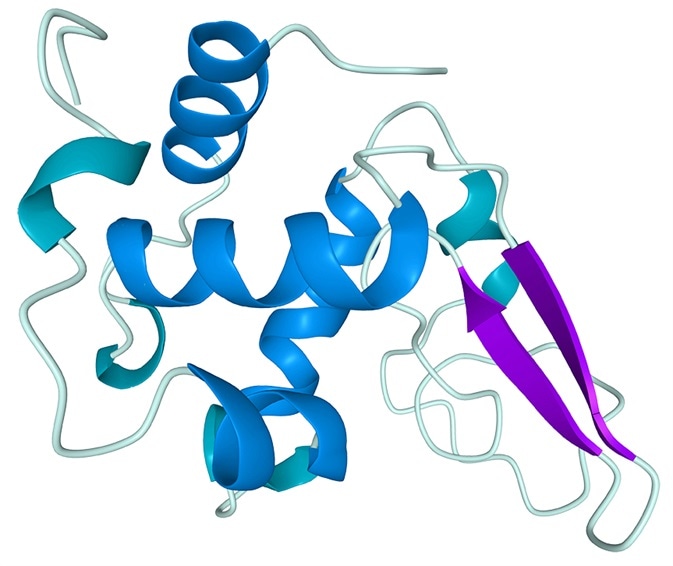
Image Credit: Bettersize Instruments
The conformation of proteins fluctuates when exposed to various environments, modifying the properties of proteins. For instance, when scattered in an aqueous environment, a protein’s structure and biological activity are contingent on ion concentrations, solvent composition, and temperature.
Proteins are evaluated and applied in several fields such as pharmaceuticals, biological sciences, food and beverage, etc. Bovine serum albumin (BSA) is a commonly used protein, which is purified using the blood of cows.
As it is an abundant source, low in price, with a stable and spherelike structure, BSA is used extensively used in protein research and industries.
For this study, the BeNano 90 Zeta (Bettersize Instruments) was used to determine the size, molecular weight, and zeta potential of BSA aqueous solutions in order to evaluate the dependence of protein structure and molecular interaction on the dispersant environment.
Instrumentation
Equipped with the dynamic light scattering (DLS), static light scattering (SLS), and electrophoretic light scattering (ELS) technologies, the BeNano 90 Zeta was used for measurements that determine the size, molecular weight, and zeta potential.
To illuminate the sample a solid-state laser beam with a wavelength of 671 nm and a power of 50 mW was applied.
An avalanche photodiode (APD) detector paired with fiber was utilized to accumulate scattered light signals from 12° for zeta potential measurement and 90° for size and molecular weight measurements, respectively.
Theory
Dynamic light scattering (DLS)
Dynamic light scattering (DLS) is a sizing technology that measures the diffusion behavior of the particles dispersed in liquids.
When suspending nanoparticles in the liquid medium, the persistent random movement of the nanoparticles is characterized as Brownian motion, whose speed is relative to the particle sizes.
When the nanoparticles are illuminated by a laser beam in suspensions, the intensity of scattered light varies as a result of the Brownian motion of particles. The intensity of the scattered light is then discovered by APD and transformed to a correlation function using the correlator.
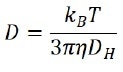
By evaluating the correlation function, the diffusion coefficient (D) that characterizes the speed of Brownian motion is subsequently calculated. The hydrodynamic diameter (DH) is achieved using the Stokes-Einstein equation:
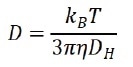
where kB is the Boltzmann’s constant, T is the temperature, and η is the viscosity of the solvent. Preferably, the diffusion coefficient (D) in the Stokes-Einstein equation is characterized by self-diffusion in a dilute concentration range, which indicates that there is no particle-particle interaction in the suspension.
Owing to this, the diffusion coefficient could be indicated as D0. However, as there is an increase in the concentration of the suspension system, the particle-particle interaction grows stronger and therefore could no longer be overlooked.
For high-concentration samples, particles’ diffusion motions are also contingent on concentrations and can be expressed as:
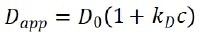
where Dapp is the apparent diffusion coefficient acquired from DLS, c is particle concentration, and kD is the interaction parameter, which is relative to the second virial coefficient as:
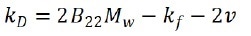
where B22 is the second osmotic virial coefficient, Mw indicates the molecular weight of the sample, kf signifies the first term in the expansion of friction coefficient, and v represents the specific volume.
The interaction parameter characterizes the dependence of the apparent diffusion coefficient on concentration. It is also frequently used to determine the stability of suspensions.
Generally, a system with a bigger kD means greater repulsive forces among particles, which produces a more stable state in which aggregates are less likely to form.
Electrophoretic light scattering (ELS)
In an ELS experiment, the sample is irradiated using a laser beam, where the scattered light is determined at a forward angle of 12°. The sample solution or suspension is exposed to an electric field fixed at both ends of the sample cell, thereby generating the electrophoretic movement of the charged particles.
Consequently, the scattered light undergoes a frequency shift contrasted to the incident light as a result of the Doppler effect. The scattered light signals with a frequency shift are transformed to phase shift via PALS analysis.
By the phase plot, the electrophoretic movement velocity per unit electric field, which is represented by the electrophoretic mobility µ, is acquired. Through Henry’s equation, it is possible to relate the electrophoretic mobility µ and its zeta potential ζ as follows:
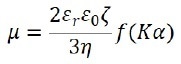
Where ε0 represents the solvent dielectric constant in vacuum, εr stands for the relative dielectric constant, η indicates the solvent viscosity, f(Κα) signals the Henry function, Κ is the reciprocal Debye length, α represents the particle radius, and Κα refers to the ratio between the thickness of the double layer and the particle radius.
Zeta potential is a central indicator of a particle suspension system’s stability. With a high zeta potential, the repulsive force between particles is great and the system is typically stable.
Static light scattering (SLS)
In an SLS experiment, the scattering intensity of macromolecules in the solution is identified and subsequently analyzed to acquire their molecular weights.
Representative samples include polymers and proteins. When the sample is irradiated by a vertically polarized laser beam, the macromolecules scatter light in every direction, and as maintained in the the Rayleigh equation, the molecular weight and the scattering intensity at a certain angle is correlated as:
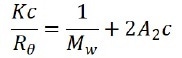
Where c represents the sample concentration, θ is the detection angle, Rθ indicates the Rayleigh ratio that is used to determine the intensity ratio between the scattered light and the incident light at angle θ, Mw marks the sample’s weight-average molecular weight, and A2 is associated with the second light scattering virial coefficient. K signifies constant and can be expressed as:
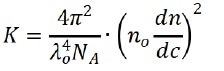
Where λ0, NA, n0 and dn/dc represent the wavelength of the incident laser in vacuum, Avogadro’s number, the refractive index of the solvent, and the refractive index increment of the suspension with regarding the concentration under constant temperature, respectively.
In the BeNano 90 Zeta, the scattering intensity can be identified at 90°. The Debye plot is then generated by plotting and linearly fitting the Kc/Rθ values versus the concentration profiles of the samples.
The slope of the linear regression equation is applied to quantify the second virial coefficient A2, while the intercept produces the reciprocal of molecular weight.
Experimental
Sample preparation
To assess the relationship between the solution environments and BSA structure, the two variables set up in this experiment were the dispersant and the concentration.
BSA solutions with concentrations of 0.5, 1.0, 2, 3.5, and 5 mg/mL were prepared specifically using 20 mM NaCl, 100 mM NaCl and 10 mM PBS buffer with pH of 7 as dispersant, respectively.
All solutions were mixed thoroughly using a magnetic stirrer and filtered through 0.22 µm polyethersulfone (PES) filters to eliminate dust or aggregates. All measurements were conducted at 25 °C.
Each sample was subjected to measurements on three occasions to confirm the repeatability of the results.
Particle size measurement
BSA solutions with various concentrations were filtered and moved into polystyrene (PS) cells for particle size measurement.
Zeta potential measurement
Zeta potential measurements were carried out by transferring around 0.75 mL of BSA solution in three dispersants into the folded capillary cell. The concentration of the samples is 5 mg/mL.
Molecular weight measurement
The scattering intensities of samples at various concentrations were detected during the static light scattering experiment. A toluene standard with a known Rayleigh ratio and the refractive index was developed and used for reference.
The dark count rate was measured using the BeNano 90 Zeta which also measured the scattering intensity of standard toluene sample, scattering intensities of the dispersant, and scattering intensities of samples at various concentrations.
Deducting the dark count rate and scattering intensity of dispersant generates the absolute scattering intensities of the solutes, which can be used further to indicate the Rayleigh ratio of samples at various concentrations. Finally, the Debye plot is created by plotting the Rayleigh ratio versus samples concentrations.
Results and discussion
As demonstrated in Figure 1, the sizes of BSA in all three dispersants were reduced as the concentrations increased. These solid lines are linear fitting for the data. From the slopes of the fitting curve, it indicates that the decrease in order of the size is 20 mM NaCl > 10 mM PBS > 100 mM NaCl.
")
Figure 1. Dependence of BSA size in different dispersants on concentration. Image Credit: Bettersize Instruments
.jpg "Determining the molecular weight, particle size and zeta potential of Bovine Serum Albumin (BSA)")
Figure 2. BSA diffusion coefficients versus concentration curves at different concentrations. Image Credit: Bettersize Instruments
There are two potential contributions to the size variations with concentration. The first one could be a result of sample concentration. Due to the functional groups present in the proteins, the surfaces of BSA were charged when dispersed throughout the liquid medium.
As there was an increase in BSA concentrations, the mean distance among the BSA particles decreased, and there was also an increase in the electrostatic repulsion.
As a result, the Brownian motions accelerated and the diffusion coefficient D increased, as exhibited in Figure 2. in accordance with the Stokes-Einstein equation:
There was a decrease in the hydrodynamic diameter as the diffusion coefficient D increased, which gives reason for the trend that the particle sizes of BSA decreased as concentration increased.
The second one is the ionic strength of dispersants. The ions in dispersants may protect the potential on the particle and therefore reduce the electrostatic repulsion. Moreover, the shielding effects increased in parallel with the ionic strength.
Therefore, in dispersants that possessed a greater ionic strength, or to put it another way, dissociated more ions (i.e., 100 mM NaCl), the sample concentration influenced the particle sizes less.
This gives reason for the trends that the particle sizes decreased less significantly in the 100 mM NaCl dispersant.
Figure 3 displays the Debye plot of BSA based on plotting and linearly fitting the Kc/R90 values in opposition to the concentration profiles of the BSA. The molecular weight Mw can be supplied by the intercept of the linear fit of the plot.
")
Figure 3. Debye plot of BSA solutions in different dispersants. Image Credit: Bettersize Instruments
The second virial coefficient A2 corresponds to the slope of the linear regression equation. Mw is outlined in Table 1, and A2 is in Table 3.
Table 1. Molecular weight Mw of BSA in different dispersants. Source: Bettersize Instruments
| Dispersant |
Mw (kDa) |
| 20 mM NaCl |
96.15 |
| 10 mM PBS |
91.74 |
| 100 mM NaCl |
101.01 |
As Table 1 shows, Mw in three dispersants spans from 91.74 kDa to 101.01 kDa. As it is understood, the BSA monomer is 66.5 kDa. When BSA is dissolved in solutions, oligomers and aggregates will form from some of the monomers.
Table 2. Molecular weight values corresponding to different integration regions of GPC. Source: Bettersize Instruments
| Peak |
1 |
2 |
3 |
4 |
5 |
| Mw (kDa) |
97.17 |
255.51 |
196.43 |
131.06 |
66.78 |
Table 3. Interaction parameters kD, zeta potential, and second virial coefficient A2 of BSA solutions in different dispersants. Source: Bettersize Instruments
| Dispersant |
kD (mL/mg) |
Zeta Potential (mV) |
A2 (mL*mol/g2) |
| 20 mM NaCl |
0.04373 |
-12.45 |
1.5 * 10-7 |
| 710 mM PBS |
0.02035 |
-9.23 |
4.0 * 10-8 |
| 8100 mM NaCl |
0.01241 |
-8.45 |
1.0 * 10-7 |
For example, a BSA dimer is comprised of two monomers and thus has the Mw of 132 kDa, and a trimer has the Mw of around 200 kDa. Resultingly, the average molecular weight of BSA measured is greater than that of monomer as a result of the presence of oligomers and aggregates.
Figure 4 presents the chromatogram of BSA, utilizing PBS buffer as the mobile phase, supplied by a gel permeation chromatography (GPC) system which is fitted with a light scattering detector and a differential refractive index detector.
_chromatogram_of_BSA_dispersed_in_PBS_buffer.jpg "Determining the molecular weight, particle size and zeta potential of Bovine Serum Albumin (BSA)")
Figure 4. Gel permeation chromatography (GPC) chromatogram of BSA dispersed in PBS buffer. Image Credit: Bettersize Instruments
There are a number of elution constituents in the chromatogram. Integration region 2-5 relates to each individual peak 2-5 respectively. From Table 2 where the Mw acquired by integration are detailed, peak 5 can be identified as a monomer peak because it has the Mw of 66.78 kDa.
Similarly, peak 4 is a dimer peak with the Mw of 132.06 kDa, peak 3 is a trimer peak with the Mw of 196.43 kDa, and peak 2 is a tetramer peak with the Mw of 255.51 kDa.
With integration region 1 spanning peak start to peak-end, the mean Mw of whole BSA by GPC is measured to be 97.17 kDa, which is in exceptional agreement with the average Mw the BeNano 90 Zeta acquires.
Protein stability has persistently been a significant concern for users. With DLS, ELS, and SLS technologies, the protein stability can be assumed by measuring either interaction parameter kD, zeta potential, or second virial coefficient A2 accordingly.
The greater the values of kD, A2, and the absolute value of zeta potential, the stronger the interaction force and as a result the more stable the protein.
With respect to the values in Table 1 relative to kD and zeta potential, the BSA stability in three dispersants is in the order: 20 mM NaCl > 10 mM PBS > 100 mM NaCl. Depending exclusively upon A2, the assumed stability is, though, in the order: 20 mM NaCl> 100 mM NaCl > 10 mM PBS.
Given the complex nature of SLS measurement as well as its comparatively high deviation, A2 is not as reliable as kD and zeta potential when indicating protein stability.
Therefore, a suitable conclusion that aligns with the results indicates that the BSA stability in the three dispersants is in such an order: 20 mM NaCl > 10 mM PBS > 100 mM NaCl. To clarify, across the three samples the BSA dissolved in 20 mM NaCl demonstrates the best stability.
A reasonable explanation is that proteins have higher potentials and stronger static repulsion, and, eventually, better stability when being dissolved in an environment of relatively low salt concentration.
Conclusions
Three light scattering technologies, i.e., DLS, ELS, and SLS, have been introduced into the BeNano 90 Zeta to facilitate the measurements of size, zeta potential, and molecular weight, respectively.
In this article, the sizes of BSA in three dispersants were measured, exhibiting the size trend when applying various types of dispersants. Then, the molecular weight Mw of BSA is acquired by the BeNano 90 Zeta and demonstrates exceptional agreement with the Mw offered by the GPC system.
Finally, by utilizing kD, zeta potential, and A2, the stabilities of BSA protein in various dispersants were evaluated and sorted successfully.
About Bettersize Instruments

With over 25 years experience developing and manufacturing particle characterization instruments, Bettersize has introduced breakthrough technology in the field of particle size & shape measurement.
By achieving high quality and superior performance, our instruments provide precise analysis results of particle size, particle shape, and powder characteristics, helping scientists and engineers to understand material properties, facilitate research and improve production efficiency.
Bettersize product line for particle size and shape analysis includes instruments of all needs and budgets, from basic to advanced research models. These instruments are widely applied in Pharmaceuticals, Battery materials, Mining and minerals, Metals, Chemicals and Surface coatings, measuring materials with size ranges from nanometer to millimeter.
Focused on technology innovation, instruments manufacturing, application support and after-sales services, Bettersize provides expertise and professional solutions and assures customers the highest confidence in our products.
Sponsored Content Policy: News-Medical.net publishes articles and related content that may be derived from sources where we have existing commercial relationships, provided such content adds value to the core editorial ethos of News-Medical.Net which is to educate and inform site visitors interested in medical research, science, medical devices and treatments.