Research was conducted to determine the optimum laser diffraction-based particle sizing dispersion method for Domperidone API.
This study employed the Bettersizer 2600 - an automatic laser diffraction particle size analyzer featuring a dry and wet dispersion system – which enabled researchers to systematically investigate the particle size distribution of Domperidone API.
The study presented here examined the impact of dispersing intensity on particle size analysis, employing a range of different air pressures for dry dispersion and a range of various ultrasonic dispersing times and stirring speeds for wet dispersion.
Comparisons were made between measurement results of both wet and dry dispersion methods, with the wet dispersion method found to be most suitable due to its capacity for accurate results and data correlation.
The role of Domperidone
Domperidone primarily acts on the chemoreceptor triggering region outside the blood-brain barrier. It is an example of second generation gastroprokinetic agent - a synthetic benzimidazole derivative.
Domperidone is a dopamine receptor blocker that helps suppress vomiting by blocking peripheral dopamine receptors, enhancing stomach motility while increasing lower esophageal sphincter pressure.
Domperidone has not yet been approved by the US Food & Drug Administration (FDA) but is widely available elsewhere.
It is most often employed in the treatment of esophageal reflux, flatulence and vomiting triggered by chemotherapy.
Domperidone particles' solubility is a key factor in its capacity to be absorbed into the body, meaning that it is vital to understand the influence of particle size on overall product quality.
Differences in particle size distribution between batches result in inconsistent dissolution and absorption in the body, directly impacting the drug's efficacy and safety.
The USP provides definitive regulations on API particle sizing using laser diffraction. For example, information is provided on the instrument's structure and principle, the specific approach to dry and wet dispersions and an array of factors that should be considered during the measurement process.
There is no guidance on the choice between wet or dry dispersion methods for specific drugs, however, and no information on evaluating this decision.
This article details a piece of systematic research into selecting an appropriate dispersion method when measuring the particle size distribution of Domperidone API. This has been performed in line with requirements in the USP and the ISO 13320.
Experiment
Instruments
This experiment employed a Bettersizer 2600 laser particle size analyzer from Bettersize Instruments, an MS303S electronic scale from Mettler Toledo and an SC ultrasonic cleaner from Shanghai Shengyan Ultrasonic Instrument Co. Ltd.
Sample and reagent
Two sets of Domperidone API sample were utilized in this study:
- Non-micronized sample (batch No.0068116-17)
- Micronized sample
Tween 80 was used as an analytical reagent. Purified water was also used.
Particle size distribution measurement and method evaluation: Dry dispersion method
Dry dispersion uses compressed air to transport powder particles, with particles being dispersed via a combination of collision with one another, collision with the pipe, as well as via airflow shear.
API powder is frequently comprised of small organic molecules particles prone to breaking via collision and shear stress. Despite this, it is important to ensure the dispersal of large agglomerates without the breakage of original particles.
The USP, therefore, prompts an investigation into the impact of dispersive intensity on test results (USP 429).
Image Credit: Bettersize Instruments
In the dry dispersion experiments conducted during this study, the effect of dispersed pressure was evaluated in terms of its impact on particle sizing results. Dispersed pressure ranged from 0.05 MPa to 0.4 MPa, with a set of data being tested every 0.05 MPa.
The results presented include:
- Abscissa: dispersion pressure
- Ordinate: particle size
- Blue curve: D10
- Orange curve: D50
- Grey curve: D90
An ideal pressure titration curve would show a gradual decrease in particle size in line with an increase in dispersed pressure. The curve will gradually reach a stable period.
However, if the pressure increases beyond this point, then the curve will move further downward, corresponding to the gradual dispersal of large agglomerates to single particles. Any further increase in pressure could lead to the breakage of the drug particles.
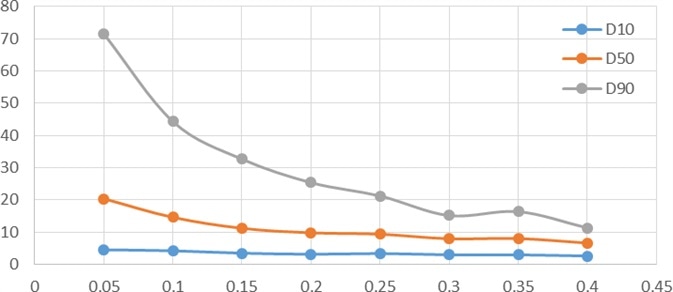
Figure 1. Particle size pressure titration data of non- micronized sample. Image Credit: Bettersize Instruments
A key challenge in drug particle sizing lies in the lack of a strict boundary between aggregate dispersion and single particle breakage. Further experiments are necessary in order to explore this.
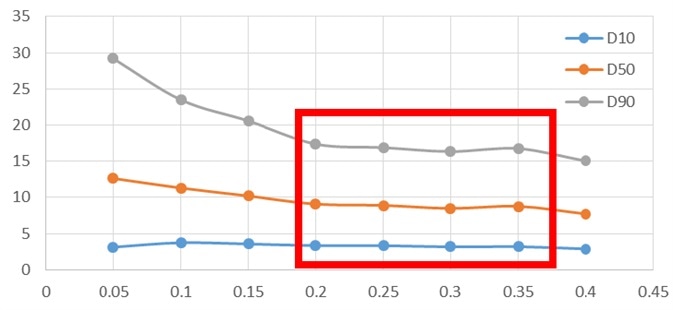
Figure 2. Particle size pressure titration data of micronized sample. Image Credit: Bettersize Instruments
An obvious stable platform of the micronized sample (Figure 2) was observed between 0.2 MPa and 0.35 MPa, but increasing the pressure of the non-micronized sample further led to there being no stable platform, causing the sample's particle size to decrease continuously. This is typically an indication of particle breakage.
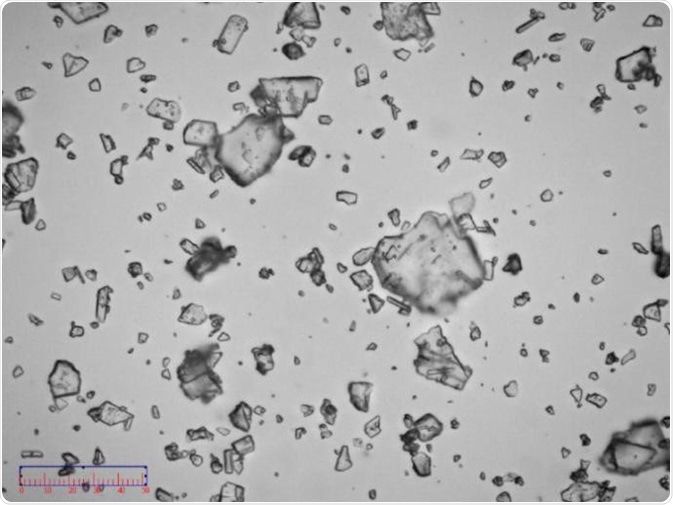
Figure 3. Image of non-micronized sample. Image Credit: Bettersize Instruments
Images of the non-micronized sample (Figure 3) were captured for further investigation, confirming that the sample was comprised of semi-transparent irregular crystal particles. An assessment of these images suggested that the sample would easily break as the dry dispersion pressure increased.
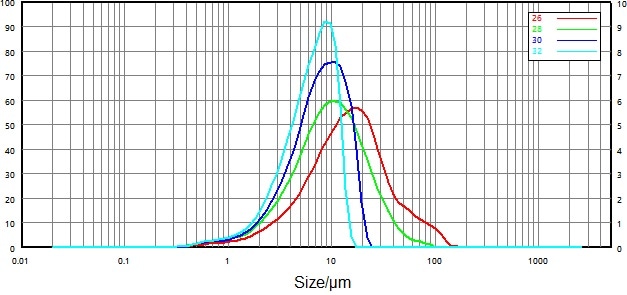
Figure 4. Particle size distribution of non-micronized sample under different pressures: red, green, navy, and cyan curve respectively represent 0.1, 0.2, 0.3, and 0.4 Mpa. Image Credit: Bettersize Instruments
Particle size distributions of non-micronized samples were evaluated under different pressures (Figure 4) to determine the optimal dry dispersion pressure. Results showed that as dispersion pressure increased, maximum particle size decreased from 150-100 µm to 30-20 µm.
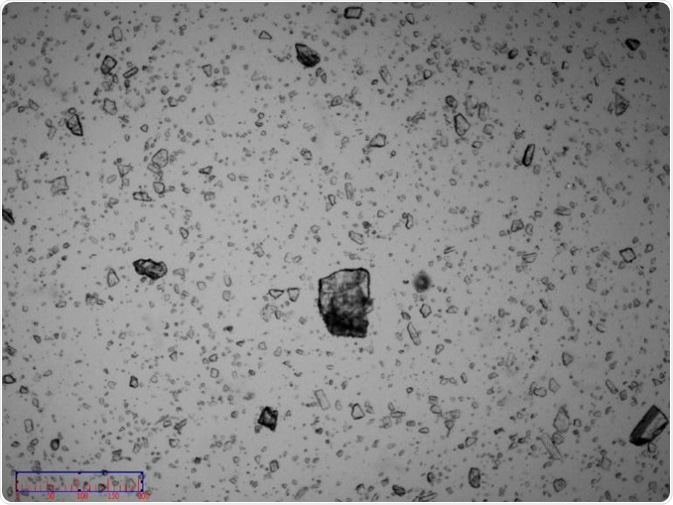
Figure 5. Image of non-micronized particles. Image Credit: Bettersize Instruments
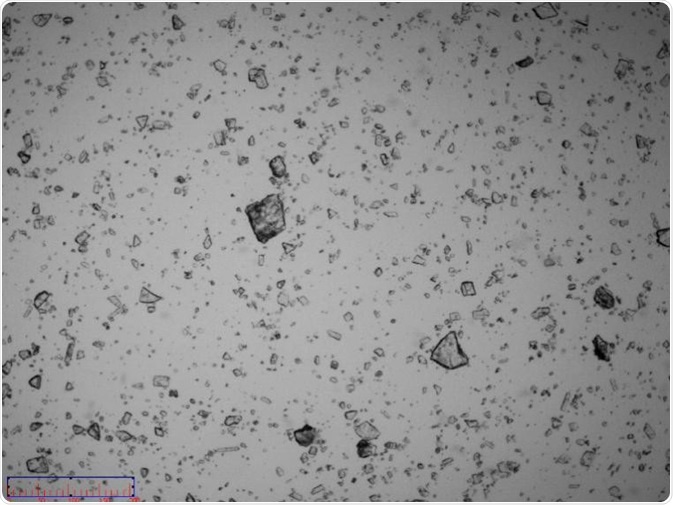
Figure 6. Image of non-micronized particles. Image Credit: Bettersize Instruments
An image of the sample confirmed the existence of some coarse particles with sizes around 100 µm. These coarse particles were single particles rather than agglomerated particles (Figure 5 and Figure 6).
The existence of these particles with the size of around 100 µm disproved the assertion that the maximum particle size is 30-20 µm. However, it was possible to conclude that particles became broken when dispersion pressure reached 0.3 MPa and above.
The pressure titration curve (Figure 2) and the fragility of the sample led to a decision to use a pressure of 0.2 MPa for testing the particle size distribution of Domperidone API.
Precision of the dry dispersion method
Domperidone API was measured under a dispersion pressure of 0.2 MPa. Figure 7 and Figure 8 display particle size distribution curves and repeatability data for both the non-micronized and micronized samples.
| Number |
Sample |
D10/μm |
D50/μm |
D90/μm |
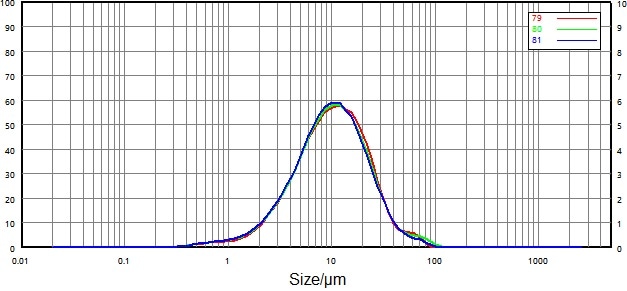
| 79 |
0068116-17 non-micronized-0.2 |
3.332 |
10.31 |
26.44 |
| 80 |
0068116-17 non-micronized-0.2 |
3.222 |
10.13 |
26.79 |
| 81 |
0068116-17 non-micronized-0.2 |
3.157 |
9.905 |
25.91 |
| RSD |
|
2.73% |
2.01% |
1.68% |
Figure 7. Particle size distribution and repeatability of non-micronized particles (dry dispersion). Image Credit: Bettersize Instruments
| Number |
Sample |
D10/μm |
D50/μm |
D90/μm |
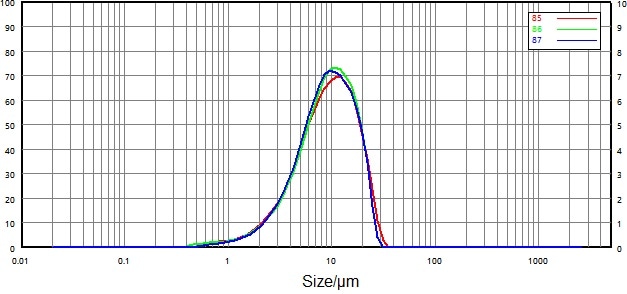
| 85 |
0068116-17 micronized-0.2 |
3.274 |
9.341 |
19.27 |
| 86 |
0068116-17 micronized-0.2 |
3.398 |
9.377 |
18.63 |
| 87 |
0068116-17 micronized-0.2 |
3.505 |
9.174 |
18.60 |
| RSD |
|
3.41% |
1.17% |
2.01% |
Figure 8. Particle size distribution and repeatability of micronized particles (dry dispersion). Image Credit: Bettersize Instruments
Repeatability for both samples comfortably surpassed the requirements outlined in the USP: repeatability of D50 was less than 2.1%, while D10 and D90 were less than 3.5%.
These values confirmed that the dry dispersion method was reliable means of measuring the particle size distribution of Domperidone API.
Particle size distribution measurement and method evaluation: Wet dispersion method
Domperidone API is not soluble in water, meaning that it had to be wetted with surfactant prior to dispersal in water via stirring and ultrasonic dispersion. Its fragility meant that the dispersion intensity was low.
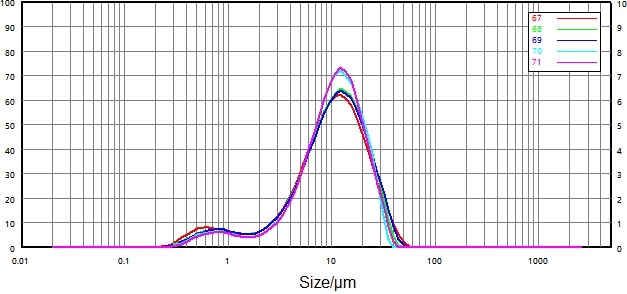
| Number |
Sample |
D10/μm |
D50/μm |
D90/μm |
| 67 |
0068116-17 micronized-B |
2.066 |
10.14 |
24.21 |
| 68 |
0068116-17 micronized-B |
2.481 |
10.49 |
23.71 |
| 69 |
0068116-17 micronized-B |
2.514 |
10.622 |
4.57 |
| 70 |
0068116-17 micronized-B |
3.127 |
10.63 |
22.06 |
| 71 |
0068116-17 micronized-B |
3.297 |
10.74 |
22.54 |
| RSD |
|
18.75% |
2.21% |
4.61% |
Figure 9. Test sample particle size distribution under agitation only. Image Credit: Bettersize Instruments
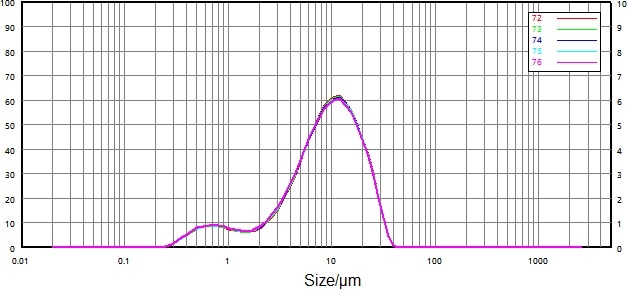
| Number |
Sample |
D10/μm |
D50/μm |
D90/μm |
| 72 |
0068116-17 micronized-C |
1.719 |
9.200 |
21.35 |
| 73 |
0068116-17 micronized-C |
1.716 |
9.154 |
21.31 |
| 74 |
0068116-17 micronized-C |
1.660 |
9.120 |
21.32 |
| 75 |
0068116-17 micronized-C |
1.666 |
9.089 |
21.32 |
| 76 |
0068116-17 micronized-C |
1.616 |
9.031 |
21.25 |
| RSD |
|
2.57% |
0.70% |
0.17% |
Figure 10. Test sample particle size distribution after stir dispersion only. Image Credit: Bettersize Instruments
The stirring and ultrasonic dispersion methods were applied respectively (Figure 9 and Figure 10) to ascertain the impact of dispersed intensity on sample particles.
The results were unstable when only the stirring method was applied to the sample, and the characteristics of wet dispersion meant that the drug particles could still be adherent.
Stability was notably improved following the low intensity ultrasonic dispersion, however. Ultrasonic dispersion had minimal impact on particle size distribution - its primary effect was on large particle trailing.
Repeatability was also greatly improved under low intensity ultrasonic dispersion, so the decision was made to adopt the low-intensity ultrasonic method in the subsequent wet dispersion.
Precision of the wet dispersion method
Using the same experimental conditions outlined above, an investigation was conducted into the precision of particle size distribution data when the sample was dispersed via low-intensity ultrasonic dispersion.
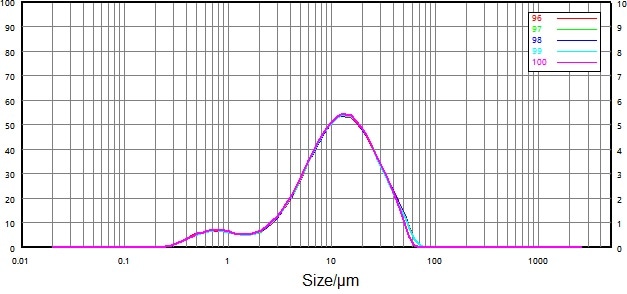
| Number |
Sample |
D10/μm |
D50/μm |
D90/μm |
| 96 |
0068116-17 non-micronized-C |
2.632 |
11.68 |
32.51 |
| 97 |
0068116-17 non-micronized-C |
2.640 |
11.69 |
32.29 |
| 98 |
0068116-17 non-micronized-C |
2.627 |
11.66 |
32.30 |
| 99 |
0068116-17 non-micronized-C |
2.615 |
11.60 |
31.96 |
| 100 |
0068116-17 non-micronized-C |
2.552 |
11.44 |
30.91 |
| RSD |
|
1.35% |
0.89% |
1.99% |
Figure 11. Particle size distribution and repeatability of non-micronized sample (wet dispersion). Image Credit: Bettersize Instruments
| Number |
Sample |
D10/μm |
D50/μm |
D90/μm |
| 78 |
0068116-17 micronized-C |
1.611 |
9.008 |
21.29 |
| 79 |
0068116-17 micronized-C |
1.595 |
8.971 |
21.28 |
| 80 |
0068116-17 micronized-C |
1.579 |
8.945 |
21.22 |
| 81 |
0068116-17 micronized-C |
1.570 |
8.944 |
21.28 |
| 82 |
0068116-17 micronized-C |
1.561 |
8.916 |
21.23 |
| RSD |
|
1.26% |
0.39% |
0.15% |
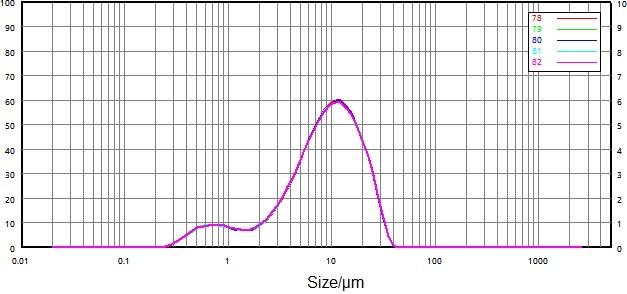
Figure 12. Particle size distribution and repeatability of micronized sample (wet dispersion). Image Credit: Bettersize Instruments
Figure 11 and Figure 12 both display the particle size distribution and repeatability data for the wet dispersion of the non-micronized and micronized samples.
Repeatability was greatly improved versus that of the dry dispersion: relative deviations of D50 and D90 were less than 0.7%, while the relative deviation of D10 was less than 2.6%.
These findings confirmed that wet dispersion was more reliable than dry dispersion for the measurement of Domperidone API particle size distribution.
Comparison and evaluation of dry and wet dispersion methods
Wet dispersion was a better choice than dry dispersion in terms of test precision. This was because particles only passed through the test area a single time during dry dispersion, while wet dispersion saw them pass through repeatedly. This resulted in a higher sampling frequency during wet dispersion.
| Number |
Sample |
D10/μm |
D50/μm |
D90/μm |
| 82 |
0068116-17 micronized-C |
1.561 |
8.916 |
21.23 |
| 100 |
0068116-17 non-micronized-C |
2.552 |
11.44 |
30.91 |
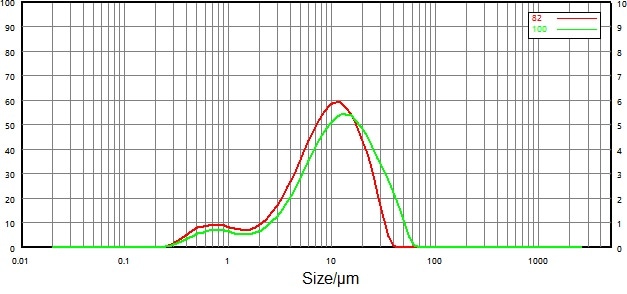
Figure 13. Compare particle size distribution results before and after micronization (wet dispersion). Image Credit: Bettersize Instruments
| Number |
Sample |
D10/μm |
D50/μm |
D90/μm |
| 81 |
0068116-17 non-micronized-0.2 |
3.157 |
9.905 |
25.91 |
| 86 |
0068116-17 micronized-0.2 |
3.398 |
9.377 |
18.63 |
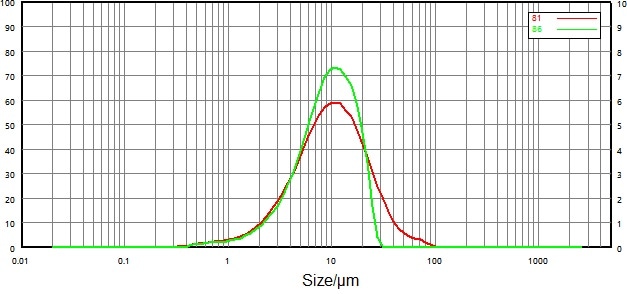
Figure 14. Compare particle size distribution results before and after micronization (dry dispersion). Image Credit: Bettersize Instruments
Figure 13 and Figure 14 show particle size distribution data of non-micronized and micronized samples by dry and wet dispersion methods.
In terms of the relative rationality of data, the wet dispersion method saw the particle size distribution peak shift to smaller particles following micronization. D10, D50 and D90 all decreased to different extents.
For the dry dispersion method, however, large particles changed significantly, both prior to and following micronization, while fine particles rarely changed.
Conclusion
These experiments confirm that both wet and dry dispersion methods could provide high precision results for the determination of the particle size distribution of Domperidone API.
Since Domperidone API is fragile, more data is required around the choice of sample dispersion, particularly for the dry dispersion method.
In these experiments, wet dispersion was found to provide data with improved repeatability, correlation and rationality versus data provided via dry dispersion.
It can, therefore, be concluded that the wet dispersion method is a good option for the analysis of the particle size distribution of Domperidone API.
References
- Aifen Liu. Research on gastrointestinal motility pharmaceutical [J]. China Practical Medicine, 2008, 34(3): 200-201.
- CHP second version appendix in 2010 [S]. Beijing: China medicine scientific press 2010:405-406.
- Zhukang Chen, Guiliang Chen, Huiyi Li. Research on pharmaceutical and its preparation particle size distribution analysis. [J]. CHP standard, 2012, 13(6): 405.
Acknowledgments
Produced from materials originally authored by Dr. Xuebing Li, Shiqi Liu, Mei Li, and Liyang Xu from Bettersize Instruments.
About Bettersize Instruments

With over 25 years experience developing and manufacturing particle characterization instruments, Bettersize has introduced breakthrough technology in the field of particle size & shape measurement.
By achieving high quality and superior performance, our instruments provide precise analysis results of particle size, particle shape, and powder characteristics, helping scientists and engineers to understand material properties, facilitate research and improve production efficiency.
Bettersize product line for particle size and shape analysis includes instruments of all needs and budgets, from basic to advanced research models. These instruments are widely applied in Pharmaceuticals, Battery materials, Mining and minerals, Metals, Chemicals and Surface coatings, measuring materials with size ranges from nanometer to millimeter.
Focused on technology innovation, instruments manufacturing, application support and after-sales services, Bettersize provides expertise and professional solutions and assures customers the highest confidence in our products.
Sponsored Content Policy: News-Medical.net publishes articles and related content that may be derived from sources where we have existing commercial relationships, provided such content adds value to the core editorial ethos of News-Medical.Net which is to educate and inform site visitors interested in medical research, science, medical devices and treatments.