There are several benefits to incorporating hot melt extrusion (HME) processes into pharmaceutical industry manufacturing workflows, particularly when mixing an active pharmaceutical ingredient (API) with a polymer binder to improve its delivery and bioavailability.
Strict monitoring and control of HME parameters and processes help ensure quality and consistency. Fourier transform near-infrared (FT-NIR) spectroscopy provides a straightforward means of directly analyzing process samples.
FT-NIR can be used alongside chemometrics to enable the development of a suitable partial least square (PLS) and/or principal component analysis (PCA) model that allows users to explore the utility of spectral responses as an indication of HME process stability.
HME is gaining considerable interest in the pharmaceutical industry due to its significant manufacturing efficiency and an array of economic benefits.1
HME is primarily a mechanical/shear mixing process that sees an API melted, mixed and bonded with thermoplastic polymers and/or other suitable materials.
Carefully designed polymers offer the potential to improve bonding structure, boost drug bioavailability and achieve distinct drug delivery profiles.2,3,4
It is necessary to ensure precise control of HME parameters if consistent product quality is to be ensured, for example, screw design, zone temperature, rotational speed and residence time.
A comprehensive understanding of critical parameters is also key to implementing an efficient process control strategy in line with the FDA’s quality by design (QbD) initiative.5, 6
Using a combination of FT-NIR spectroscopy and statistical regression methods allows users to utilize direct sample measurement to achieve near real-time chemical information at the molecular level.
FT-NIR is frequently employed as a process analytical technology (PAT) and QbD tool during process development and manufacturing. Its primary role is to monitor and control drying, blending, and extrusion processes.7,8
FT-NIR is an easy-to-use, rapid and non-destructive technique ideal for matrix analysis. It is highly sensitive to a blend’s API concentration and can help users to visualize interactions between an API and its binding polymers.
NIR spectra are multivariate, which means that they can be influenced by the physical, chemical and structural properties of all the species present. Chemometrics employs a series of mathematical and statistical procedures, including PLS and PCA, to facilitate the multivariate analysis of large datasets.
This article explores the use of FT-NIR as part of an HME process, enabling in-line API concentration monitoring. It also outlines the factors involved in deriving an appropriate PLS model while exploring the viability of using NIR spectral responses via PCA as an indication of HME process stability.
Methods
An 11 mm twin-screw extruder was used for the HME processes - the Thermo Scientific™ Process 11. A Thermo Scientific™ Antaris™ II MDS FT-NIR spectrometer equipped with an HME diffuse reflectance probe was employed in the study’s spectral acquisition.
The reflectance probe featured standard 1/2-20 UNF mounting threads, allowing it to be screwed into an exit block sensor port between the exhaust gas vent and the exit orifice.
A metal reflector was placed ~2 mm from the probe on the opposite side in order to enhance the NIR signal of the hot melt translucent liquid at the sampling location.
An electric heater was controlled by the extruder PLC, maintaining a temperature of 120 °C with deliberate fluctuations of +/-10 °C.
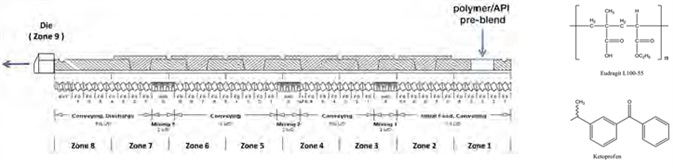
Figure 1. Configuration of the Thermo Scientific Process 11 Twin Screw Extruder. Image Credit: Thermo Fisher Scientific – Materials & Structural Analysis
Figure 1 displays the screw profile design, process configuration, effective length-to-diameter ratio (L/D), and a total of three mixing zones.
Both the API (ketoprofen) and a pre-blended polymer (Eudragit® L100-55) were fed into the extruder at Zone 1. Zones 2 through 8 were utilized as mixing, conveying and discharge zones, while the Zone 9 die reduced the barrel configuration to a single circular orifice.
Experiments were performed using a 50:50 (w/w) target API:polymer blend. A temperature of 120 °C was maintained in the mixing and melting zones with a 100 g/hr feed rate.
NIR data was obtained using the Thermo Scientific™ RESULT™ v3 software. This packaged offered a 4000 - 10000 cm-1 spectral range, 8 cm-1 resolution and a 16 scan average at a rate of 8 s/spectrum.
The transmission sampling module allows the acquisition of background reference spectra prior to each experiment.
Results and discussion
Building a PLS model to monitor API concentration for HME
In order to develop a calibration model that is able to predict the API concentration during HME, a pre-blend API/polymer ratio ranging from +/- 10% of the 50% target API ratio was used. Process temperature was set to 120 °C featuring +/- 10 °C disturbances, and the feed rate was maintained at 100 g/hr.
Following each API ratio change, sufficient time was permitted to ensure a steady state was attained before another change occurred.
Spectral data was acquired at 20-second intervals during steady states, with these measurements performed at a range of temperatures. The calibration sample set contained a total of 85 spectra at 40%, 45%, 47.5%, 50%, 52.5%, 55% and 60% ratios.
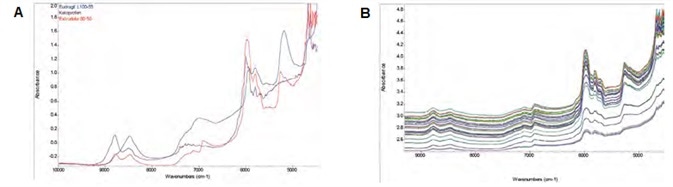
Figure 2. (A) Absorption NIR spectra of API, polymer, and a 50/50 (w/w) extrudate in full scale. (B) Transflectance NIR spectra in common scale acquired during extrusion. Image Credit: Thermo Fisher Scientific – Materials & Structural Analysis
Figure 2A displays the overlaid NIR spectra of ketoprofen, Eudragit and 50:50 (w/w) extrudate.
As ketoprofen and Eudragit exist as powders at room temperature, an integration sphere module and an Antaris II spectrometer were used to measure these spectra. An NIR HME probe was used to acquire the extrudate spectrum during an extrusion.
All spectra exhibited strong features in the first overtone C-H stretching region (~6000 cm-1), with both Eudragit and the extrudate exhibiting observable peak features in the first overtone O-H stretching region (~6900 cm-1).
Figure 2B features overlaid NIR spectra of calibration samples alongside an observable baseline up-drift. This is possibly attributable to scattering air bubbles during the HME process, as well as a variation in effective pathlength.
The Norris second derivative10 was applied to raw spectra to eliminate baseline drift, while a standard normal variant (SNV) was also used to minimize spectral pathlength variation.
A PLS model11 was derived to estimate the ketoprofen concentration – this was done using the Thermo Scientific™ TQ Analyst™ software (mean-centered spectral data; 5500-6650 cm-1 spectral range; 73 spectra for calibration and 12 for validation). Significant model factors were determined via Leave-One-Out cross validation.
The number of notable PLS factors represents independent variables that impact sample spectral responses, for example, impurities, density, concentration, opaqueness or color.
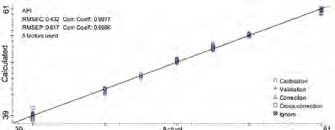
Figure 3. Calibration results of API measurement. Image Credit: Thermo Fisher Scientific – Materials & Structural Analysis
Figure 3 displays the developed PLS model with a 0.43% root mean squared error of calibration (RMSEC), a 0.998 correlation coefficient and a 0.62% root mean squared error of prediction (RMSEP).
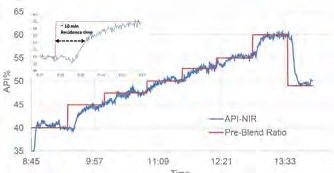
Figure 4. Overlay of the pre-blend profile and the API% trend based on the PLS model. Image Credit: Thermo Fisher Scientific – Materials & Structural Analysis
Figure 4 displays the calibration model applied to HME process spectra, highlighting the predicted API% tracking to the pre-blend profile. Assuming a residence time of ~10 minutes, it, therefore, takes 2-3 multiples of that time (~20-30 minutes) to properly establish a new steady state following a ratio change.
Process stability monitoring with PCA
Continuous manufacturing requires the production process to be controlled in a steady state to safeguard production and product quality.
An HME process (with extrusion temperature, material flow rates, screw speed and related variables) is traditionally considered to be present at its steady state when operational parameters (for example, pressure, torque and material temperature) reach their equilibria.
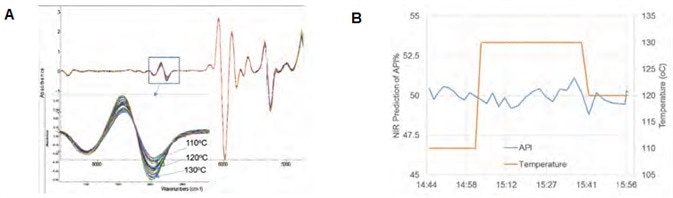
Figure 5. Process temperature robustness study: (A) temperature impact on NIR spectra; and (B) prediction of API% with a +/- 10 °C temperature variation. Image Credit: Thermo Fisher Scientific – Materials & Structural Analysis
NIR spectra can provide chemical information on samples – for example, their blending ratio and API/binder interactions – while also being sensitive to the sample’s physical properties – such as its color, temperature and density.
Overall, NIR offers a comprehensive, intelligent and responsive process indicator for product quality control.
In order to develop a successful chemometrics model, it is necessary to extract the relevant multivariate NIR spectral data. The study presented here simulated potential fluctuations during manufacturing by introducing varying feed rates and temperatures as process disturbances.
Sample spectra were acquired at 20-second intervals and raw data was processed with the 2nd derivative and SNV in order to eliminate spectral baseline drift and variations in spectral path length. The PCA calculation was performed across the 9150 to 4710 cm-1 region.
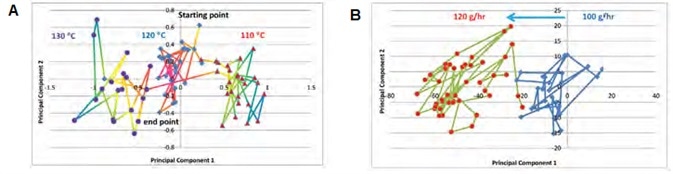
Figure 6. PC score plot of (A) temperature response and (B) feed rate response. Image Credit: Thermo Fisher Scientific – Materials & Structural Analysis
Figure 6A shows a PC score plot of the temperature response experiment. This experiment began with a 120 °C process temperature while maintaining a consistent feed rate of 100 g/hr. Sample spectra were found to form a tight cluster of PC points (middle) in the PC domain.
Once the process had stabilized, a 10 °C decrease was then introduced, causing the spectral response to change accordingly. This prompted the resulting PC data point to move away from that cluster after about 6 sampling times (~ 2 minutes) to form a new cluster locus.
Comparable PC point movement was noted for the temperature change (110-130 °C), with the distance between two clusters representing a property shift in the hot melt.
Figure 6B shows a PC score plot of the feed rate response experiment. Here, the temperature was maintained at 120 °C and the process began with a 100 g/hr material feed rate, increasing the feed rate to 120 g/hr once this had stabilized.
It should be noted that the API concentrations for the temperature and feed rate experiments are different; therefore, the PC1 / PC2 ranges are different in each plot.
PCA defines its principal component (PC) domain space via an iteration of information extraction from a calibration sample set.
Each sample spectrum consists of thousands of data points, requiring these to be converted into a reduced (for example, 2D or 3D) data point in a PC domain.
The number of dimensions in a PC domain is defined by the number of influencing variables; for example, concentration, sample color, density or degree of cross-link.
The initial PCs cover most of the spectral information, while scores or coefficients of PCs can be regarded as projections of a measured sample spectrum in a PC domain.
Converting a spectrum into a PC point allows responses during an HME process to be displayed in a 2D or 3D trend plot.
NIR spectra directly measure the extrudate, meaning that the trajectory of PC coordinates can effectively represent an HME process state, offering highly beneficial insight into process dynamics and facilitating the development of a comprehensive control strategy.
Conclusions
Continuous manufacturing necessitates the use of robust in-process monitoring of critical process parameters to ensure consistent product quality; for example, the use of FT-NIR coupled with chemometrics modeling for in-line HME monitoring is explored here.
In the example outlined here, a PLS model was developed for use in API concentration prediction via the careful selection of relevant NIR spectral regions.
This model was proven to be robust, offering a +/- 10 °C fluctuation. A PCA-based model was developed to monitor the process state shift in response to disturbances in feed rate and temperature.
The NIR spectrum is a direct measurement of the extrudate product, meaning that the trajectory of the PC movement has the potential to provide valuable insight into process dynamics.
The PCA method only needs an accumulation of multiple batches of good process spectral data to accurately define the steady state. This straightforward method does not necessitate the use of a calibration model while being wholly independent of the product formulation.
NIR is rapid and non-destructive, allowing a NIR-based quality monitoring methodology to be easily transported from process development to manufacturing.
References
- Schaber S.D., Gerogiorgis D.I., et al. Ind. Eng, Chem. Res., 2011, 50:17, 10083-10092.
- Thiry J., Krier F., Evrard B. Int. Pharmaceut., 2015, 479:1, 227-240.
- Breitenbach J. Eur. J. Pharm. Biopharm., 2002, 54:2, 107-117.
- Crowley M.M., Zhang F., et al. Drug Dev. Ind. Pharm., 2007, 33:9, 909-926.
- FDA Guidance for Industry. PAT – a framework for innovative pharmaceutical development, manufacturing, and quality assurance. Rockville, MD: Food and Drug Administration, 2004.
- ICH Q8(R2), Pharmaceutical Development, Part I: Pharmaceutical development, and Part II: Annex to pharmaceutical development, 2009.
- Markl D., Wahl P.R., et al. AAPS PharmSciTech, 2013, 14:3, 1034-44.
- MacPhail N., Meyer R.F, et al. Spectroscopy Special Issues, 2011, 26:8.
- Abdi H. and Williams L.J., Wires. Comput. Stat., 2010, 2, 433-459.
- Rinnan A., van den Berg F., Engelsen S.B. Trends Anal. Chem., 2009, 28:10, 1201-1222.
- Geladi P. and Kowalski B.R., Anal. Chim. Acta, 1986, 185, 1-17.
Acknowledgments
Produced from materials originally authored by Herman He, Scott Martin, and Rui Chen from Thermo Fisher Scientific; and Anh Vo and Michael Repka from the School of Pharmacy, University of Mississippi.
About Thermo Fisher Scientific – Materials & Structural Analysis
 Thermo Fisher Materials and Structural Analysis products give you outstanding capabilities in materials science research and development. Driving innovation and productivity, their portfolio of scientific instruments enable the design, characterization and lab-to-production scale of materials used throughout industry.
Sponsored Content Policy: News-Medical.net publishes articles and related content that may be derived from sources where we have existing commercial relationships, provided such content adds value to the core editorial ethos of News-Medical.Net which is to educate and inform site visitors interested in medical research, science, medical devices and treatments.