Biopharmaceuticals (or biologics) are produced using biological-expression systems (such as mammalian, bacterial, insect cells, etc.), which have spawned a vast biopharmaceutical industry (BioPharmacueticals) that is continually expanding.
The structural and chemical complexity of biologics, in combination with elaborate cell-based manufacturing, presents an enormous analytical burden to properly characterize and quantify both processes (upstream) and products (downstream).
In small-molecule manufacturing, breakthroughs in analytical and computational methods have been exploited extensively to produce process analytical technologies (PAT) that are now utilized as a standard for process control, yielding safer medicines and more efficient processes.
Raman spectroscopy is a vibrational spectroscopy technique with numerous useful properties (non-destructive, non-contact, high molecular-specificity and robustness) that make it well-suited for PAT applications that require molecular information (composition and variance).
Common good manufacturing practice (GMP) operations require an extensive set of tests to be conducted in accordance with approved specifications before the material is released for further processing or on to the market.
However, recent ICH guidelines (ICH Q8, Q9, Q10 and Q11) indicate an alternative real-time release strategy to deliver assurance of product quality prior to release. Real-time release testing utilizes the principles of the pharmaceutical Quality by Design (QbD) to significantly improve release and stability testing.
Thus, through a combination of understanding the manufacturing process, process control and product knowledge, it is possible to demonstrate that the material was made in line with GMP requirements.
Depending on the process requirements, the exact real-time release testing to (RTRT) approach will vary. The RTRT strategy may be contingent on the control of process parameters, monitoring of product attributes or on a combination of both at the relevant steps throughout the process.
It is critical that the RTRT strategy should be predicated on a comprehensive understanding of the process and the relationship between process parameters, in-process material attributes and product attributes.
Cost, quality and speed are the principal drivers for the implementation of in-line at-line monitoring and real-time release.
Highlighting some of the most critical applications of Raman spectroscopy in the analysis and manufacturing of biopharmaceuticals, this article evaluates two aspects of the bio-manufacturing process: identity/variance testing of raw materials and cell culture media, to multi-attribute product testing of a biologic drug product, or final product testing of a biologic drug product.
Raw material characterization
Today, accepting raw materials is often based on small-scale functional testing and/or limited analytical methods, which may not be a complete indicator of at-scale performance. In some cases, this leads to a fluctuation in process outputs and, in the worst cases, not meeting predefined release criteria.
Numerous clinical products are developed using a reduced number of batches which produces a limited range of raw material variation and, thus, a narrow understanding of the process.
In upstream cell culture, in particular, the sudden variability of various components of the cell culture media can influence a product’s micro-heterogeneity and its critical quality attributes (CQA).
For high-risk raw materials, multi-attribute tests may be necessary, such as identity tests, quantitative tests for the concentration of key ingredients in raw material, batch-to-batch variability tests and degradation tests. One such raw material encountered in biologics manufacturing is cell culture media.
Identification of cell culture media samples using conventional LC methods, including amino acid or vitamin analysis, is expensive and necessitates considerable levels of analytical expertise and large laboratory space.
Raman spectroscopy provides numerous potential benefits, for instance, low cost, portability and conceivably limited skill levels required to operate the instruments.
Buffers are another key set of raw materials used in downstream manufacturing. Osmolality is a measure of concentration and is believed to be a vital quality attribute and crucial process parameter in bioprocessing.
The quality and yield of a biologic highly depend on the optimization of the downstream process. In combination with Osmolality of buffers, identity testing can be performed using a multi-attribute method based on Principal component analysis and Partial list squares.
High-speed testing of buffers through single-use flexi bags can be conducted using the fiber optics probe of the Thermo Scientific™ DXR3 SmartRaman Spectrometer at the point-of-use with sample preparation rendered unnecessary.
Final product identity testing
Another key regulatory requirement is the final product identification of biologics pre- and post-shipment. Significant analytical challenges occur during product testing for identity test due to the various kinds of primary packaging (glass vials, syringes, glass bottles) used in the manufacturing of biologics.
Fill finish sites may not possess the analytical expertise necessary to perform the tests and may have to send the samples to the parent site or external lab for testing, incurring costs in terms of both time and money.
Small molecule drug products or biologics will also endure retesting upon importation from a third country in the EU member state, or vice versa in the USA when drug products have been received from other countries.
A complete list of tests is usually performed, including final product Identity testing. For biopharma manufacturers, this requires either employing third-party labs in the country of import or shipping the samples back to the parent site for analysis.
This leads to a significant increase in costs and causes delays in the delivery of essential drug products.
End product identity testing/final product identity testing of biologics after fill-finish or pre-shipping to the fill-finish line is performed by a wide range of analytical techniques contingent on the molecule/registration dossier.
For instance, the verification test for biologic proteins is peptide mapping – a long-standing workflow approach for protein identification using LC/MS.
This complex separation technique necessitates protein extraction and clean-up, enzyme digestion, one or more stages of liquid chromatography and two phases of mass spectrometry prior to matching the final spectrum against protein databases.
However, a standard methodology of peptide mapping requires an analytical lab with qualified technical resources. This necessitates prolonged preparation times and introduces significant costs in solvents, columns and analytical equipment.
The DXR3 SmartRaman Spectrometer, with its high sensitivity and resolution, facilitates the characterizing of the drug product by assessing the fingerprint region of the molecule.
Therefore, the special capability of the DXR3 SmartRaman spectrometers with sampling flexibility guarantees repeatable measurements, and additional analysis enables rapid method development and deployment.
A feasibility study for multinational drug manufacture was conducted. The primary objective was to set up a rapid multi-attribute end product test to differentiate 15 types of drug products and establish the concentration of the two preservatives in the drug products.
For this feasibility test, 15 different types of biologic drug products that varied in concentration from 0.5 mg/ml to 6 mg/ml were provided. Concentration of two preservatives, A and B, ranged from 0.85 mg/ml to 5.0 mg/ml and 0.42 mg/ml to 3.91 mg/ml respectively.
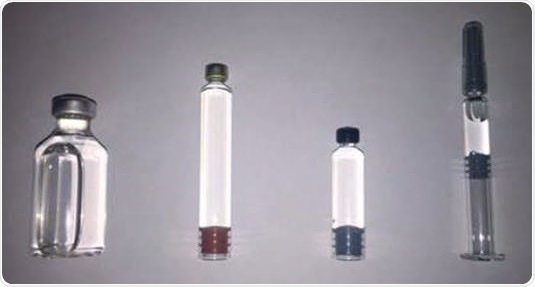
These commercial drug products were dispensed in their standard glass vials that varied in size and volume. An example picture of these glass vials is shown below:
Characteristic Raman band assignment. Image Credit: Thermo Fisher Scientific – Materials & Structural Analysis
For the conclusive product identity test and quantitative measurement of two preservatives in the final drug product, a reversed-phase high-performance liquid chromatographic (HPLC) was used.
DXR3 SmartRaman Spectrometer with universal sampling plate and 180-degree sampling module was utilized for the acquisition of spectra of 15 drug products. One minute of scanning time and 532 nm laser with 40 mW power was employed to obtain each distinct spectrum.
The acquisition of ten spectra was achieved for each sample to adjust to the variability of glass vials and scattering effects. Additionally, it offers exceptional selectivity, repeatability and full wavelength range for the characterization of biologics based on the characteristic band assignment.
Source: Thermo Fisher Scientific – Materials & Structural Analysis
| Band frequency (cm-1) |
Region |
Vibrational mode |
Protein structure assignments |
| 870-1150 |
Backbone, skeletal stretch |
Cα-C, Cα-Cβ, Cα-N |
Secondary structure elements: α-helix, β-sheets, less-ordered structure |
| 1200-1340 |
Amide III |
N-H in-plane, Cα-N stretch |
Hydrogen bonding, secondary structure |
| 1400-1480 |
Side chain deformations |
CH2 and CH3 deformations |
Local environments, intermolecular interactions of side chains |
| 1510-1580 |
Amide II |
N-H deformations and C-N stretch (observed in UVRR and not conventional Raman spectra) |
Local environments, intermolecular interactions of side chains |
| 1630-1700 |
Amide I |
C=0 stretch NH in-plane bending |
Secondary structure elements: α-helix, β-sheet, less-ordered structure |
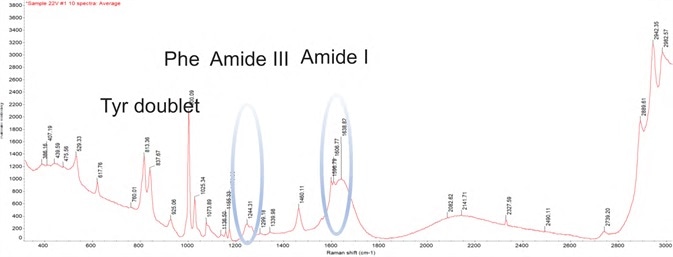
Figure 1. DXR3 SmartRaman spectrum showing characteristic bands of a biologic drug product. Image Credit: Thermo Fisher Scientific – Materials & Structural Analysis
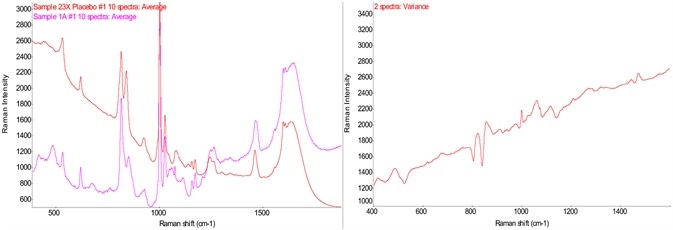
Figure 2. Raman spectra of drug product and its placebo and variance spectrum. Image Credit: Thermo Fisher Scientific – Materials & Structural Analysis
Figure 2 demonstrates the spectra of a sample containing a drug product against its placebo. It is crucial to determine the technique chosen for a feasibility study. In this instance, Raman spectroscopy is sensitive enough to identify the differences between the drug product and its placebo.
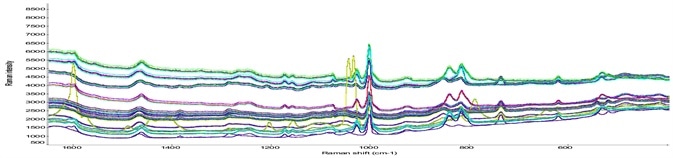
Figure 3. Raman spectra of different classes of drug products. Image Credit: Thermo Fisher Scientific – Materials & Structural Analysis
DXR3 SmartRaman Spectrometer grants high sensitivity to establish any of the considerable disparities between placebo and actual drug products. Figure 3 shows the spectra of various classes of drug products.
These spectra were used to create the discriminant analysis method on the Thermo Scientific™ TQ Analyst™ Software. TQ Analyst Software is a verified qualitative and quantitative method building software that provides full compliance in pharmaceutical applications.
The discriminant analysis classification technique can be employed for the characterization of the class or classes of known materials that closely resemble an unknown material by computing the unknown’s distance from each class center in Mahalanobis distance units.
The discriminant analysis technique is frequently used to screen incoming materials or final products to establish whether compound/molecule a, b or c. Discriminant Analysis methods tend to specify at least two classes of known materials, but the method functions just as well with just one class.
Multiple standards can be employed to characterize each class (at least one class must contain two or more standards). Multiple regions of the spectrum may be utilized for the analysis.
What does discriminant analysis do?
To establish which class of standards is most like the unknown, a discriminant analysis method applies the spectral information in the specified region or regions of an unknown sample spectrum to a stored calibration model.
When the method is employed for the analysis of an unknown sample or a class, the software conducts a principal component analysis on the spectra of the standards and utilizes those results to establish score values for the unknown sample spectrum.
The score plots are then used to generate Mahalanobis distance values, which in turn are used for the ranking of the classes. The result of discriminant analysis is the name of the class or classes that closely resemble the spectrum of the unknown sample.
The Mahalanobis distance between the unknown sample and each reported class can also be recorded. The better the match, the closer each distance value is to zero.
After plotting the cross-validation principal component scores, they disclosed that the class differentiation and the report established all the classes of the various products were identified correctly and there were no mismatches to indicate the false positives.
Quantitative analysis of biologics for preservative A and preservative B
As part of this feasibility study, the client wanted to determine if the DXR3 SmartRaman Spectrometer test could be used in place of the HPLC test for measuring the concentration of two preservatives in their drug products: level of preservative A was 0.85 mg/ml to 5 mg/ml and that of preservative B was 0.32 mg/ml to 4.91 mg/ml.
Pure samples of preservatives A and B were received for reference and to establish their presence in the final drug formulation.
Source: Thermo Fisher Scientific – Materials & Structural Analysis
Actual
class |
Mismatch |
Calculated
class |
Calculated
distance |
Next
class |
Next
distance |
| Product D |
|
Product D |
0.5809 |
C |
4.5556 |
| Product A |
|
Product A |
1.9869 |
I |
12.9617 |
| Product B |
|
Product B |
1.3796 |
E |
25.1324 |
| Product C |
|
Product C |
0.5417 |
D |
3.8568 |
| Product D |
|
Product D |
0.8466 |
M |
9.0495 |
| Product I |
|
Product I |
1.7709 |
A |
13.9064 |
| Product M |
|
Product M |
0.5284 |
S |
3.3881 |
| Product O |
|
Product O |
0.2244 |
X |
17.3044 |
| Product R |
|
Product R |
0.5419 |
C |
4.4691 |
| Product T |
|
Product T |
0.5944 |
X |
2.3213 |
| Product X |
|
Product X |
0.79 |
T |
3.1646 |
| Product S |
|
Product S |
1.1837 |
M |
3.0829 |
| Product N |
|
Product N |
1.0954 |
U |
15.1798 |
| Product U |
|
Product U |
0.1603 |
T |
9.1738 |
| Product S |
|
Product S |
1.8544 |
N |
22.1624 |
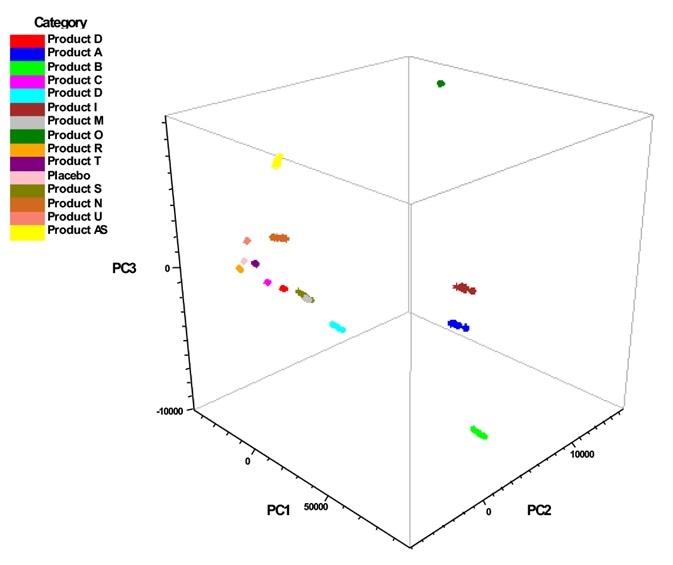
Image Credit: Thermo Fisher Scientific – Materials & Structural Analysis
Table 1. Calibration and validation sample. Source: Thermo Fisher Scientific – Materials & Structural Analysis
| |
Preservative A
(mg/ml) |
Preservative B
(mg/ml) |
Standard 1
3 mL and 10 mL |
0.85 |
0.42 |
Standard 2
3 mL and 10 mL |
1.27 |
1.12 |
Standard 3
3 mL and 10 mL |
1.57 |
1.75 |
Standard 4
3 mL and 10 mL |
3.07 |
2.57 |
Standard 5
3 mL and 10 mL |
5.07 |
3.91 |
| Validation – 3 mL |
1.57 |
1.75 |
Table 2. Validation result for 3 ml sample. Source: Thermo Fisher Scientific – Materials & Structural Analysis
| |
PLS results for 3 mL Cartridge |
| |
Preservative A
(mg/ml) |
Preservative B
(mg/ml) |
| Validation sample: 3 mL |
1.58 actual 1.57 |
1.71 actual 1.75 |
| Real Sample in solution: 3 mL |
1.56 actual 1.55 |
1.69 actual 1.77 |
| Real sample in suspension: 3 mL |
0.72 actual 0.69 |
1.23 actual 1.58 |
Samples of varying concentrations, as shown in Table 1, were obtained using the same parameters of spectra as acquired for the identity test through 3 ml vial. Figure 6 exhibits the spectra of the drug product with both preservatives.
Five standards with the reference values were received in 3 ml and 10 ml vials and a validation sample to test the model for 3 ml and 10 ml vials. This range of solutions resulted in 15 spectra that were subsequently used for the creation of the chemometric method.
Using a DXR3 SmartRaman Spectrometer, the final drug product samples were scanned to obtain a complete spectral range of 3500 to 50 cm-1, captured with a single exposure of the CCD, evading any stitching artifacts.
Three spectra were collected per sample and the sample time took approximately 1 minute. The sample spectra were loaded into Thermo Scientific TQ Analyst Software for chemometric analysis utilizing the Partial Least Squares (PLS) method.
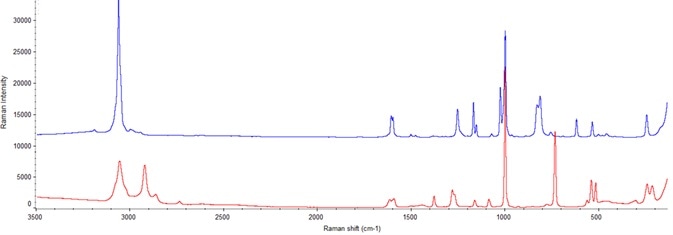
Figure 5. Spectrum in blue is from pure preservative A and spectrum in red is from pure preservative B. Image Credit: Thermo Fisher Scientific – Materials & Structural Analysis
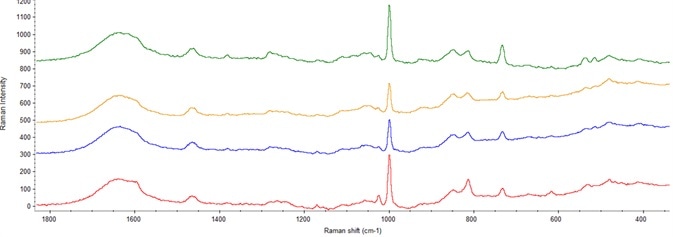
Figure 6. Spectra showing varying concentration of preservatives in final drug product. Image Credit: Thermo Fisher Scientific – Materials & Structural Analysis
Results
Partial Least Squares (PLS) analysis of the conclusive drug product samples demonstrated outstanding predictive capabilities within the range of materials tested.
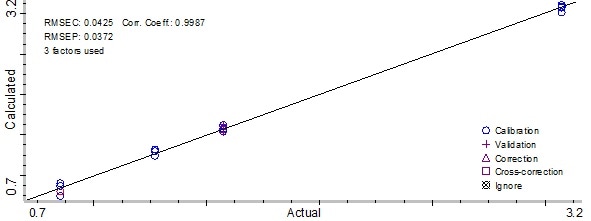
Figure 7. Partial Least Square model result for preservative A. Image Credit: Thermo Fisher Scientific – Materials & Structural Analysis
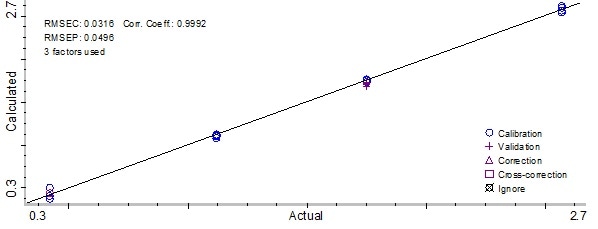
Figure 8. Partial Least Square model result for preservative B. Image Credit: Thermo Fisher Scientific – Materials & Structural Analysis
The 15 spectra utilized for the development of the PLS method are exhibited on calibration plots (Figure 7 and Figure 8) that contrast the calculated preservative concentrations against the actual concentrations.
The calibration plot can be employed to ascertain how effective the method is when predicting the actual preservative concentrations in the samples. The plot created using the chemometric method produced a correlation coefficient of 0.998 for preservative A.
Root Mean Square Error of Calibration (RMSEC) was 0.0425 mg/ml, and the Root Mean Square Error of Prediction (RMSEP) calculated was 0.0372 for preservative A. In addition, the method used for preservative B produced a correlation coefficient of 0.999.
Root Mean Square Error of Calibration (RMSEC) was 0.0316 mg/ml, and the Root Mean Square Error of Prediction (RMSEP) calculated was 0.0496. When 10 ml vial calibration samples were added to the PLS method, method performance stayed the same and accurately predicted the 10 ml validation sample.
Conclusions
A multi-attribute test to determine Final product identification and predicting concentrations of preservatives was performed with the DXR3 SmartRaman Spectrometer by designing a discriminant analysis method and partial least square technique.
The final drug product identification test is part of release testing. Current methods, however, are time-consuming and labor-intensive. This Raman technique successfully demonstrates the ability to measure and monitor preservative concentrations either in the lab environment or at the line.
The developed method demonstrates exceptional correlation with actual preservative concentrations with errors equivalent to the reference analysis method.
This application continued to successfully demonstrate the capacity of the DXR3 Raman Spectrometer for use in bioprocess environments when conducting multi-attribute final product testing of biologics.
Besides the examples discussed here, DXR3 SmartRaman Spectrometer can be employed to implement at-line control strategies for the monitoring of protein concentration, excipients concentration and key quality attributes like Osmolality and pH.
A number of examples are cited in the literature for Raman applications in biopharma manufacturing.
Table 3. Calibration and validation results for 3 ml 10 ml vials. Source: Thermo Fisher Scientific – Materials & Structural Analysis
| |
PLS 3 mL cart and 10 mL vials |
| |
Preservative A
(mg/ml) |
Preservative B
(mg/ml) |
| Validation sample: 3 mL |
1.58 actual 1,57 |
1.71 actual 1,75 |
| Real sample in solution: 3 mL |
1.56 actual 1.55 |
1.65 actual 1.77 |
| Real sample in suspension: 3 mL |
0.80 actual 0.69 |
1.21 actual 1.58 |
| Real sample in suspension: 10 mL |
0.73 actual 0.68 |
1.32 actual 1.57 |
References
- European Medicines Agency. Guideline on Real Time Release Testing. https://www.ema.europa.eu/en (accessed June 15, 2021).
- Buckley, Kevin, & Ryder, Alan G. (2017). Applications of Raman Spectroscopy in Biopharmaceutical Manufacturing: A Short Review. Applied Spectroscopy, 71(6), 1085-1116. https://aran.library.nuigalway.ie/handle/10379/7177 (accessed June 15, 2021).
About Thermo Fisher Scientific – Materials & Structural Analysis
 Thermo Fisher Materials and Structural Analysis products give you outstanding capabilities in materials science research and development. Driving innovation and productivity, their portfolio of scientific instruments enable the design, characterization and lab-to-production scale of materials used throughout industry.
Sponsored Content Policy: News-Medical.net publishes articles and related content that may be derived from sources where we have existing commercial relationships, provided such content adds value to the core editorial ethos of News-Medical.Net which is to educate and inform site visitors interested in medical research, science, medical devices and treatments.