Raman imaging and scanning electron microscopy (SEM) was used to investigate acetaminophen solid dispersions prepared by hot melt extrusion (HME). This experiment confirmed that a high screw speed favors the formation of an attractive amorphous dispersion.
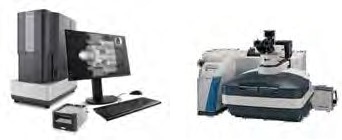
Phenom XL Desktop SEM (left) and Thermo Scientific DXR3xi Raman Imaging Microscope (right). Image Credit: Thermo Fisher Scientific – Materials & Structural Analysis
Raman imaging offers a molecular-level illustration of the solid physical states of these extrudates by enabling useful visualization of the distribution of multiple chemical species.
On the other hand, SEM offers excellent spatial resolution, making it an ideal option for monitoring HME particle size reduction – particularly at the sub-µm scale.
Raman and SEM can, therefore, be used alongside one another to provide a holistic insight into the HME process.
The pharmaceutical industry employs hot melt extrusion in the preparation of solid dispersions of poorly soluble active pharmaceutical ingredients (APIs) and in the creation of controlled-release medications.1
APIs are compounded with a thermoplastic polymer matrix, the role of which is to act as a solid solvent for the drug molecules. This is then extruded to form a solid dispersion.
An amorphous API dispersion is considered beneficial from a solubility perspective due to its lack of lattice energy. From a post-manufacturing perspective, this also reduces the risk of physical change or aggregation.
A range of analytical techniques have been employed in the characterization of hot melt extrudates’ physicochemical factors relevant to HME process design and optimization.2,3,4,5
Previous studies have explored the use of Terahertz (THz) Raman imaging in the characterization of the solid physical states of acetaminophen (APAP) in a hydroxypropyl methylcellulose (HPMC) matrix that has been prepared using HME.6
Raman imaging can distinguish between crystalline and amorphous APAP, allowing it to effectively map the APAP distribution in HPMC.
The spatial resolution of this visualization is limited to ~1 µm, but it is possible to achieve a higher, nm-scale spatial resolution using scanning electron microscopy.
SEM yields images with a characteristic 3D appearance and is widely used to probe the surface morphology of extrudates – particularly crystalline structures.
The correlation of solid physical state changes and molecular-level interactions with morphological variations allows the combination of Raman and SEM to offer holistic insight into complex and multifaceted HME processes.
This article discusses the use of THz Raman imaging and SEM to investigate the solid physical states of APAP in the HPMC matrix prepared by HME. It also aims to analyze and compare extrudates from two different HME processes at different screw speeds in order to evaluate the impact on the formation of solid dispersions.
Experiment
Materials
Acetaminophen (APAP; Spectrum Chemicals, Gardena, CA) was selected as the model API - a crystalline BCS I drug exhibiting a melting point of 169°–170 °C.
Hydroxypropyl methylcellulose (HPMC; Ashland, Wilmington, DE) E5 was employed as the polymer matrix.
Hot melt extrusion
An 11 mm twin-screw extruder was used for the HME processes - the Thermo Scientific Process 11. Figure 1 displays the screw profile design and process configuration.
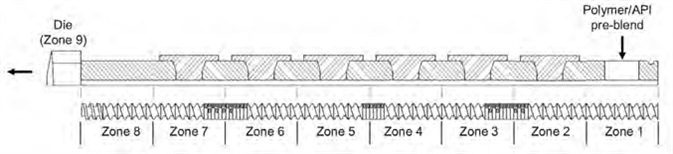
Figure 1. The Thermo Scientific Process 11 Twin Screw Extruder configuration. Image Credit: Thermo Fisher Scientific – Materials & Structural Analysis
Table 1. HME processes, parameters, and zones analyzed. Source: Thermo Fisher Scientific – Materials & Structural Analysis
HME
Process |
Extrusion
Temp. (⁰C) |
Screw
Speed (rpm) |
Feeder Screw
Speed (rpm) |
Zones
Analyzed |
| H |
170 |
200 |
24 |
Z3, Z7 |
| L |
170 |
50 |
6 |
Z3, Z7 |
The feeding zone was set to Zone 1, while Zones 2 through 8 were used as mixing, conveying and discharge zones. Zone 9 is a die designed to reduce barrel configuration to a single 5-mm diameter circular orifice.
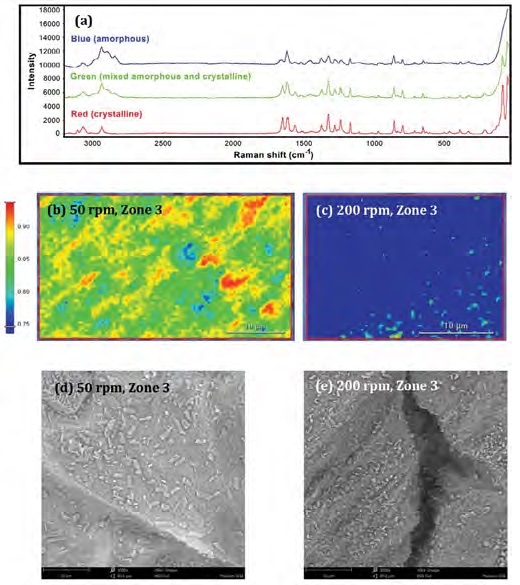
Figure 2. a: Raman spectra from the blue, green and red regions. b-c: Raman images (100x objective; 0.5 μm pixel size) of the samples from Zone 3 extruded at 50 rpm or 200 rpm. d-e: SEM images of the same samples (3000x magnification). Image Credit: Thermo Fisher Scientific – Materials & Structural Analysis
Figure 2a displays representative Raman spectra of amorphous (blue), partially-amorphous (green) and crystalline APAP (red). A strong, sharp peak can be observed at 89 cm-1 – this is unique to crystalline APAP and can be attributed to crystalline lattice vibrations (phonon mode).
The spectra showing the amorphous and partially amorphous regions feature contributions from the polymeric matrix. Figure 2b and Figure 2c feature Raman images of Zone 3 samples from Process H (high 200 rpm screw speed) and L (low 50 rpm screw speed).
The sample contains primarily partially amorphous dispersion (green) and crystalline APAP (red) at the lower speed. At the higher speed, the sample is comprised of predominantly amorphous dispersion (blue). SEM can be seen to corroborate these findings (Figure 2d and Figure 2e).
The Process L sample (Figure 2d) shows noteworthy quantities of well-defined, rectangular crystal structures (crystalline APAP) alongside a range of smaller and irregular bulk-shaped particles (partially-amorphous solid dispersion) which ranged in size from sub-μm to 15 μm.
The Process H sample (Figure 2e) shows irregularly shaped particles (partially-amorphous solid dispersion) ranging in size from sub-μm to ~2 μm.
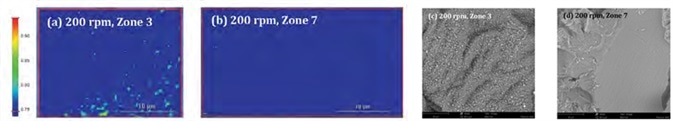
Figure 3. a-b: Raman images (100× objective; 0.5 μm pixel size) of the samples from Zones 3 and 7 extruded at 200 rpm. c-d: SEM images of the same samples 3000x magnification). Image Credit: Thermo Fisher Scientific – Materials & Structural Analysis
Figure 3a and Figure 3b display Raman images of samples from two distinct zones of Process H (200 rpm).
At the earlier stage (Zone 3, Figure 3a), it can be observed that the APAP was present in the form of partially amorphous (green) and amorphous (blue) solid dispersions.
At the later stage (Zone 7, Figure 3b), the sample exhibits almost uniform, amorphous solid dispersions (blue). These findings are consistent with SEM images (Figure 3c and Figure 3d).
The Zone 3 sample (Figure 3c) exhibits a high number of irregular bulk-shaped partially-amorphous solid dispersions, while the Zone 7 sample (3d) exhibits homogeneously mixed, uniform mass with a wrinkled surface, suggesting the presence of a near-complete amorphous dispersion.
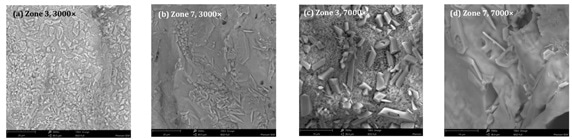
Figure 4. SEM images (a-b: 3000x magnification) and (c-d: 7000x magnification) of the samples from Zones 3 and 7 extruded at 50 rpm. Image Credit: Thermo Fisher Scientific – Materials & Structural Analysis
Figure 4 displays SEM images of samples from various zones of Process L (50 rpm). The Zone 3 sample (Figure 4a) exhibits morphological characteristics of both partially amorphous solid dispersion and crystalline APAP.
Zone 7 (Figure 4b) exhibits a generally smooth surface (amorphous solid dispersion), featuring pockets of well-defined partially-amorphous solid dispersion and crystalline APAP morphological features.
A higher magnification of 7000× (Figure 4c and Figure 4d) was used to examine these samples, revealing that the Zone 3 extrudate (4c) exhibits a rough, porous surface made up of a spherical texture, therefore, indicating its partially amorphous nature.
This sample also features smooth-surfaced rectangles and polyhedrons on top in the form of crystals.
The Zone 7 extrudate (Figure 4d) exhibits a dense, porous underlying surface that features both irregularly shaped particles and defined crystal structures that are partially embedded into its surface.
The presence of a mix of crystalline APAP, amorphous dispersion and partially amorphous solid dispersion towards the final stage of this HME process implies that the extrusion process used was extremely inefficient.
Conclusions
The study outlined here investigated acetaminophen solid dispersions prepared by HME. Raman imaging and SEM were used to compare extrudates from two different HME processes conducted at different screw speeds.
At the early stage, it was observed that low screw speed led to partially amorphous dispersion and crystalline APAP while high screw speed resulted in predominantly amorphous and partially amorphous dispersion.
However, at the late stage, high screw speed resulted in a uniform, homogeneously mixed surface suggestive of a near-complete amorphous dispersion. In contrast, low screw speed resulted in a dense surface with pockets of partially amorphous APAP and crystalline APAP dispersions.
The combination of Raman imaging and SEM analyses verified that a high screw speed is more likely to lead to the formation of amorphous APAP solid dispersion.
Raman offers excellent molecular-level insight into the underlying chemistry of an HME process, facilitating the beneficial visualization of multiple chemical species. SEM offers excellent spatial resolution potential, allowing users to monitor particle size, particularly in the sub-μm scale, effectively.
These are critical factors for users looking to better understand the solid physical state transformation of an API in HME.
References
- M.A. Repka, S. Bandari, et al., Int. J. Pharm. 535, 68–85 (2018).
- R. Censi, M.R. Gigliobianco, et al., Pharmaceutics 10, 89 (2018).
- S. Baghel, H. Cathcart, and N.J. O’Reilly, J. Pharm. Sci. 105, 2527-2544 (2016).
- P. Hitzer, T. Bäuerle, et al., Anal. Bioanal. Chem. 409, 4321–4333 (2017).
- N. Furuyama, S. Hasegawa, et al., Int. J. Pharm. 361, 12–18 (2008).
- M. Ibrahim, J. Zhang, et al., AAPS PharmSciTech 20, 62 (2019).
Acknowledgments
Produced from materials originally authored by Antonis Nanakoudis, Mohammed Ibrahim, and Rui Chen from Thermo Fisher Scientific.
About Thermo Fisher Scientific – Materials & Structural Analysis
 Thermo Fisher Materials and Structural Analysis products give you outstanding capabilities in materials science research and development. Driving innovation and productivity, their portfolio of scientific instruments enable the design, characterization and lab-to-production scale of materials used throughout industry.
Sponsored Content Policy: News-Medical.net publishes articles and related content that may be derived from sources where we have existing commercial relationships, provided such content adds value to the core editorial ethos of News-Medical.Net which is to educate and inform site visitors interested in medical research, science, medical devices and treatments.