Raman spectroscopy is a non-destructive investigative method for identifying and distinguishing chemical substances on a microscopic scale.
When coupled with chemometric approaches, it forms an analytical toolkit rooted in confocal microscopy and vibrational spectroscopy, enabling precise chemical profiling of heterogeneous materials at a sub-micrometer level.
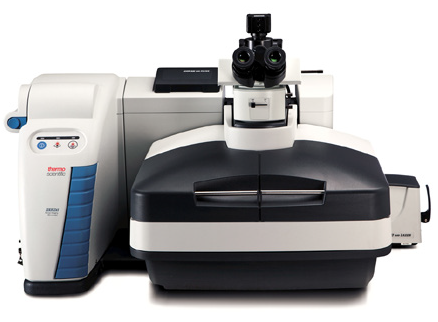
Thermo Scientific DXR3xi Raman Imaging Microscope. Image Credit: Thermo Fisher Scientific – Materials & Structural Analysis
Advantages of the DXR3xi Raman Imaging Microscope
- Ultrafast Raman Imaging with high sensitivity due to location-controlled stage and EMCCD detector.
- True confocal Raman microscope for diffraction-limited spectroscopy and high wavenumber accuracy.
- Optimum laser power fine-control to avoid sample damage.
- Perfect automatic 6-step alignment.
- OMNICxi imaging-centric software with 3D visualization.
Continuous manufacturing (CM) of pharmaceuticals is emerging as a new technological norm in the industry.
Currently, most pharmaceuticals are crafted through batch manufacturing, involving separate operations (e.g., weighing, mixing) conducted in distinct rooms and times. This protracted, multi-step process demands extensive equipment.
In contrast, continuous manufacturing is swifter and more scalable. It eliminates the need to halt and transfer intermediates between production steps, potentially enhancing the final quality of the pharmaceutical end-product.
In the study outlined in this article, the Thermo Scientific™ DXR3xi Raman Imaging Microscope was used to evaluate component distribution in liquisolid tablets produced with varying process parameters using the Thermo Scientific™ Pharma 16 Twin-Screw Extruder as a continuous processor.
The tablets incorporated either simethicone or a blend of simethicone and loperamide hydrochloride as active pharmaceutical ingredients (APIs). Detailed tablet compositions are outlined in Tables 1 and 2.
The powders’ particle size distribution (PSD) before manufacturing underwent analysis using a dynamic image analysis system. Physical tablet properties, including hardness, friability, and disintegration, were evaluated. Dosage uniformity was also assessed as per USP/NF Chapter <905> guidelines.2
Table 1. Composition of tablets S1-S3 produced with a twinscrew granulator (TSG) and HSG with a high-shear granulator. Source: Thermo Fisher Scientific – Materials & Structural Analysis
| Ingredient |
mg/Tablet |
Concentration
(%w/wt) |
Function |
| Simethicone Q7-2243 LVA |
125.0 |
17.0 |
Active ingredient |
| TRI-CAFOS® 500 (TCP) |
374.8 |
51.0 |
Carrier |
| DI-CAFOS® A150 (CDPA) |
220.4 |
30.0 |
Diluent/compression aid |
| Ac-Di-Sol® SD-711 NF |
7.4 |
1.0 |
Disintegrant |
| Ligamed® MF-2-V |
7.4 |
1.0 |
Lubricant |
| Total |
735.0 |
100.0 |
|
Table 2. Composition of simethicone and loperamide hydrochloride liquisolid formulation in tablet S4. Source: Thermo Fisher Scientific – Materials & Structural Analysis
| Ingredient |
mg/Tablet |
Concentration
(%w/wt) |
Function |
| Simethicone Q7-2243 LVA |
125.0 |
16.96 |
Active ingredient |
| Loperamide hydrochloride |
2.0 |
0.27 |
Active ingredient |
| TRI-CAFOS® 500 (TCP) |
375.1 |
50.90 |
Carrier |
| DI-CAFOS® A150 (DCPA) |
220.1 |
29.87 |
Diluent/compression aid |
| Ac-Di-Sol® SD-711 NF |
7.4 |
1.00 |
Disintegrant |
| Ligamed® MF-2-V |
7.4 |
1.00 |
Lubricant |
| Total |
735.0 |
100.00 |
|
The Raman Imaging Microscope employed in this study was the DXR3xi, outfitted with an electron-multiplied CCD operating at 600 Hz and a 532 nm laser delivering 40 W power to the sample.
Raman mapping was conducted with a 25 µm lateral resolution using an Olympus 10x MPLN objective and a 5 µm resolution using an Olympus 50x LMPLFLN objective.
Raman spectra was gathered at a rate of 400 Hz with 40 repetitions. Collection times were approximately 1 hour for 5 µm mappings of 1x1 mm² and 6 hours for 25 µm mappings of 12x12 mm².
The chemometric method Multivariate Curve Resolution (MCR), involving background subtraction and five estimated compounds, was applied to identify individual components in samples S1-S3 and HSG (refer to Table 1).
For simplicity, TRI-CAFOS® 500 and DI-CAFOS® A150 are abbreviated as TCP and DCPA, respectively, from this point onward.
Loperamide hydrochloride was introduced as a sixth component for sample S4, and the MCR algorithm was adjusted accordingly (see Table 2).
Figure 1 illustrates the Raman spectra of the ingredients used for preparing the tablet samples. Although peaks appear in similar spectral regions, such as for TRI-CAFOS® 500 and DI-CAFOS® A150 or in the CH-stretching region around 3000 cm-1 for the organic components, all spectra can be easily distinguished by eye.
Figure 2 displays the spectral maps recorded on the liquisolid tablets in this study. MCR reveals the distribution of individual components in the tablets. Each color represents a component or mixture, depicted by a model Raman spectrum, as shown in Figure 3.
It is crucial to note that MCR does not directly identify chemical substances but detects model spectra representing all spectra in the map.
In the maps in Figure 2, dark blue signifies a mixture of simethicone and TCP; light blue represents a mixture of simethicone and TCP with varying concentrations; red indicates DCPA (sometimes with an addition of simethicone); green corresponds to Mg-stearate; orange represents croscarmellose sodium, and pink (for S4 formulation only) represents loperamide hydrochloride.
The top tiles (tiles a-e) of Figure 2 are Raman maps of the entire tablets recorded at a spatial resolution of 25 µm. In two cases, only half of the tablets were mapped, but they are considered highly representative.
The bottom row (tiles f-j) are detailed spectral images of 1x1 mm² tablet fragments recorded with a spatial resolution of 5 µm.
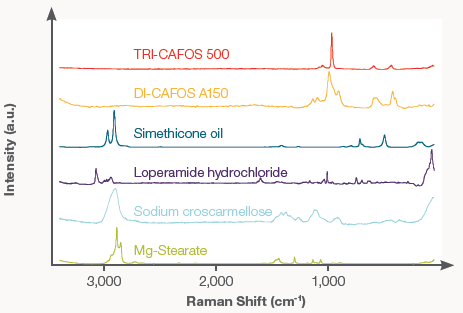
Figure 1. Normalized reference spectra of all ingredients expected in the tablet samples. Image Credit: Thermo Fisher Scientific – Materials & Structural Analysis
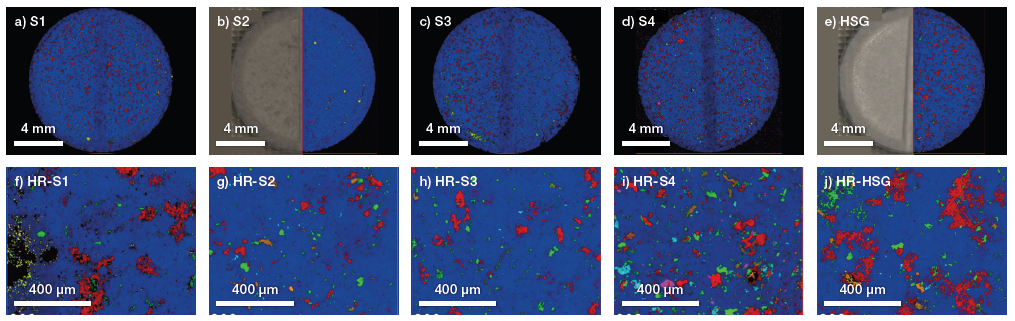
Figure 2. Raman maps of liquisolid tablets registered with 25 μm (top) and 5 μm (bottom) resolutions. The spectra are separated into chemical components by MCR analysis and displayed in assorted colors. Note that the individual components in each map differ slightly. Colors were assigned for each sample to represent the highest conformity across the components of all tablets. Image Credit: Thermo Fisher Scientific – Materials & Structural Analysis
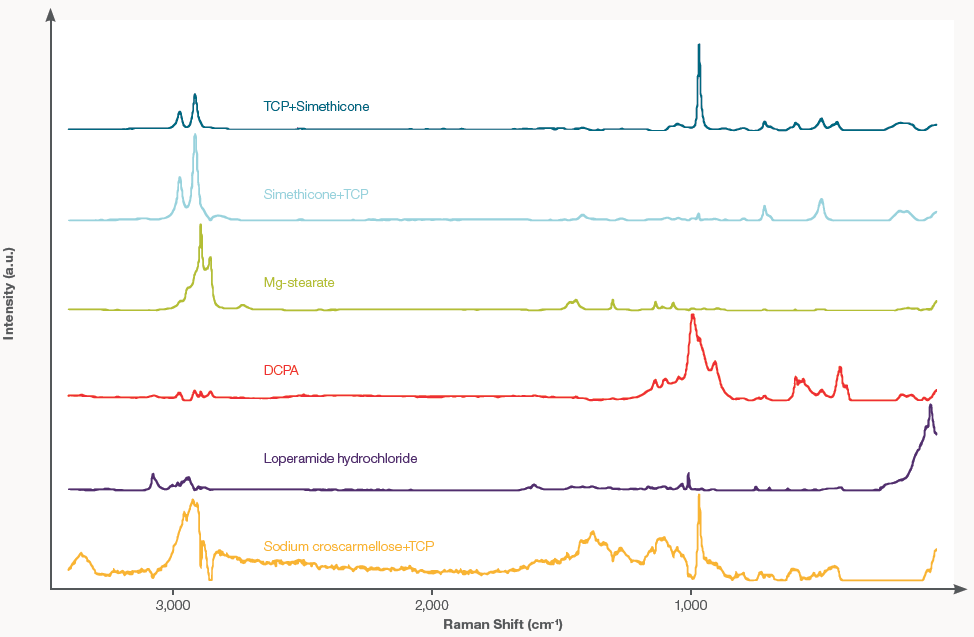
Figure 3. MCR spectra from the 5 μm resolution map of the S4 sample. Colors represent the individual components as displayed in the map in figure 2i. Note that the individual components in each map differ slightly. Image Credit: Thermo Fisher Scientific – Materials & Structural Analysis
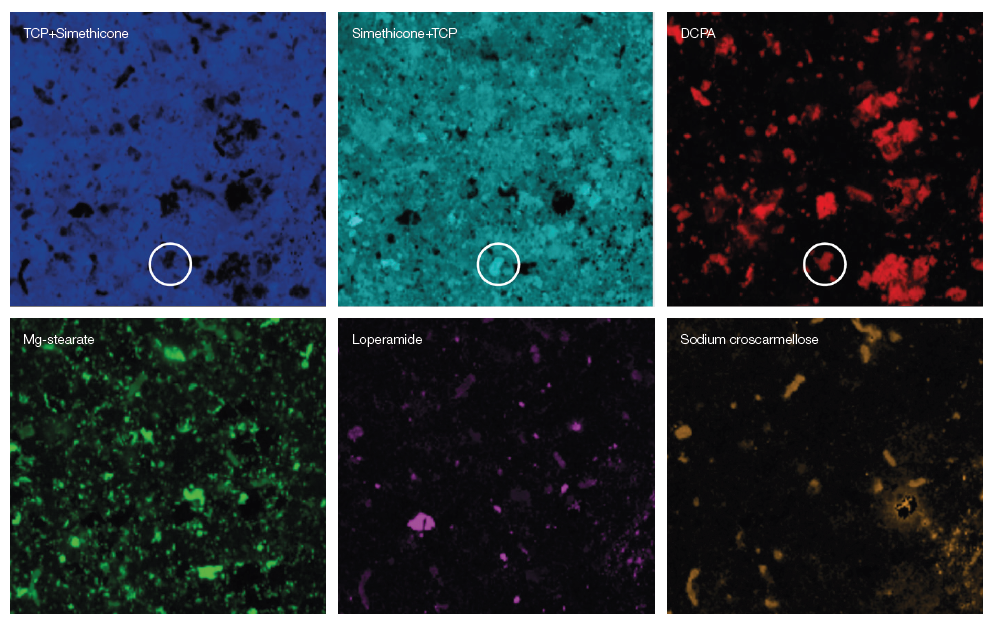
Figure 4. Individual MCR maps of the high-resolution mapping from Figure (2i). The white circle in the upper tiles serves as a guide to the eye. Image Credit: Thermo Fisher Scientific – Materials & Structural Analysis
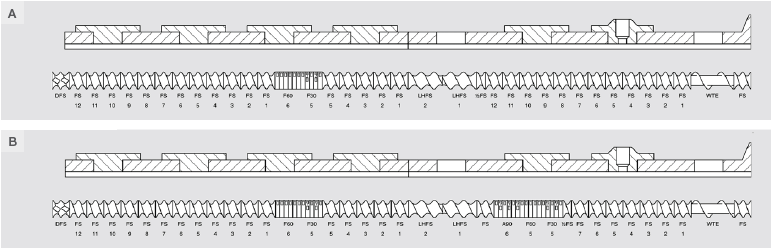
Figure 5. Schematic diagram of the screw configurations used in the TSG. Image Credit: Thermo Fisher Scientific – Materials & Structural Analysis
The marked red areas record the distinct Raman spectra of DCPA. Examining these zones reveals the impact of various methods for preparing liquid-filled powders on the component distribution within liquisolid tablets.
This distribution heavily relies on the granulator type used—either a high-shear granulator (HSG) or a twin-screw granulator (TSG)—and, specifically with TSG, on screw configuration (refer to Figure 5) and process speed (i.e., the rate at which powders pass through the TSG).
Formulations, denoted as S1 and S2, were both created at a low throughput of 5 kg/hour (see Table 3). In the initial formulation, the screw setup featured just one kneading zone, causing the powder to primarily reside in the mixing area.
Consequently, larger agglomerates formed, visually represented by expansive red zones on Raman maps. These observations closely align with particle size analysis, indicating the largest particles within this formulation. Conversely, the second formulation incorporated a screw setup with two kneading zones.
This arrangement narrowed particle size distribution and enhanced ingredient distribution within the tablet.
For the S3 formulation, produced at a higher throughput of 10 kg/hour, the DCPA particles seemed slightly larger in Raman maps despite there being no increase detected by PSD analysis. Nevertheless, these particles were uniformly dispersed throughout the tablet.
Raman maps of the HSG-prepared formulation exhibited large DCPA and Mg-stearate particle agglomerates, relatively evenly distributed within the tablet. Similar conclusions on particle sizes were drawn from PSD analysis.
In certain DCPA-associated locations, real Raman spectra included not only DCPA but also spectral signatures of simethicone. This suggests a localized release of simethicone from TCP particles during higher compression force tableting.
This resulted in the breakage and crushing of TCP particles, releasing simethicone, which then gets absorbed by DCPA particles, preventing it from being expelled during tableting. This might seem counterintuitive to the MCR results, as the DCPA component does not contain any signature of simethicone.
Upon closer examination of the actual spectra or the separate distribution of each MCR component, depicted in Figure 4, it becomes evident that there’s a substantial concentration of DCPA and simethicone in the area marked by the white circle, with limited input from TCP.
A formulation, including loperamide hydrochloride (S4), was created using the “B” screw setup at a higher process throughput of 10 kg/hour. The spectral map illustrates an even spread of formulation elements, yet numerous DCPA+simethicone particles emerged.
This implies that the increased processing speed might not effectively absorb simethicone onto the carrier particles (TCP). It is worth noting that, in this specific formulation, simethicone also contained loperamide hydrochloride, impacting the liquid’s viscosity and its penetration speed into the carrier particles.
Table 3. Various TSG process parameters. Note that one of the tablets was produced with a high-shear granulator (HSG). Source: Thermo Fisher Scientific – Materials & Structural Analysis
| Screw configuration |
A |
B |
B |
B |
| Screw speed (rpm) |
200 |
200 |
400 |
400 |
| Total throughput (kg/h) |
5 |
5 |
10 |
10 |
Figure 6 showcases the Raman correlation map of the S4 formulation. The red spots signify regions where Raman spectra correlate strongly with that of loperamide hydrochloride. Loperamide hydrochloride is uniformly distributed in the tablet, but variations in particle size are noticeable.
This indicates an uneven distribution of particle sizes for the drug substance. Larger loperamide hydrochloride crystals could not break down in simethicone during the process conditions before adhering to the carrier particles.
Nevertheless, loperamide hydrochloride in liquisolid tablets displayed an even distribution, meeting the dosage unit uniformity criteria as the pharmacopeia required.
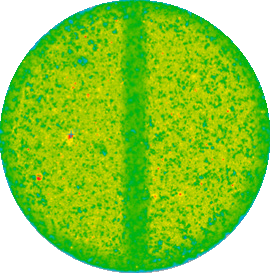
Figure 6. Raman correlation map showing the spatial distribution of loperamide hydrochloride; red sites are those with the highest, and blue sites are those with the lowest correlation of the Raman spectrum with that of loperamide hydrochloride. Image Credit: Thermo Fisher Scientific – Materials & Structural Analysis
In conclusion, Raman imaging serves as a highly effective analytical technique to assess the impact of the production process on simethicone’s absorption efficiency onto the carrier and the distribution of individual components within tablets.
Acknowledgments
The authors would like to thank Daniel Zakowiecki, Markos Papaioannou, Peter Edinger, and Tobias Hess from Chemische Fabrik Budenheim KG, Krystyna Mojsiewicz-Pieńkowska and Krzysztof Cal from the Medical University of Gdansk, as well as to our colleague Annika Voelp from Thermo Electron (Karlsruhe) GmbH for collaboration and allowance to extract the results from the study “Towards the Continuous Manufacturing of Liquisolid Tablets Containing Simethicone and Loperamide Hydrochloride with the Use of a Twin-Screw Granulator”.1
References
- Zakowiecki, D.; Richter, M.; Yuece, C.; Voelp, A.; Ries, M.; Papaioannou, M.; Edinger, P.; Hess, T.; Mojsiewicz-Pieńkowska, K.; Cal, K. Towards the Continuous Manufacturing of Liquisolid Tablets Containing Simethicone and Loperamide Hydrochloride with the Use of a Twin-Screw Granulator. Pharmaceutics 2023, 15, 1265. https://doi.org/10.3390/pharmaceutics15041265
- US Pharmacopoeia; General Chapter: Uniformity of Dosage Units. In: USP/NF. Rockville, MD: USP; 2020. DOI: https://doi.org/10.31003/uspnf_m99694_02_01.
About Thermo Fisher Scientific – Materials & Structural Analysis
Thermo Fisher Materials and Structural Analysis products give you outstanding capabilities in materials science research and development. Driving innovation and productivity, our portfolio of scientific instruments enable the design, characterization and lab-to-production scale of materials used throughout industry.
X-ray fluorescence spectrometers, FTIR spectrometers and X-ray photoelectron spectrometers enable researchers and material analysts to probe the chemical composition of materials ranging from ultra thin-films to bulk powders used in product development and materials troubleshooting. We offer a line of rheometry and viscometry instruments, as well as single- and twin-screw extruders, for laboratory benches that enable you to measure the physical property of semi-solids and liquids for shear flow and yield stress.
No other company offers the breadth of products and the depth of analytical capabilities for materials science and engineering.
Vibrational spectroscopy
Our line of Nicolet FTIR spectrometers have led the analytical instrument industry for over fifty years with reliable, robust and flexible solutions. Thermo Scientific Raman spectrometers enable point analysis, confocal microscopy and chemical imaging.
X-Ray photoelectron spectroscopy
For the analysis of surfaces and thin film structures, our line of XPS spectrometers feature ease-of-use, automation and multi-technique operation for material science and R&D labs. For an in-depth look into our surface analysis capabilities and resources, visit xps-simplified.com.
Electron microscopy and X-ray microanalysis
Everyday, Thermo Fisher customers from around the globe seek solutions to complex challenges about product quality, manufacturing efficiency and material properties with electron microscopy, ion beam and SEM/EDS, WDS and EBSD capabilities that enable the next breakthrough discovery.
X-Ray fluorescence
Rapidly characterize materials for qualitative and quantitative chemistry specifications with the gold-standard for accurate, nondestructive elemental analysis across a wide range of materials.
X-Ray diffraction
Our line of ARL EQUINOX X-ray diffractometers provides high-performance results in a wide range of industrial and research applications including academic research, chemicals, pharmaceuticals, polymers, semiconductors, thin films, metals and minerals.
Rheology & viscometry
Thermo Scientific rheometers and viscometers are designed to accurately measure the properties of fluids and other complex materials. They are recognized for accuracy and ease of use in quality control, product development, and research applications. Our viscometers allow you to quickly determine the flow behavior of fluids and are designed for your application.
Extruders & torque rheometers
Ideal for materials compounding experiments and pilot scale extrusion production, our minicompounders and 11mm parallel twin-screw extruders, and torque rheometers are well-suited for research and development in the polymer, pharmaceutical, bioscience, and nanotechnology sectors.
Optical emission spectrometry
Perform rapid elemental analysis of solid metallic samples with optical emission spectrometry using Arc/Spark excitation. This technique meets the most demanding analysis needs of the metals industry from production control to R&D, from incoming material inspection to scrap sorting.
Sponsored Content Policy: News-Medical.net publishes articles and related content that may be derived from sources where we have existing commercial relationships, provided such content adds value to the core editorial ethos of News-Medical.Net which is to educate and inform site visitors interested in medical research, science, medical devices and treatments.