A growing body of evidence indicates that studies utilizing organoids and microtissues yield more predictive and translational insights compared to traditional two-dimensional (2D) monolayer cell models.1,2 In addition, the application of multicellular tumor spheroids in oncology and immuno-oncology research is on the rise.
In vitro models that aim to replicate the tumor microenvironment may incorporate an extracellular matrix (ECM) and additional cell types, such as stromal, immune, and endothelial cells. This approach enables researchers to evaluate drug functionality, investigate immune-tumor cell interactions, and assess chemoresistance.
Current methods for evaluating tumor spheroid growth and shrinkage often come with significant limitations—they can be time-consuming, costly, or require complex workflows. Many rely on fluorescent probes that may interfere with cellular biology, end-point analyses that miss dynamic changes over time, or indirect biochemical readouts that fail to capture important morphological details.
The Incucyte® Live-Cell Analysis System is a fully automated platform for phase contrast and two-color fluorescence imaging, designed to operate directly within a standard cell culture incubator. This setup ensures optimal cell viability and preserves physiological relevance throughout the experiment.
The system repeatedly scans tissue culture plates and flasks at user-defined intervals, allowing for continuous monitoring and the generation of quantifiable, kinetic data.
At the core of this system is the Incucyte® Spheroid software module—a fast, flexible, and intuitive hub that streamlines live-cell analysis, from image acquisition to processing and data visualization.
The platform supports the use of non-disruptive, nuclear-targeted fluorescent reagents, including GFP (green fluorescent protein) and RFP (red fluorescent protein), enabling accurate cell quantification without compromising cell health.
Assay principle
In the study presented in this article outlines how the Incucyte® Live-Cell Analysis System, together with Incucyte® 3D Multi-Tumor Spheroid Assays, can be used to study the growth of 3D tumor multispheroids in co-culture with fibroblasts or immune cells.
By enabling continuous live-cell imaging, this approach captures dynamic changes and interactions that are often missed with single-time-point methods.
The enhanced depth of focus Brightfield (DF Brightfield) image acquisition facilitates long-term imaging of many tumor spheroids cultivated on a bed of extracellular matrix (Matrigel™). This advanced image acquisition yields high-contrast Brightfield images that can be easily masked using built-in Incucyte® processing definitions.
Brightfield count, object size, and eccentricity are automatically plotted over time, providing extensive data on spheroid formation and growth rates. Thousands of images can be acquired, analyzed, and graphed, with the capability to run up to six 96-well plates in parallel, thereby enhancing throughput.
This study presents validation methods and data demonstrating the capability of the Incucyte® Live-Cell Analysis System to kinetically visualize and quantify the influence of stromal cells on tumor multi-spheroid morphology and chemotherapeutic agent sensitivity, as well as evaluate immune cell-mediated toxicity in tumor multi-spheroids.
Materials and methods
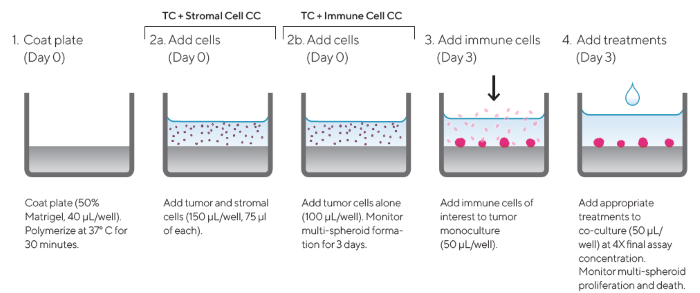
Figure 1. Assay Workflow. Image Credit: Sartorius Lab Instruments GmbH & Co. KG
- A 96-well microtiter plate was coated with a layer of Matrigel™ (Corning) (40 μL/well, diluted in serum-free media to a minimum concentration of 4.5 mg/mL) and polymerized at 37 °C for 30 minutes
- Cells of interest were harvested, counted, and seeded into pre-coated 96-well plates at the desired densities (150 or 100 μL/well):
- Tumor and stromal cell co-culture: Tumor and stromal cells were seeded at a 1:1 ratio (150 μL/well, 75 μL of each cell type).
- Tumor and immune cell co-culture: Tumor cells were seeded alone (100 μL/well).
- Multi-spheroid formation was monitored for three days using the Incucyte® Image Analysis System (DF® Brightfield acquisition, 10x magnification, every six hours).
- Following multi-spheroid formation, immune cells of interest were added to the tumor monoculture at an optimized effector-to-target ratio (E:T) in a volume of 50 μL/well.
- Appropriate treatments were added to the co-culture assay plates (50 μL/well) at 4x final assay concentration to achieve a final volume of 200 μL/well.
- Multi-spheroid proliferation was monitored using the Incucyte® S3 (six-hour repeat scanning) for up to ten days.
All cell culture reagents were obtained from Life Technologies unless otherwise noted.
MDA-MB-231 (ATCC), SK-BR-3 (ATCC), and SKOV3 (EACC) cultures were stably transfected with Incucyte® Nuclight Red Lentivirus Reagent (EF1 Alpha Promoter, Puromycin selection, Cat. No. 4625), prepared according to the Essen BioScience protocol.
BT-474 (ATCC) cultures were stably transfected with Incucyte® Cytolight Green Lentivirus Reagent (EF1 Alpha Promoter, Puromycin selection, Cat. No. 4481), also prepared per the Essen BioScience protocol.
Lapatinib and Camptothecin were obtained from Sigma, and ZK164015 was obtained from Tocris Bioscience. Normal human dermal fibroblasts (NHDFs) were purchased from CalTag Medsystems (Cat. No. ZHC-5102), and MCF7 Nuclight Red cells from Essen BioScience (Cat. No. 4524).
All cell lines were cultured in MEM medium supplemented with 10 % FBS, 1 % sodium pyruvate, and 1 % non-essential amino acids, and grown to confluence in 75 cm2 tissue culture-treated flasks (Corning).
Cells were harvested and seeded into 96-well plates (Corning No. 3595) coated with a base layer of 40 μL/well Matrigel, such that three days post-seeding, multi-spheroids had formed at the desired size. Spheroid formation was monitored using the Incucyte® S3 over three days at six-hour intervals.
Peripheral blood mononuclear cells (PBMCs) were isolated from buffy coats of healthy donors using Lymphoprep™ density gradient medium (StemCell Technologies) and maintained in RPMI 1640 supplemented with 10 % heat-inactivated FBS.
Influence of stromal cells on multi-spheroid morphology
Normal human dermal fibroblasts (NHDFs) were shown to significantly influence tumor multi-spheroid morphology. SK-BR-3 cells were seeded either alone or in co-culture with NHDFs (1:1 ratio, 1000 cells/well for each) and DF Brightfield images were acquired every six hours.
In mono-culture, SK-BR-3 cells did not form compact multi-spheroids; however, co-cultures with NHDFs led to the formation of more compact aggregates, as shown in Figure 2.
The Incucyte® Spheroid Software Module allowed for kinetic quantification of both morphologies, monitoring multi-spheroid growth using size measurements (Total BF Area).
Furthermore, different temporal growth profiles were shown through live-cell analysis of a panel of four breast tumor multi-spheroids (MCF7, MDA-MB-231, SK-BR-3, and BT-474) co-cultured with NHDFs, as shown in the time-course plot in Figure 2.
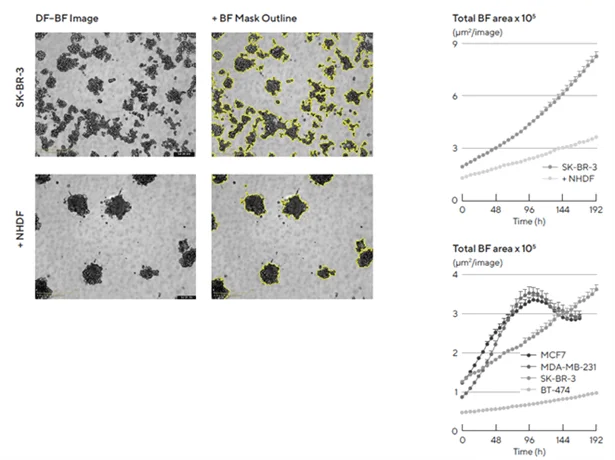
Figure 2. Morphology observations with Incucyte® DF-BF images and quantification of multi-spheroid size and kinetic growth using real-time analysis. SK-BR-3 cells were seeded in flat-bottom, 96-well plates on a bed of Matrigel in mono- or co-culture with NHDFs (1:1 ratio, 1,000 cells/well for each) and multi-spheroids (MS) allowed to form (3 d). Incucyte® extended depth of focus Brightfield (DF Brightfield) images (8 d post cell seeding) of SK-BR-3 MS in mono- or co-culture with NHDFs. The brightfield outline mask is shown in yellow. Note the influence of NHDFs on SK-BR-3 MS morphology and size (Total Area). Time course plots show the individual well Total Brightfield Object Area (μm2) (y-axis) over time (h) (x-axis) and illustrate cell type-specific kinetic growth profiles for a range of breast tumor MS co-cultured with NHDFs. Data were collected over a 192-hour period at 6-hour intervals. Each data point represents mean ± SEM, n=15 wells. Image Credit: Sartorius Lab Instruments GmbH & Co. KG
NHDFs co-cultured with MDA-MB-231 cells (1:1 ratio, 1000 cells/well for each) exhibited a time-dependent effect on spheroid morphology. MDA-MB-231 multi-spheroids changed from a stellate and branched appearance to a more clustered and rounded appearance following six days, as shown in Figure 3.
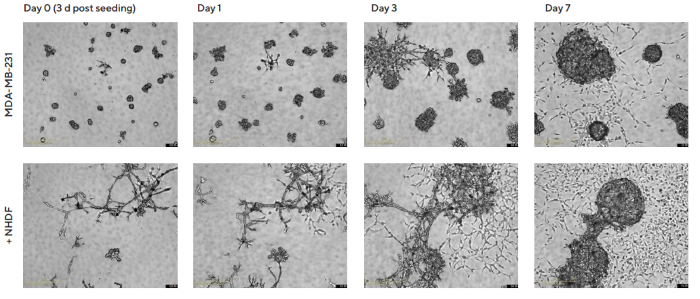
Figure 3. Temporal effects on morphology revealed through Incucyte® DF Brightfield imaging. MDA-MB-231 cells were seeded in flat bottom 96-well plates on a bed of Matrigel in mono- or co-culture with NHDFs (1:1 ratio, 1,000 cells/well for each) and multi-spheroids allowed to form (3 d). Incucyte® S3 DF Brightfield images compare mono- and co-culture conditions over 7 d (10 d post cell seeding). Note the temporal impact of NHDFs on spheroid morphology. Image Credit: Sartorius Lab Instruments GmbH & Co. KG
96-well multi-spheroid growth and shrinkage assay for pharmacological analysis
To show the suitability of this 3D tumor and stromal cell co-culture for compound toxicity testing, a pharmacological study was conducted utilizing a panel of four commonly utilized breast tumor cell lines: MCF7, MDAMB-231, BT- 474, and SK-BR-3.
Cells were co-cultured with NHDFs (1:1 ratio, 1000 cells/well of each,) and multi-spheroids were allowed to form for three days prior to treatment (up to ten days) with standard-of-care and cytotoxic agents, Lapatinib, ZK164015, and Camptothecin (CMP).
Incucyte®’s automated, real-time vessel views facilitated fast visualization of treatment effects on multi-spheroid size (Total BF Area). 96-well vessel views of MCF7 multi-spheroids, along with overlay analysis masks and treatment time courses, illustrate a concentration-dependent inhibition of ZK164015 and CMP on spheroid size, as shown in Figure 4.
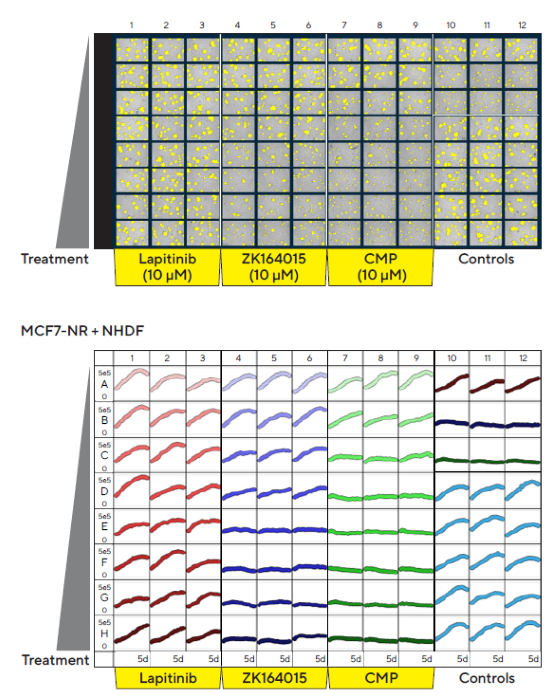
Figure 4. Incucyte® S3 vessel views enable rapid visualization and quantification of treatment effects. MCF7 cells co-cultured with NHDFs were seeded in pre-coated (Matrigel) flat-bottom 96-well plates (1:1 ratio, 1,000 cells/well of each) and multi-spheroids allowed to form (3 d). Spheroids were then treated with serial dilutions of the known standard of care and cytotoxic compounds (5 d). Incucyte® microplate vessel views show effects of treatments on multi-spheroid size. The top image shows Brightfield Object Area (μm2) segmentation mask (yellow), 5 d post-treatment. Bottom image shows the individual well Total Brightfield Object Area (μm2) (y-axis) over time (0–5 d post treatment) (x-axis). Image Credit: Sartorius Lab Instruments GmbH & Co. KG
Visualization of Brightfield images supports the specific cytotoxic impact of Lapatinib on SK-BR-3 spheroid size and a non-specific cytotoxic impact of CMP on SK-BR-3 and MCF7 spheroids, as shown in Figure 5.
Concentration response curves were formed using area under the curve (AUC) analysis of the time-course data, as shown in Figure 6. The inhibition of multi-spheroid growth by Lapatinib and ZK164015 was consistent with the established expression profiles of the receptors targeted by these agents.3
The dual EGFR and HER2 tyrosine kinase inhibitor, Lapatinib, exhibited a concentration-dependent inhibition of BT-474 and SK-BR-3 multi-spheroid growth. On the other hand, the estrogen receptor (ER) antagonist ZK164015 was identified as a potent inhibitor of MCF7 multi-spheroid growth.
ZK164015 had minimal to no effect on multi-spheroids lacking ER expression. The DNA topoisomerase inhibitor, CMP, demonstrated comparable growth inhibition across all multi-spheroid types.
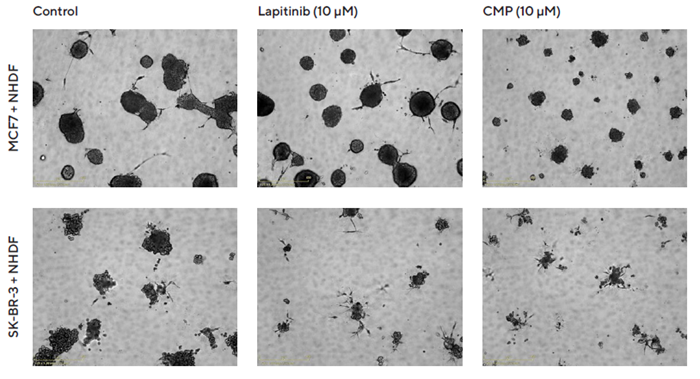
Figure 5. Interrogation of images to gain greater insight. MCF7 or SK-BR-3 cells co-cultured with NHDFs were seeded in pre-coated (Matrigel) flat-bottom 96-well plates (1:1 ratio, 1,000 cells/well of each) and multi-spheroids allowed to form (3 d) prior to treatment with Lapatinib and Camptothecin (CMP). Incucyte® Brightfield images (5 d) show the effects of treatments on multi-spheroid size and integrity. Note: cytotoxic effects of CMP on both MCF7 and SK-BR-3 multi-spheroids and their difference in sensitivity to Lapatinib. Image Credit: Sartorius Lab Instruments GmbH & Co. KG
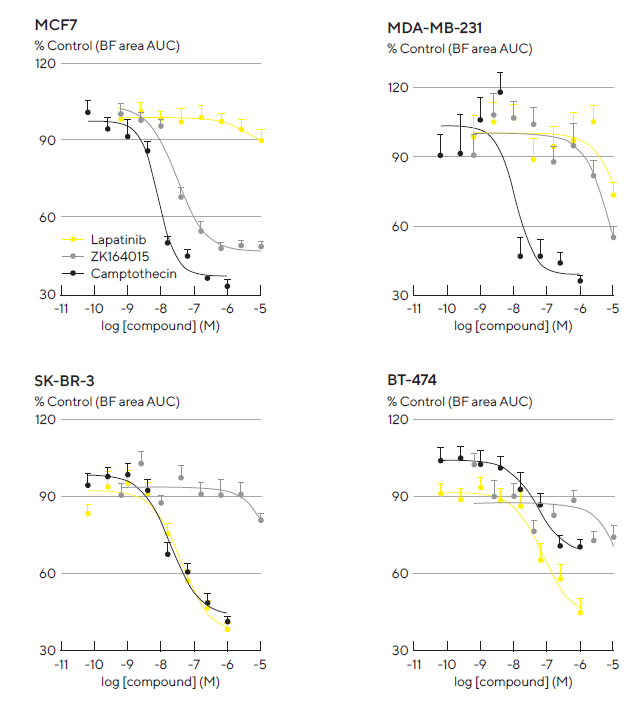
Figure 6. Robust and reproducible pharmacological analysis through the generation of concentration-response curves. A panel of four tumor breast cell lines was seeded in 96-well flat-bottom plates with NHDFs (1:1 ratio, 1,000 cells/well for each on a bed of Matrigel). Multi-spheroids were allowed to form for 3 d prior to treatment with standard-of-care and cytotoxic agents. Concentration response curves (CRCs) represent the area under the curve (AUC) of the Total Brightfield Area (μm2) time course data (not shown) from 0–6 d (MCF7, MDA-MB-231) or 0–10 d (SK-BR-3, BT-474) post-treatment. Each data point represents mean ± SEM, n=9–12 wells. Note: differential compound pharmacology across cell types. Image Credit: Sartorius Lab Instruments GmbH & Co. KG
Herceptin®-induced ADCC in HER2-positive multi-spheroids
The regulation of immune-mediated killing by monoclonal antibodies plays a key role in the mechanism of action behind many immunotherapy treatments.4 Antibodies like Herceptin—a humanized monoclonal antibody that targets the HER2 receptor—trigger antibody-dependent, cell-mediated cytotoxicity (ADCC) by binding to these receptors.
The effect of Herceptin-induced ADCC was assessed in HER2-positive (SKOV3 and BT474) and HER2-negative (MCF7) multi-spheroids. Stably expressing nuclear-restricted RFP (NR) and cytoplasmic GFP (CyG) tumor multi-spheroids were co-cultured with freshly isolated PBMCs at an E:T ratio of 5:1 and treated with Herceptin.
Immune cell-mediated cytotoxicity and multi-spheroid proliferation were determined kinetically via fluorescence intensity within a Brightfield boundary. Fluorescent tumor multi-spheroids do not require masking using this method.
PBMCs alone (data not shown) and Herceptin alone had little to no impact on multi-spheroid size or viability (fluorescence intensity, as shown in Figure 7). However, Herceptin activated PBMCs, resulting in a significant reduction in multi-spheroid viability.
Herceptin induced a concentration-dependent cytotoxic effect in HER2-positive multi-spheroids but not in HER2-negative multi-spheroids. BT-474 multi-spheroids showed greater sensitivity to Herceptin-induced cytotoxicity, with the highest tested concentration of Herceptin (1 μg/mL) resulting in approximately 80 % inhibition, compared to roughly 50 % in SKOV3 multi-spheroids, as shown in the concentration response curve in Figure 8.
Activation of the PBMC T cell population with an anti-CD3 antibody and IL-2 cocktail (10 ng/mL of each) resulted in maximal killing across all cell types, as shown in the time courses in Figure 8.
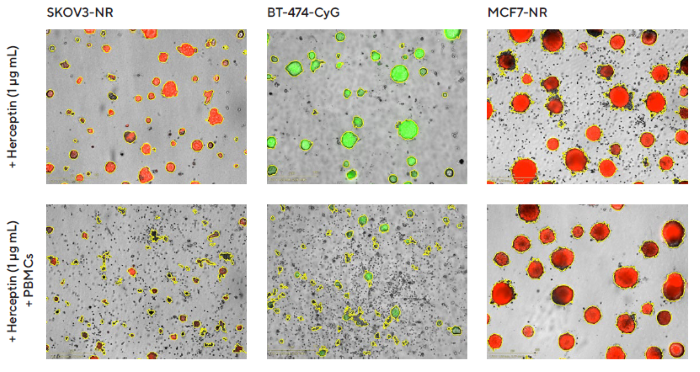
Figure 7. Impact of Herceptin-induced PBMCs on multi-spheroid proliferation. Tumor cells either stably expressing nuclear restricted RFP (SKOV3-NR, MCF7-NR) or cytoplasmically restricted GFP (BT-474-CyG) were seeded in flat-bottom 96-well plates (1,000 cells/well on a bed of Matrigel). Multi-spheroids were allowed to form (3 d) prior to the addition of freshly isolated PBMCs (E:T, 5:1) and Herceptin. Incucyte® S3 brightfield and fluorescence images (7 d; SKOV3-NR, MCF-NR, or 10 d; BT-474-CyG) compare the effect of Herceptin on spheroid proliferation in the absence (top panel) and presence (bottom panel) of PBMCs (Brightfield outline mask shown in yellow). Note the loss of fluorescence intensity in HER2-positive (SKOV3 and BT474) multi-spheroids in the presence of PBMCs. Image Credit: Sartorius Lab Instruments GmbH & Co. KG
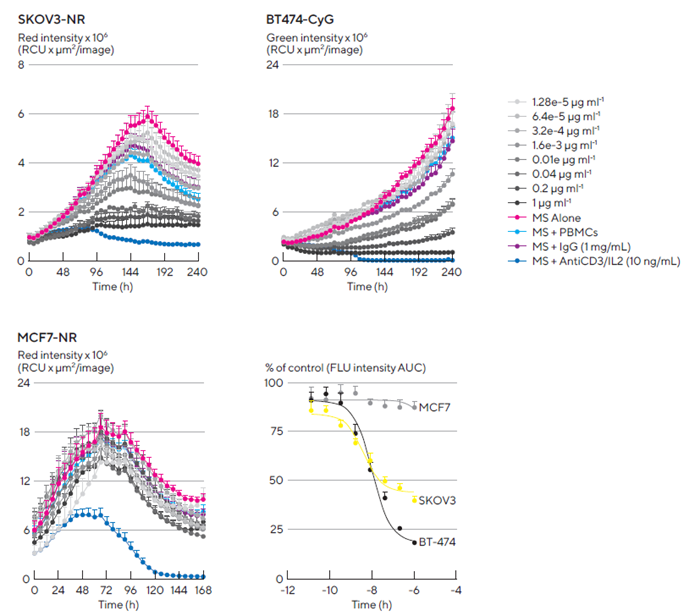
Figure 8. Kinetic quantification of ADCC immune cell killing of HER-2 positive multi-spheroids. Tumor cells were seeded in flat-bottom 96-well plates (1,000 cells/well on a bed of Matrigel) and allowed to form multi-spheroids (MS) for 3 d. Once formed, MS were co-cultured with freshly isolated PBMCs (E:T, 5:1) and treated with serial dilutions of Herceptin. Time courses show multi-spheroid death quantified as a loss of fluorescence intensity within the spheroid brightfield object. Concentration response curves to Herceptin show sensitivity differences between HER2-positive multi-spheroids (SKOV3 and BT-474). Treatments targeting T cell populations (Anti-CD3 and IL-2, 10 ng/mL) induced maximal MS cytotoxicity across all cell types. Data were collected over 10 days at 6-hours intervals. Each data point represents mean ± SEM, n=4 wells. Image Credit: Sartorius Lab Instruments GmbH & Co. KG
Conclusions
In the study presented here, the Incucyte® Live-Cell Analysis System, in conjunction with the Incucyte® Spheroid Software Module, was demonstrated to facilitate the analysis of 3D multi-spheroid co-cultures with both stromal and immune cells over time, making it applicable for compound testing.
The findings included:
- Live-cell analysis revealed that SK-BR-3 formed more compact multi-spheroids when cultured with NHDFs
- Live-cell imaging illustrated the temporal effects of NHDFs on MDA-MB-231 multi-spheroid morphology
- Cell type-specific temporal growth profiles were elucidated for a panel of breast tumor multi-spheroids
- The capability to perform real-time compound profiling in a 96-well format
- The ability to kinetically visualize and quantify immune cell-induced ADCC within target tumor multi-spheroids in real-time
- Herceptin-activated PBMCs resulted in a concentration-dependent loss of viability in HER2-positive multi-spheroids
More advanced 3D models, incorporating an extracellular matrix and additional cell types, such as stromal and immune cells, have the potential to provide more relevant translational models for studying the tumor microenvironment's effects on tumor biology.
Many features of the Incucyte® Live-Cell Analysis System are advantageous for monitoring and objectively quantifying 3D multi-spheroid biology in real-time.
DF Brightfield imaging enables label-free studies of 3D spheroid morphology and proliferation in 96-well assay formats, enhancing throughput. As predefined endpoint selection is not required, consistent segmentation and quantification of Brightfield images enable kinetic assessment of cell-dependent growth profiles and the impact of stromal cells on tumor multi-spheroid resistance to chemotherapeutic agents.
The combination of Brightfield and fluorescence imaging facilitates the visualization and quantification of immune cell-mediated toxicity in tumor multi-spheroids.
Incucyte®’s automated image acquisition, along with user-friendly analysis tools and rigorously tested protocols, enables non-expert users to rapidly generate reproducible data, conduct analyses, and produce publication-ready graphics.
Collectively, the Spheroid Software Module, Incucyte® Live-Cell Analysis System, and accompanying reagents offer a distinctive and efficient technical platform that can be seamlessly integrated into existing workflows.
Acknowledgments
Produced from material originally authored by Kalpana Patel, Miniver Oliver, Nevine Holtz, Tim Jackson, Nicholas Dana, Tim Dale, and Del Trezise from Sartorius.
References and further reading
- Lv, D., et al. (2017). Three‑dimensional cell culture: A powerful tool in tumor research and drug discovery (Review). Oncology Letters, 14(6). https://doi.org/10.3892/ol.2017.7134.
- Verjans, E.-T., et al. (2017). Three-dimensional cell culture models for anticancer drug screening: Worth the effort? Journal of Cellular Physiology, 233(4), pp.2993–3003. https://doi.org/10.1002/jcp.26052.
- Subik, K., et al. (2010). The Expression Patterns of ER, PR, HER2, CK5/6, EGFR, Ki-67 and AR by Immunohistochemical Analysis in Breast Cancer Cell Lines. Breast Cancer: Basic and Clinical Research, (online) 4, pp.35–41. Available at: https://pubmed.ncbi.nlm.nih.gov/20697531/.
- Griggs, J. and Zinkewich-Peotti, K. (2009). The state of the art: immune-mediated mechanisms of monoclonal antibodies in cancer therapy. British Journal of Cancer, 101(11), pp.1807–1812. https://doi.org/10.1038/sj.bjc.6605349.
About Sartorius Lab Instruments GmbH & Co. KG
The Sartorius Group is a leading international partner of life science research and the biopharmaceutical industry.
With innovative laboratory instruments and consumables, the Group’s Lab Products & Services Division concentrates on serving the needs of laboratories performing research and quality control at pharma and biopharma companies and those of academic research institutes.
The Bioprocess Solutions Division with its broad product portfolio focusing on single-use solutions helps customers to manufacture biotech medications and vaccines safely and efficiently. The Group has been annually growing by double digits on average and has been regularly expanding its portfolio by acquisitions of complementary technologies.
In fiscal 2021, the company earned sales revenue of some 3.45 billion euros. At the end of 2021, nearly 14,000 people were employed at the Group’s approximately 60 manufacturing and sales sites, serving customers around the globe.
Sponsored Content Policy: News-Medical.net publishes articles and related content that may be derived from sources where we have existing commercial relationships, provided such content adds value to the core editorial ethos of News-Medical.Net which is to educate and inform site visitors interested in medical research, science, medical devices and treatments.