Protein-observed 2D NMR analysis combines chemical shift perturbation measurements with computational tools to identify binding, characterize affected protein sites, and evaluate fragment-screening data. Automated peak analysis, spectral comparison, affinity determination, and machine-learning approaches are extending these workflows while retaining the need for expert interpretation of complex or allosteric spectral changes.
 Study: S. Singha/Shutterstock.com
Introduction: Turning Protein Spectral Fingerprints into Binding Information
Protein-observed two-dimensional nuclear magnetic resonance (2D NMR) is a key technique in fragment-based drug discovery (FBDD) that allows researchers to examine how a protein responds to potential drug molecules in solution. Each resolved peak in the spectrum reports on a defined pair of atoms within the protein, so a shift in the peak pattern signals a change in the site's surroundings. Because the method detects even weak binding, it is well suited to the small, loosely binding fragments that are central to FBDD.1,2
Advances in instrumentation, including cryogenically cooled probes, high magnetic fields, and rapid pulse schemes, now make it possible to generate large datasets in a short time. Although data acquisition and analysis both remain practical concerns, this article focuses on the challenge of drawing reliable conclusions from many complex spectra, and how the integration of automation using software that picks peaks and ranks spectra has helped address this challenge.2,3,4
What Makes 2D NMR So Valuable for Drug Discovery?
In a typical protein-observed 2D NMR experiment, the target protein is enriched with nitrogen-15 (15N), and a 15N-heteronuclear single quantum coherence (HSQC) spectrum is recorded. Most peaks correspond to one backbone amide each, so the spectrum acts as a fingerprint of the folded protein.1
The electronic environment of nearby nuclei changes during ligand binding, which causes the matching peaks to move, lose intensity, or broaden. Because weakly binding fragments often exchange rapidly between free and bound states on the NMR timescale, the NMR spectrometer detects a time-averaged signal, causing the peak to drift progressively as the ligand concentration increases. In contrast, in the slow-exchange regime, separate resonances for the free and bound states can be observed, with their relative intensities changing during a titration.1,2
2D NMR experiments used for protein-observed screening generally require isotopically labeled protein, commonly with 15N or 13C.3,4 1H-15N correlation experiments are particularly useful for smaller proteins, with proteins below approximately 30 kDa cited as a typical range, whereas selective methyl-13CH3 labeling in a highly deuterated background can extend protein-observed NMR FBDD to targets exceeding 40 kDa.3,4
When Manual Analysis Becomes the Challenge
Traditionally, an analyst overlays the spectrum of the free protein on that of each protein-fragment sample, notes which peaks have shifted, and decides whether the change is large enough to call a hit. Often, this judgment takes the form of a qualitative score from zero to five, ranging from no chemical shift perturbations (CSPs) observed to large CSPs denoting robust binding. Intermediate scores can vary across researchers because visual assessment is subjective; manual analysis can also be time-consuming and susceptible to human bias.3,4
Furthermore, a single campaign may involve hundreds of spectra, with crowded regions, weak signals, and vanishing peaks, which complicates comparison. Spectral overlap can make individual peaks difficult to identify and quantify reliably, particularly in complex spectra. Manual peak tracking and picking are slow and impractical for large compound sets, and vary between experts and laboratories. Automation is therefore valuable for improving efficiency, consistency, and reproducibility, although expert intervention remains important for difficult or ambiguous spectra.4,5
Turning Spectral Changes into Actionable Data
CSP is among the most common indicators of binding. It combines the proton and nitrogen displacement of a peak into a single value, and is informative in identifying which protein residues are most affected by the binding of the ligand. Because 1H and 15N chemical shifts span different ranges, their changes are normally combined using an appropriately weighted CSP measure. The criterion used to identify a significant perturbation depends on the analysis.1,2,6
Assigned peaks are the second layer of ranking, since each perturbed peak points to a residue. Mapping those residues onto a structure can reveal a cluster of perturbed residues around a groove or pocket.1 However, CSP cannot differentiate between residues that directly contact the ligand and those that undergo allosteric changes or conformational adjustments due to binding. This limitation can be substantial: in a 2026 analysis of 139 protein-protein and protein-peptide complexes, most significant CSPs occurred outside the structurally defined binding site, and substantial perturbations were also observed at residues more than 10 Å from the ligand. CSP maps should therefore be interpreted as maps of binding-associated changes in chemical environment rather than simple maps of direct ligand contacts.6
Automated NMR Analysis
Software now helps automate much of the routine work that was once done manually. A 2023 study published in the Journal of Biomolecular NMR describes plugins in the MestReNova package that process raw data in batches, profile spectra for outliers, rank single-point screening samples, and extract affinities from titration series. The researchers tested these tools on 17 reported ligands of the anti-apoptotic myeloid cell leukemia-1 (MCL-1) protein and compared them with manual scoring.3
The Screen 2D plugin in the package performs peak-by-peak comparisons between a reference spectrum and test spectra and uses detected chemical-shift changes to rank ligand-induced spectral perturbations. The MBinding plugin follows selected peaks through titrations and fits binding curves to obtain dissociation constants (KD).3
Users can also edit tracked peaks and view results in tabular and graphical form at each stage, which makes the evidence behind every automated call accessible. Outside of the MestReNova package, interactive CSP modules such as CcpNmr AnalysisAssign allow users to inspect and interact with the NMR data through bar charts and peak tables without manual export steps.1,3
The Role of Machine Learning
Machine learning is a recent addition to 2D NMR and has been implemented in different parts of the analysis workflow.4,5
CSP Analyzer, a machine learning-based automated analysis tool for 2D NMR data, uses descriptors borrowed from image analysis and a machine-learning classifier to sort HSQC spectra without requiring assignments. The study evaluated 1,611 HSQC spectra from screening campaigns against four protein targets and trained the discriminator using sets of 100 spectra drawn from those datasets. The approach was designed to identify spectra that differ significantly from their protein-only reference and thereby reduce the time and user bias involved in screening large numbers of spectra.4
DEEP Picker, a deep neural network-based tool for peak picking and deconvolution, is trained on synthetic spectra. Its neural network is applied along individual rows and columns of multidimensional spectra and can identify overlapping peaks, including shoulder peaks that may not appear as conventional local maxima. It then performs quantitative peak fitting after peak identification, enabling semi-automated deconvolution of crowded 2D spectra.5 The method was demonstrated on spectra from folded and intrinsically disordered proteins as well as a complex metabolomics sample.5
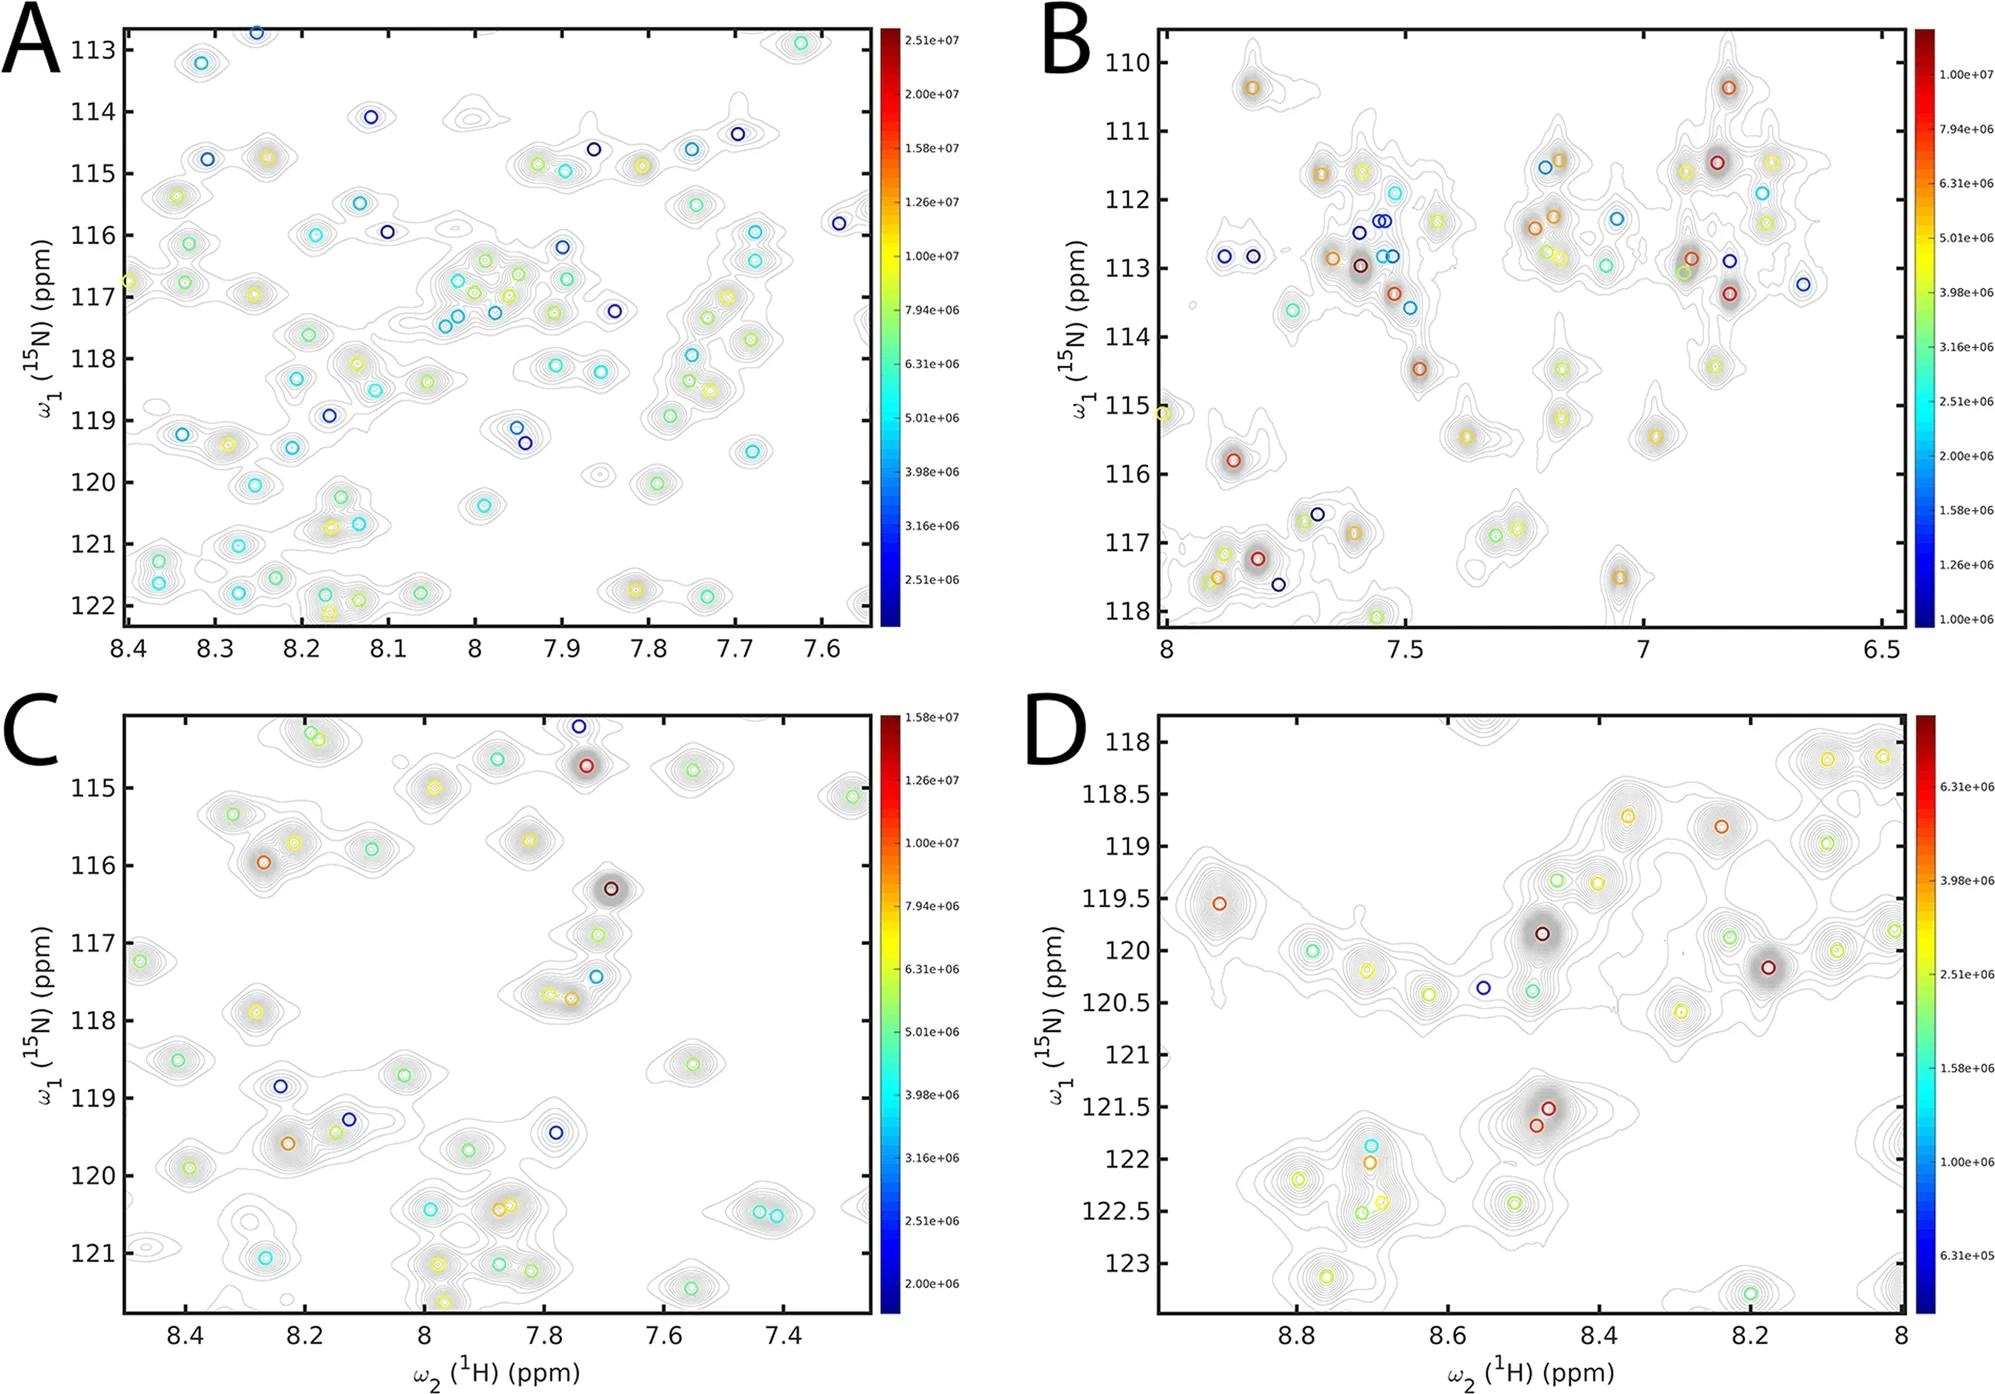 DEEP Picker identifies cross-peaks in 2D ^15N–^1H HSQC spectra from four proteins, with detected peaks colour-coded by signal amplitude. Image credit: Li et al, (20221).
Conclusion: Reliable Interpretation at Scale
Overall, automation has made protein-observed 2D NMR datasets easier to compare and interpret. Peak detection, tracking, CSP calculation, and outlier screening can now be run consistently across large collections of spectra, and tools, such as the plugins in the MestReNova package, reduce manual effort and reliance on individual judgement.1,3
However, manual steps such as proper preparation of samples and suitable experiment design, as well as quality control and logical scientific judgement, continue to be essential for drawing useful conclusions from large 2D NMR datasets. Automated identification of spectral perturbations also does not remove the need for biological interpretation: even a correctly measured CSP may arise from a direct contact, a local conformational response, or a long-range allosteric change.3,4,6
References and Further Reading
- Mureddu, L., & Vuister, G. W. (2019). Simple high-resolution NMR spectroscopy as a tool in molecular biology. The FEBS Journal, 286(11), 2035–2042. DOI:10.1111/febs.14771, https://febs.onlinelibrary.wiley.com/doi/10.1111/febs.14771
- Ma, R., Wang, P., Wu, J., & Ruan, K. (2016). Process of Fragment-Based Lead Discovery-A Perspective from NMR. Molecules, 21(7), 854. DOI:10.3390/molecules21070854, https://www.mdpi.com/1420-3049/21/7/854
- Peng, C., Namanja, A. T., Munoz, E., Wu, H., Frederick, T. E., Maestre-Martinez, M., Iglesias Fernandez, I., Sun, Q., Cobas, C., Sun, C., & Petros, A. M. (2022). Efficiently driving protein-based fragment screening and lead discovery using two-dimensional NMR. Journal of Biomolecular NMR, 77(1–2), 39–53. DOI:10.1007/s10858-022-00410-3, https://link.springer.com/article/10.1007/s10858-022-00410-3
- Fino, R., Byrne, R., Softley, C. A., Sattler, M., Schneider, G., & Popowicz, G. M. (2020). Introducing the CSP Analyzer: A novel Machine Learning-based application for automated analysis of two-dimensional NMR spectra in NMR fragment-based screening. Computational and Structural Biotechnology Journal, 18, 603–611. DOI:10.1016/j.csbj.2020.02.015, https://www.sciencedirect.com/science/article/pii/S2001037019305052
- Li, D. W., Hansen, A. L., Yuan, C., Bruschweiler-Li, L., & Brüschweiler, R. (2021). DEEP picker is a deep neural network for accurate deconvolution of complex two-dimensional NMR spectra. Nature Communications, 12(1), 5229. DOI:10.1038/s41467-021-25496-5, https://www.nature.com/articles/s41467-021-25496-5
- Benavides, T. L., Ramelot, T. A., & Montelione, G. T. (2026). Allosteric Protein Chemical Shift Perturbations are Ubiquitous. bioRxiv : the preprint server for biology, 2026.05.04.722792. DOI:10.64898/2026.05.04.722792, https://www.biorxiv.org/content/10.64898/2026.05.04.722792v1
Last Updated: Oct 8, 2026