Nuclear magnetic resonance (NMR) spectroscopy is an innovative spectroscopic technique used to observe the local magnetic fields of specific atomic nuclei.
This opening sentence probably doesn’t capture your attention, nor entice you to read on. It isn’t beneficial to readers that are active in the field of magnetic resonance analysis, nor educated professionals that are interested in leading spectroscopic techniques. It is the sort of cerebral concept that is best shared in a visual format.
Infographics are unique pieces of content that compound complex data, imagery, and text into a neat aesthetic package. It can succinctly highlight the capacities of a complicated analytical method such as NMR spectroscopy in a uniquely attractive way.
The reason infographics perform so well is that they speak to the mindset of the average digital user, performing on three key fronts. They are:
- Attractive
- Easily-digestible
- Shareable
In this blog post, we will explore the performance of infographics in more detail with a focus on a successful infographic targeting NMR spectroscopy for food sample analysis.
NMR Spectroscopy and the ‘Buzz’ About Fake Honey
The underlying beauty of an interesting infographic is its ability to synthesize information and aesthetics to highlight data patterns and conclusions with a unique sense of character.
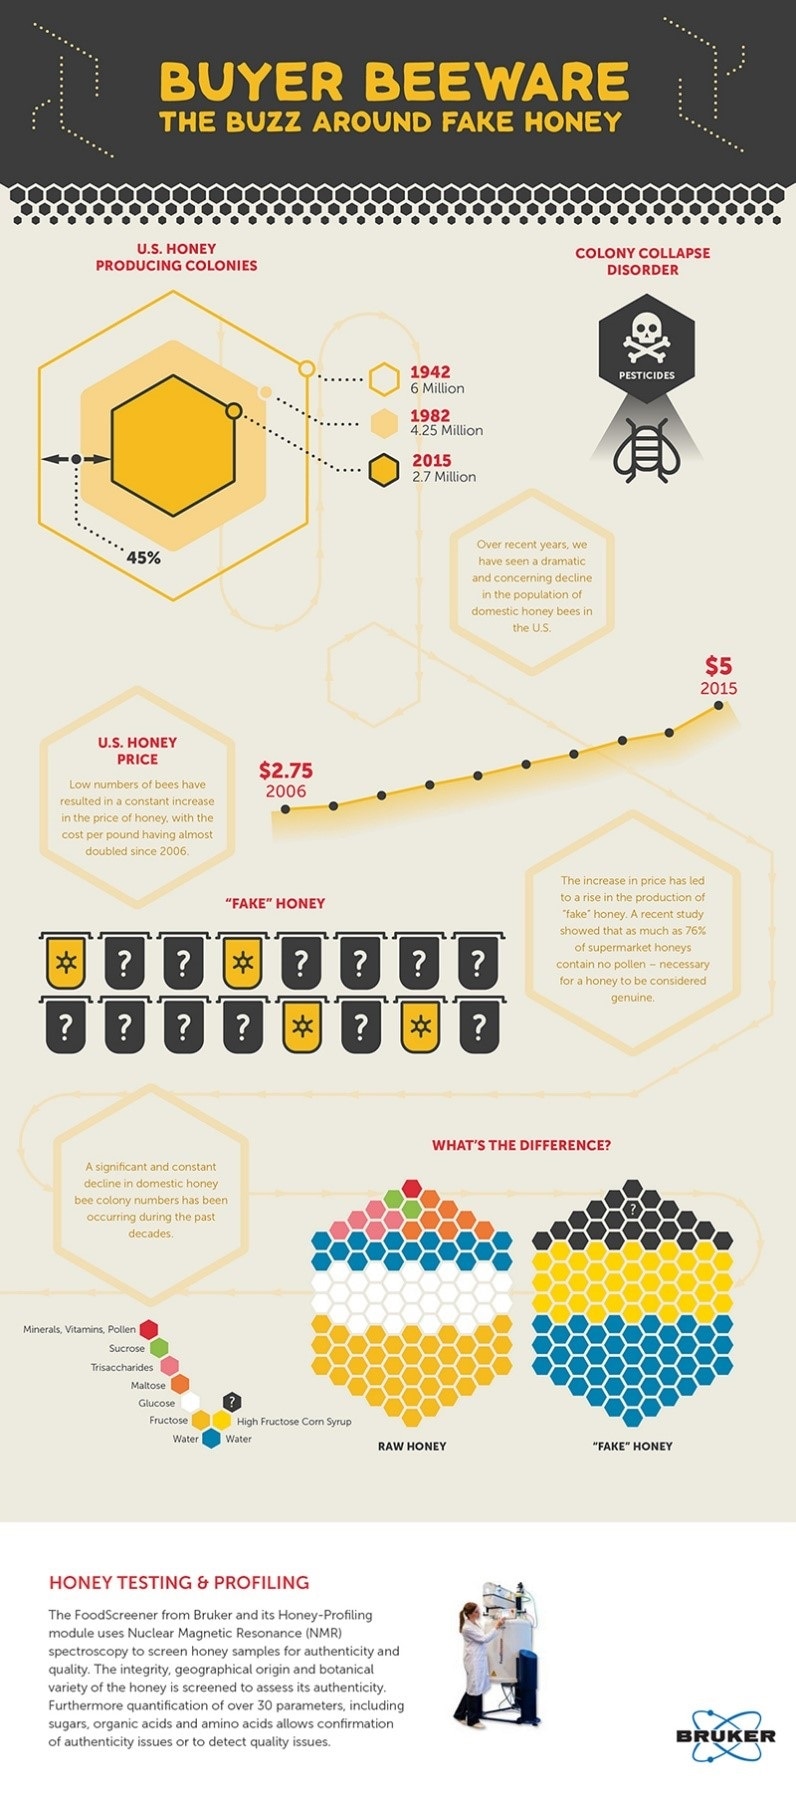
The Buzz Around Fake Honey is an infographic from AZoNetwork for Bruker. We designed it to highlight a novel Honey-Profiling module for their FoodScreener product, which used NMR spectroscopy to determine the authenticity and quality of honey samples. This could have been conveyed in a blog post with links back to the product page to enhance site rankings on Google. It could have been explored in a whitepaper, which may have enticed interested readers to engage with the content and potential complete form submissions.
These strategies are perfectly valid for marketing science stories. However, the commercial applications of the Honey-Profiling module represented a potentially broader readership that might be inaccessible via these established channels. Professionals with an interest in food purity might never come across text-based content regarding NMR spectroscopy through organic or paid search. They are much more likely to discover an interesting infographic, however.
AZoInsights: Infographics are as much as 3x more likely to be shared on social media than any other form of content. Search traffic for infographics increased by over 800% in just a two-year period.
In the old storytelling adage, it is better to show rather than tell. With the Bruker infographic, we showed the narrative hook of this application of NMR spectroscopy with striking visuals that conveyed relevant data.
 The infographic is structured around the widely-publicized factor of bee colony collapse. It draws interest by making the niche concept of NMR spectroscopy as broadly applicable as possible.
Instead of bludgeoning readers with a damning introductory paragraph of environmental change, the infographic conveys the facts with immediacy.
This information flows naturally through via a narrative leading towards the importance of Bruker’s Honey-Profiling module.
Conclusive data was conveyed through clear and visually-attractive side-by-side charts for comparison at a glance. It is easy to understand the compositional variations between raw and ‘fake’ honey with a beehive-like arrangement of hexagonal data sets.
Then, in a simple closing statement, Bruker and the product are introduced. There is no need to labor the point as the benefits of the product speak for themselves.
Compressing multimedia and information in this manner makes content inherently more shareable. This in-turn drives website tragic and user-brand engagement, thus organically expanding the site’s radius of visibility to search engines.
Interesting Infographics from AZoNetwork
AZoNetwork is one of the world’s foremost science marketing organizations with demonstrable expertise providing quality infographics for customers in some of the most complex fields of research.
As well as the NMR spectroscopy infographic, we also designed Seeing the Unseen: Using Electron Paramagnetic Resonance to Detect Free Radicals for Bruker.
If you would like any more information, please do not hesitate to contact us.
About AZoNetwork
Having worked in the Advanced Ceramics industry for over a decade in the 90’s, founder, Dr. Ian Birkby recognized that engineers, designers and scientists often required educating in the potential uses and applications of Advanced Materials before they could utilize them in their products and processes.
This recognition of market demand and the emerging power of the internet led to the launch of our first site, AZoM.com – The A to Z of Materials in 2000.
Although the business has grown significantly to include a range of science, technology, medical and life science platforms, it has always stayed true to its principal aim:
We love telling science, technology and medical stories to people who can make a difference. Everything else follows from that.
Today we tell these stories across all digital platforms to a monthly addressable audience in excess of 5 million unique individuals.
Our customers come from all scientific, technological and medical sectors. Our extensive web footprint and subscriber base allows us to display a measurable return on investment to billion dollar multi-nationals and SME start-ups.
From Content Creation, through targeted distribution to closing the loop with the unique AZoIntel Content Performance analytics platform, AZoNetwork now provides a highly effective Science Marketing Platform based on its own unique Marketing Science.