Sponsored Content by Vitrek LLCReviewed by Maria OsipovaSep 18 2025
This article discusses constructing a medical acoustic microscopy system, focusing on the PC-based high-performance GaGe RazorMax digitizer. Three key features of RazorMax’s operation are examined: the use of Dynamic Range Expansion (DRE) to improve the detectability of small ultrasonic echoes, high-speed PCI Express Data Streaming for maximum scanning speed, and GaGe’s Trigger Out signal for efficient and synchronous ultrasonic triggering.
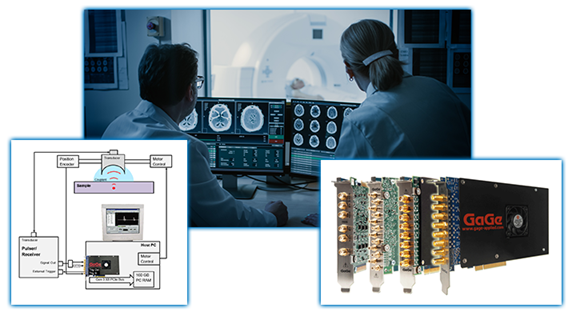
Image Credit: Vitrek LLC
Traditional ultrasonic imaging systems usually transmit broadband ultrasonic pulses through the full sample volume under study. By analyzing these pulses, researchers can measure sample thickness, detect reflective flaws, identify interfaces between different materials, and study inherent material characteristics such as elastic moduli.1
Although these imaging systems allow the entire sample volume probing, they are often limited to lower ultrasonic frequencies due to the sample’s extreme ultrasonic attenuation, which increases rapidly with frequency.
For instance, 10 MHz ultrasound will only travel several millimeters into soft biological tissue before experiencing severe attenuation. However, despite undesired rises in attenuation, the ultrasonic wavelength decreases proportionately with increasing frequency, consequently improving system spatial resolution. Higher frequency ultrasonic systems, therefore, inherently deliver superior spatial resolution.
Configuration
Higher frequency ultrasonic systems are commonly referred to as acoustic microscopes, with an example illustrated in Figure 1. These systems often employ ultrasound from 35 MHz to 1 GHz and beyond. Due to increased signal attenuation, the sample can only be probed within a few millimeters of its surface.
Microscopy systems typically utilize a focused transducer to maximize signal intensity and spatial resolution. The focused transducer is coupled to the sample using a droplet of ultrasonic couplant—usually water—that the transducer drags along as it is robotically positioned in a scan pattern across the sample surface.
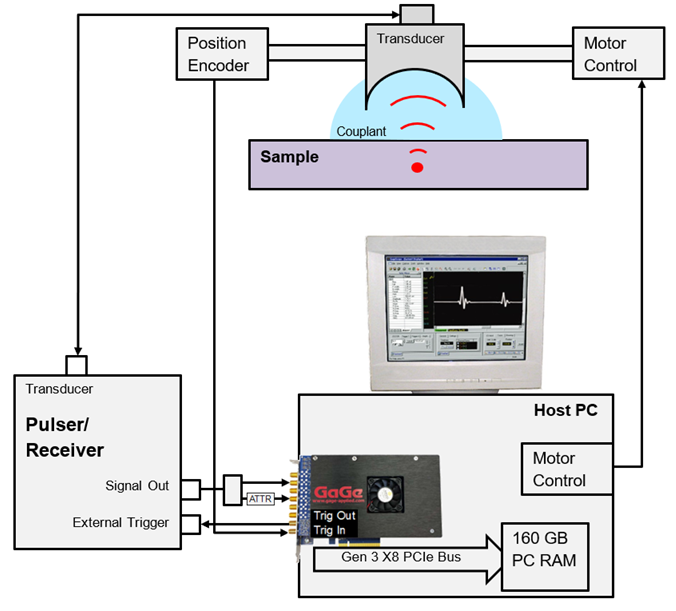
Figure 1. Block Diagram of Scanning Acoustic Microscopy System. The red dot indicates the focal point of the transducer. Signal Out from the Pulser/Receiver is split in two by an RF splitter – one of whose outputs passes through a passive attenuator (ATTR) before entering the GaGe RazorMax digitizer. Image Credit: Vitrek LLC
The transducer’s focal distance defines a plane within the sample parallel to its scanned surface. Moving the transducer perpendicular to the surface may adjust this plane's position slightly. For larger changes, transducers with differing focal distances can be employed. Contemporary microscopy systems now utilize segmented transducers whose focal depth can be quickly varied by altering the segment excitation pattern.
Like traditional ultrasonic imaging systems, microscopy systems excite the transducer with a broadband high-voltage excitation. The same transducer then detects echoes reflected from scatterers within the sample.
Figure 2 depicts typical ultrasonic waveforms that exhibit simple echoes from both the sample’s front wall and a scatterer at the transducer’s focal point, indicated in Figure 1.
Scatterers consist of interfaces between materials with differing acoustic impedance, which reflect ultrasound and provide contrast for images. The depth of a scatterer is derived from the standard ultrasonic relation:
Depth = vΔt/2
where v represents the acoustic propagation speed through the sample medium and Δ t is the elapsed time between the two echoes. The factor of 2 accounts for the round-trip taken by the ultrasonic pulse. Further details come from the amplitude ratio A2 /A1, which decreases with attenuation by the media, as well as with scatterer depth, size, and contrast.
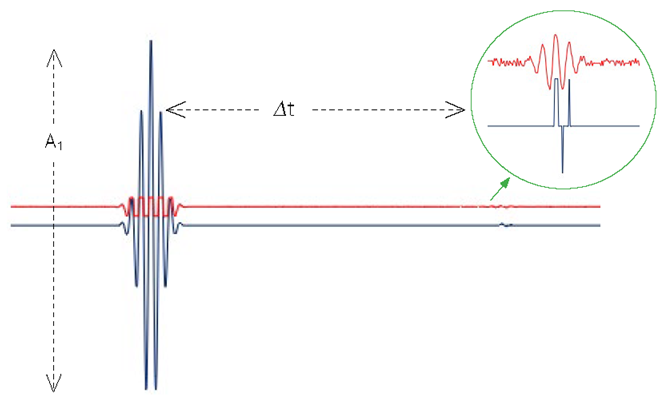
Figure 2. Two simulated ultrasonic signals sampled at 1 GS/s that each contain two reflected echo pulses. The first echo is from the front sample surface and the second echo is from an embedded scatterer, which is shown in a magnified view within the green circle. Vertically separated for clarity, blue and red signals indicate unamplified and amplified signals, respectively, as described in the text. Conventional echo separation (Δt) and echo amplitudes (A1 and A2) are shown with dashed lines. Image Credit: Vitrek LLC
Acoustic microscopes can unveil internal sample interface structures by detecting echoes reflected from internal sample structures. Focused transducers can also detect additional ultrasonic echoes resulting from ultrasonic mode conversion, surface waves, or from dispersed, non-abrupt structures.
While understanding the nature and origin of all detected echoes is ideal, acoustic microscopes can also be operated phenomenologically by using ultrasonic contrast to reveal beneficial information regarding the sample interior without requiring a complete understanding of its exact cause.
A medical research client sought to build an acoustic microscope to scan biological tissue samples using ultrasonic frequencies up to 250 MHz, with a typical frequency range of 70 MHz. The researcher required a digitizer with high vertical resolution to detect tiny echoes and wished to sample at up to 1 GigaSample per second (GS/s). The digitizer had to acquire waveform lengths accommodating sample depths of up to 6 millimeters.
The GaGe RazorMax CSE161G2 is a two-channel digitizer capable of sampling at up to 1 GS/s, as required. The RazorMax is a PC add-on card located within a PCI Express Gen3 x8 slot, available in most contemporary commercial PCs. The RazorMax’s 16-bit resolution allows for a significantly low detection threshold for echoes, which can be increased even further, as will be seen later on.
For a 6-mm depth requirement, the sound will make a worst-case return trip of 12 mm, rounded up to 15 mm. A propagation speed estimate of 1500 m/s for tissue samples requires capturing the ultrasonic signal for 10 microseconds (μs) after excitation. With the RazorMax’s 1 GS/s sampling rate, these acquisitions will need an acquisition rate of (10 μs) /(1 GS/s) = 10,000 Samples.
The RazorMax can re-arm itself between successive waveform acquisitions within 1 μs. As a result, the RazorMax can trigger at rates of up to 90 kHz (= 1 / (10 μs + 1 μs) without missing triggers. The system will acquire waveforms at several positions scanned within a rectangular grid pattern. All operations are controlled by a C programing language-based Windows application.
This article details three methods employed in this application to enhance ultrasonic signal acquisition:
- Using Dynamic Range Expansion (DRE) to improve small echo detectability
- High-speed PCI Express Data Streaming for maximum scanning speed
- Efficient and synchronous triggering with GaGe’s Trigger Out signal
Dynamic Range Expansion (DRE)
Ultrasonic signals typically exhibit a high dynamic range, containing both high and low amplitude echoes within the same signal. To extend the digitizer’s minimum detectable echo threshold, Dynamic Range Expansion (DRE) will be employed.2
To implement DRE, the raw ultrasonic signal must be split with an RF power splitter. The splitter's two outputs connect to two digitizer input channels after being subjected to different external amplifications or attenuations.
Figure 2 illustrates a simulated two-channel acquisition of an ultrasonic signal. Shown respectively in blue and red, the first splitter output signal is connected directly to the first digitizer channel, while the second signal passes through a 20X (26 dB) amplifier before connecting to the second digitizer channel.
These signals were simulated at 8-bit digitization to clearly demonstrate DRE’s capability. The blue unamplified signal demonstrates acquisition of the first echo, as it vertically spans most of the digitizer’s 256 digital levels (28 = 256).
However, since it is 20 times smaller than the first echo, the second echo spans only two or three levels, as depicted in the magnified view of the blue signal. If it were any less than one-256th of the first echo’s amplitude, this second echo would have been missed entirely.
With its external amplification of 20X, the red signal in Figure 2 demonstrates that the first echo saturates the input, suffering extreme clipping. However, the magnified view provides an exceptionally higher fidelity view of the second echo in red, as it now spans most of the 256 digital levels rather than just two or three, as before.
The essence of DRE is to utilize each echo’s signal from the channel that most optimally accommodates it – namely, the unamplified channel for the larger first echo and the amplified channel for the smaller second echo.
DRE functions only because the high- and low-amplitude echoes are separated in time, allowing assessment on different channels at different periods. DRE would not function, for instance, if the high- and low-amplitude components were separated in the frequency domain, as the signal’s resultant ubiquitous saturation would render it useless.
In addition to requiring temporal separation of differing amplitude signal components, DRE requires two digitizer capabilities. First, the simultaneity of the two input channels must be exceptional. Otherwise, interchannel time-skew will distort Δt measurements. The RazorMax offers exceptional inter-channel alignment with negligible channel skews under 30 picoseconds.
Second, the RazorMax’s recovery time from saturation must be fast enough to avoid signal distortion following saturation until the second echo. Figure 2 shows the RazorMax’s recovery time to be under 1 nanosecond, which is sufficient. Both the RazorMax and the user’s signal, therefore, meet all the necessary requirements for DRE.
Unlike the 8-bit simulated case shown in Figure 2, where signal amplification was applied, Figure 1 demonstrates that the second signal passes through a signal attenuator. This compact, passive, in-line attenuator delivers 12 dB (4X) of signal attenuation without any degradation before the signal enters the 16-bit RazorMax’s optional ±240 milliVolts input range.
Although the enhancement provided by DRE in this real case is less dramatic than in the simulation in Figure 2, the 4X signal amplitude difference will allow DRE to enhance the echo detectability threshold by up to four times.
PCI express streaming acquisition
The client’s data throughput and data volume place strict demands on the digitizer. As mentioned previously, typical waveforms contain 10,000 samples on two channels. The 70 MHz ultrasonic frequency provides an ultrasonic wavelength in water (v ≈ 1500 m/s) of (1500 m/s) / (70 MHz) ≈ 20 μm. This wavelength approximates the diameter of the region isonified by the transducer at its focal point.
For accuracy, the diameter should be commensurate with the spatial scanning increment. Accordingly, scanning was performed in a rectangular 2D grid with a 20 μm increment in each direction. With 2048 X 2048 grid points, the total grid area is about 40 mm X 40 mm.
The total data volume is:
Total Data per Image = 2 Ch * 2 Bytes/Sample * 10000 Samples/Waveform
* 2048 Waveforms/Line * 2048 Lines/Image
≈ 160 GigaBytes/Image
The RazorMax’s large 8 GB onboard memory is insufficient to store the 160 GB of data required for a single image. In standard GaGe Memory Mode, this issue is addressed by stopping acquisition once its onboard memory is full and downloading all its data. This download delay, however, slows overall scan time significantly.
The RazorMax’s onboard memory is dual-port – its contents may be written to and read from concurrently. This characteristic enables RazorMax Streaming Mode, in which waveform data is streamed directly to the PCI Express (PCIe) bus via its onboard memory that serves as a FIFO to absorb small bus latencies. Under the right conditions, Streaming Mode acquisition does not require interruptions to download data, allowing for uninterrupted scanning.
While more robust than Memory Mode, Streaming Mode is more sophisticated and imposes three limitations. First, the aggregate data rate from the RazorMax must not exceed the PCIe bus speed; otherwise, new waveform data will fill the RazorMax’s onboard memory faster than it can be emptied by the PCIe bus, eventually leading to memory overflow and data loss.
Likewise, the aggregate data rate must not exceed the rate at which the Streaming Target can consume the data stream; otherwise, an overflow will occur. For instance, multiple parallel storage drives are often configured in a RAID array to allow for a high streaming rate.
Finally, software applications operating in Streaming Mode must not be written in inefficient high-level languages that bottleneck the instantaneous throughput of the streamed data. Ideally, the software should be written in C, which the user has already selected.
If the acquired data stream were perfectly continuous, the RazorMax’s aggregate output data rate for this application would be:
Data Rate = 2 Channel * 2 Bytes/Sample * 1000 MS/s = 4 GB/s
The actual data rate will be under 4 GB/s since acquisition will not be fully continuous but instead broken up by dead spaces between the 10,000 triggered sample waveforms. The GaGe RazorMax can sustain data streaming rates indefinitely up to 5.2 GB/s through its PCIe Gen3 x8 interface, which provides sufficient speed for this application.
PC RAM serves as the PCIe Target for the RazorMax’s data stream. In fact, in all streaming acquisitions, the RazorMax streams its data to a pair of dual-toggling PC RAM buffers, from which it is then transferred to the Target.
These buffers are allocated using special memory allocation routines provided by GaGe, since the RAM that constitutes them must be physical, contiguous, and limited in size (10 MB is typically used). In this application, the user must allocate a 160 GB standard RAM buffer, which is virtual and non-contiguous.
The toggling buffers are emptied into this 160 GB conventional buffer. Since the associated memory copy operations are extremely fast, the RAM can easily keep up with the incoming data stream.
After acquisition, the software application stores all raw waveform data in PC RAM. From there, different sections of the data can be virtually examined, cropped, and used to map images of ultrasonic parameters extracted from the raw waveforms. The user does not need to store the enormous volume of raw waveform data, but may instead save only cropped data subsets or even just reduced images.
Synchronous triggering
Traditionally, ultrasonic systems configure a pulser/receiver to generate ultrasonic excitations at regular intervals. The pulser/receiver typically features a Sync pulse output coinciding with ultrasonic excitation, which can then be utilized to externally trigger the digitizer.
A limitation in this triggering scheme is that the Sync pulse is asynchronous or unrelated to the RazorMax’s 1 GHz sampling clock. Figure 3 illustrates the consequences of this asynchronicity: Sync pulses from the pulser/receiver are represented by multiple black trigger edges. These edges all result in the same indicated Trigger Point – regardless of whether the edge occurs just after the last Pre-Trigger Point or just before the Trigger Point. This ambiguity causes the corresponding repetitive signal acquisitions to dance left and right by exactly one sample. This one-sample jitter is not due to a flaw in the GaGe digitizer, but is rather a fundamental consequence of an asynchronous clock and trigger.
Since the most critical ultrasonic parameters are often the positions of echo pulses, asynchronous triggering inherently limits these echo position measurement precision to one sample.
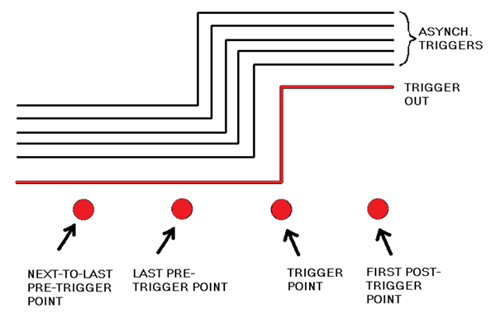
Figure 3. Diagram indicating repetitive asynchronous triggers in black, whose edges wander in time with respect to the sample points. By contrast, the RazorMax’s synchronous Trigger Out pulse (shown in red) has an edge position that is fixed with respect to the sample points. Image Credit: Vitrek LLC
As with all GaGe digitizers, the RazorMax features a synchronous Trigger Out pulse, with its timing shown in Figure 3. In contrast to the black asynchronous triggers in Figure 3, the Trigger Out pulse is synchronous with the RazorMax’s sampling clock, so its rising edge always occurs at the same sampling clock phase.
Accordingly, if the RazorMax acquires the Trigger Out pulse, then it does not jitter by one sample. Instead, it exhibits a significantly smaller jitter equal to the analog electrical jitter associated with the RazorMax’s components, which tends to be less than one-tenth of a sample. External triggering of the pulser/receiver with the Trigger Out pulse causes the ultrasonic excitation to inherit the synchronicity of the Trigger Out pulse and also exhibit low jitter.3
As illustrated in Figure 1, the original source of the trigger pulse is the Position Encoder, which generates a pulse when the transducer reaches the next measurement position. This encoder functionality can be referred to as Pulse on Position (PoP).
This configuration removes the need for slow and non-deterministic software communication between the Position Encoder, the PC, and the RazorMax that could slow down scanning speed. Instead, the Position Encoder directly triggers the RazorMax in hardware, requiring no other synchronization through software.
The RazorMax automatically generates the Trigger Out pulse upon its external triggering by the Position Encoder, which then synchronously triggers the ultrasonic excitation. Using the triggering scheme described, the RazorMax provides the least possible signal jitter by using synchronous triggering of the ultrasonic pulser receiver.
Moreover, the fastest scanning time is obtained by triggering the RazorMax with a hardware trigger from the Position Encoder.
Conclusion
The GaGe RazorMax demonstrates all the digitizer capabilities required for the application: namely, high 16-bit resolution for detecting small echoes, high 1 GS/s sampling rate for the 70 MHz ultrasonic signal, a convenient PC form factor, and affordability.
This article further shows that the RazorMax can enhance its exceptional echo detectability threshold even further through DRE. The RazorMax’s ability to stream data at rates above 5 GB/s allows for 0% dead-time, with continuous acquisition of ultrasonic waveforms throughout the scan.
Finally, synchronous triggering from the Position Encoder maximizes ultrasonic triggering speed while minimizing trigger jitter. All methods detailed in this study are applicable to other fields, including laser microscopy and lidar.
Acknowledgments
Produced from materials originally authored by Andrew Dawson, Ph. D-GaGe (a Vitrek brand).
About Vitrek LLC
Since 1990, Vitrek has provided innovative global solutions for high voltage test and measurement including electrical safety compliance testers, multi-point high voltage switching systems and graphical power analyzers. The recent acquisition of MTI Instruments expands their test and measurement portfolio to include non-contact measurement devices, portable signal simulators and calibrators, semiconductor/solar metrology systems and turbine engine/rotating machine balancing. The acquisition of DynamicSignals’ portfolio adds a wide array of board-level data acquisition and integrated real-time RF record/playback system solutions from GaGe, KineticSystems and Signatec. Vitrek also supplies precision high voltage measurement standards to national laboratories and calibration labs around the world. This unique and complementary combination of product and engineering capabilities positions Vitrek as a leading provider of test solutions serving the photovoltaic, medical equipment, power conversion, electrical/electronic component, semiconductor, aerospace and appliance industries. Vitrek is an accredited ISO 17025 Calibration Laboratory.
Sponsored Content Policy: News-Medical.net publishes articles and related content that may be derived from sources where we have existing commercial relationships, provided such content adds value to the core editorial ethos of News-Medical.Net which is to educate and inform site visitors interested in medical research, science, medical devices and treatments.