Sponsored Content by InProcess-LSPReviewed by Olivia FrostJun 11 2026
For developers of viral gene therapies, understanding the formation and stability of transfection complexes is a critical process insight, as their size is a key determinant of cellular uptake and, consequently, viral vector productivity.
During transfection, plasmid DNA and delivery reagents self-assemble into nanoparticles that must interact with the cell membrane and enter cells through endocytic pathways.1 Complexes that are too small may exhibit reduced cellular association, while excessively large particles can sediment, aggregate, or be internalized less efficiently (see Figure 1).2
As a result, transfection efficiency is often highly sensitive to particle size and size distribution. These factors directly influence transfection efficiency, vector yield, process consistency, and ultimately product quality. This article outlines the use of SR-DLS to compare particle size kinetics of the most popular transient transfection reagents.
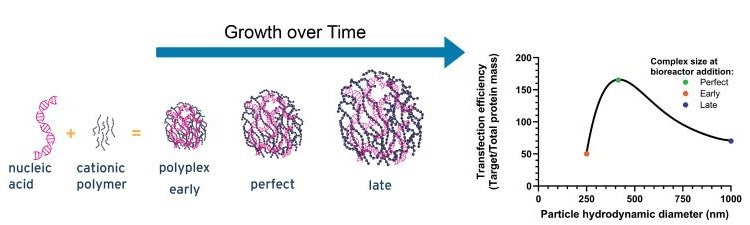
Figure 1. An illustrative graph showing the influence of pDNA-PEI complex size on transfection efficiency. Image Credit: Hu, Y., et al. (2024)2
Several factors in viral vector production, in both AAV and lentiviral manufacturing, can influence complex size. Changes in mixing conditions, reagent ratios, or incubation times can alter complex growth kinetics, leading to differences in cellular uptake and downstream productivity.
Monitoring transfection complex size over time therefore provides valuable process insights, enabling manufacturers to identify optimal transfection conditions, improve batch consistency, and maximize viral vector yields.3
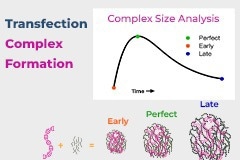
Image Credit: InProcess-LSP
Different transfection reagent suppliers, processes, and drug products
Not all transfection reagents form complexes in the same way. Differences in chemistry, formulation, and recommended protocols can significantly influence how rapidly transfection complexes assemble, grow, and stabilize.
Lipid-based reagents typically form lipoplexes through electrostatic interactions with DNA, while polymer-based systems generate polyplexes with different packing densities, surface properties, and structural stability.
In addition, supplier-specific recommendations regarding reagent-to-DNA ratios, mixing order, incubation times, and buffer conditions can alter complexation kinetics and the resulting particle size distribution.1,3
Monitoring the nanoparticle size kinetics of the complexes produced under sterile conditions is complex and typically requires sampling, dilution, and offline DLS analysis. This introduces delays, contamination risks, and potential alteration of the complexes themselves.
The NanoLabSizer (NLS), based on Spatially Resolved Dynamic Light Scattering (SR-DLS), offers a fundamentally different approach.
By measuring hydrodynamic particle size directly through closed containers, bags, syringes, and process vessels without opening or contacting the sample, the NLS enables sterile, continuous, non-destructive monitoring of transfection complex formation and evolution in real time.
The technology measures particle size at native concentration and requires no dilution or sample preparation, preserving the true state of the complexes throughout the process.
In this study, five transfection reagents from the most popular suppliers were tested. Together, these suppliers are responsible for more than 90% of the transfection reagent market.
All kinetics monitoring studies were performed using the supplier-specified protocols and comparable plasmids in 15 mL Falcon tubes using the NanoLabSizer.
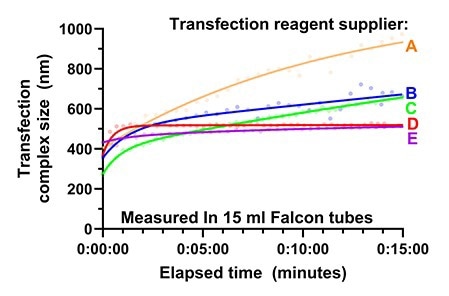
Figure 2. A direct comparison of transient transfection complex formation kinetics using five popular reagent supplier protocols and transfection reagents. Image Credit: InProcess-LSP
The data (Figure 2) reveal significant differences in both the rate and extent of transfection complex growth among suppliers.
Supplier A displays the most pronounced growth kinetics, with complexes increasing rapidly from approximately 400 nm to ∼900 nm over the measurement period. This suggests continuous particle growth or aggregation after initial complex formation, resulting in the largest final complexes.
Suppliers B and C exhibit intermediate behavior. Both show rapid initial assembly followed by slower, sustained growth, reaching final sizes of approximately 700 nm and 650 nm, respectively. These profiles indicate ongoing structural rearrangement or gradual particle association after mixing.
Suppliers D and E produce comparatively stable complexes. After an initial increase in size, both quickly approach a plateau near 500 nm with minimal subsequent growth.
Reagents that continue growing for extended periods may be more sensitive to incubation time, mixing conditions, and scale-up effects, potentially increasing batch variability. Conversely, reagents that rapidly reach a stable particle size may offer greater process robustness and reproducibility, but they may also produce particles that are too small, reducing transfection efficiency.
Understanding these kinetic profiles helps gene therapy manufacturers select the most suitable reagent and optimize process performance.
The NanoLabSizer and SR-DLS technology
The NanoLabSizer (NLS) is an analytical instrument developed to address major pain points in particle-size monitoring across different processes (Figure 3A). The NLS can be used to measure (sub)micron hydrodynamic particle size ranging from 5 nm to 5 µm. The measurements are based on SR-DLS.
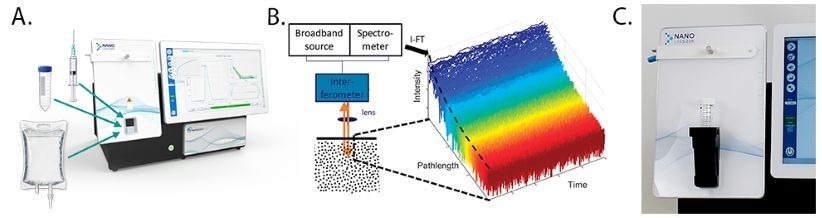
Figure 3. A. NanoLabSizer setup for non-invasive measurements. B. SR-DLS employs a different setup than DLS to acquire spatially resolved data. Interferograms from the spectrometer are transformed to give the scattered light from each depth in the sample. High-speed acquisition reveals fluctuations in this scattered light at different depths (blue: close to the wall, red: deeper in the suspension). C. Falcon tube in a dedicated holder in front of the NanoLabSizer. Image Credit: InProcess-LSP
SR-DLS (as well as standard DLS) is based on measuring the diffusion rate of particles suspended in a liquid by illuminating them and analyzing the fluctuations in the scattered light signal at a given collection angle.4
By computing decorrelation functions of the scattered signal, their diffusion constant , or its distribution, can be measured, which can be translated into the hydrodynamic size and size dispersity of the diffusing particles via the Stokes-Einstein relation.5
SR-DLS differs from conventional DLS in a number of ways. First, the collection angle is 180° (full backscattering), which means the measurements are independent of the sample container geometry, as they can be performed even through curved or rounded vessel walls, such as in tubes (Figure 3C).
Second, SR-DLS implements low-coherence interferometry (LCI) methods. In LCI, broadband light illuminates the samples, which are then mixed with the reference beam in an interferometer.
From the measured spectrum of this mixed signal (over all wavelengths of the light source), the scattered signals from different depths in the sample can be resolved simultaneously.
Typically, 1000 consecutive depths with a resolution of a few microns and a total depth in the sample of a few millimeters are thus analyzed. At each depth, a signal is rapidly acquired, and a decorrelation function can be computed, from which particle size can be calculated (Figure 3B).
The ability to obtain a large number of correlation functions resolved in depth using a full backscattering optical setup enables measurements in flowing pipes (through dedicated flow cells) and measurements at high turbidity in curved and complex product container geometries.
In summary, the NanoLabSizer can characterize the PSD and PDI of suspensions in virtually any transparent vessel, independently of the container geometry, by using specialized modules. These modules can be custom-made upon request.
References
- Midoux, P., et al. (2008). Polymer-Based Gene Delivery: A Current Review on the Uptake and Intracellular Trafficking of Polyplexes. Current Gene Therapy, 8(5), pp.335–352. DOI: 10.2174/156652308786071014. https://www.eurekaselect.com/article/12797.
- Hu, Y., et al. (2024). Liter-scale manufacturing of shelf-stable plasmid DNA/PEI transfection particles for viral vector production. Molecular therapy. Methods & clinical development, 32(1), pp.101194–101194. DOI: 10.1016/j.omtm.2024.101194. https://www.cell.com/molecular-therapy-family/advances/fulltext/S2329-0501(24)00010-X.
- Ehrhardt, C., et al. (2006). Polyethylenimine, a cost-effective transfection reagent. Signal Transduction, 6(3), pp.179–184. DOI: 10.1002/sita.200500073. https://onlinelibrary.wiley.com/doi/abs/10.1002/sita.200500073.
- Besseling, R., et al. (2019). New unique PAT method and instrument for real-time inline size characterization of concentrated, flowing nanosuspensions. European Journal of Pharmaceutical Sciences: Official Journal of the European Federation for Pharmaceutical Sciences, 133, pp.205–213. DOI: 10.1016/j.ejps.2019.03.024. https://www.sciencedirect.com/science/article/abs/pii/S0928098719301332?via%3Dihub.
- Einstein, A. (1905). On the motion of particles suspended in stationary liquids, as required by the molecular kinetic theory of heat. Annalen der Physik , 322(8), pp. 549–560. DOI: 10.1002/andp.19053220806. https://onlinelibrary.wiley.com/doi/10.1002/andp.19053220806.
About InProcess-LSP
InProcess-LSP, headquartered in Oss at Pivot Park, is a rapidly growing, innovative company founded in 2014. Backed by a team of in-house experts - comprising physicists, chemists, and software engineers - InProcess-LSP is at the forefront of nanotechnology solutions. The company’s leading product, the NanoFlowSizer, is a cutting-edge instrument designed to deliver inline, real-time measurements of nanoparticles in solution, making it indispensable across various industries.
Utilizing Spatially Resolved Dynamic Light Scattering (SR-DLS) technology, the NanoFlowSizer enables accurate characterization of nanoparticles in flowing liquids, providing critical data such as hydrodynamic diameter, polydispersity index (PDI), and D90 within seconds.
This state-of-the-art instrument empowers both scientists and industries by offering a robust solution for analyzing nanoparticle properties, paving the way for breakthroughs in product development, improved formulations, and pioneering applications.
Innovators in Process Analytical Technology and nanoparticle characterization.
With their strong background in process analytics as well as many years of academic and industrial experience, InProcess offers a highly skilled and experienced team of scientists and process specialists addressing the needs of your PAT and nanotechnology challenges.
Sponsored Content Policy: News-Medical.net publishes articles and related content that may be derived from sources where we have existing commercial relationships, provided such content adds value to the core editorial ethos of News-Medical.net, which is to educate and inform site visitors interested in medical research, science, medical devices and treatments.