While growth charts exist for height and weight, no such standards are available to compare neuroimaging results by the individual’s age. Just as growth charts became the cornerstone of assessing growth in children, a similar approach utilizing neuroimages would be extremely useful in understanding how the brain grows, develops, and matures with age.
Study: Brain Charts for The Human Lifespan. Image Credit: Alina Bratosin / Shutterstock.com
Introduction
Brain development does not stop when a child is born. Conversely, there is an active program of brain growth and maturation that begins in utero at week 17, with the brain at a tenth of its maximum volume. This continues until the third decade of life. However, by the sixth decade of life, age-related degenerative changes begin to arise and continue until death.
The structural and functional abnormalities often associated with psychiatric disease are being recognized today. Again, preterm babies and genetic disorders of neurodevelopment are associated with structural maldevelopment with subsequent learning disabilities and mental ill-health. Along with neurodegeneration, these conditions emphasize the need for an age-referenced set of brain charts that will help measure differences in brain structure over the human lifespan.
Though magnetic resonance imaging (MRI) has become commonplace today, no attempt has been made to analyze the abundance of material available to produce a “more comprehensive and generalizable approach to age-normed quantification of MRI phenotypes over the entire lifespan.” This is due to the differences in measurements from brain images depending on the technological parameters used, statistical analytics, and even the nature of the disorder focused upon.
The current study reports such an attempt by exploiting recent more collaborative efforts.
Study findings
The researchers aimed to build their reference charts on the largest dataset with the widest range of differences. An earlier Nature paper had suggested that most neuroimaging studies use too limited a number of scans to provide accurate function-behavior links.
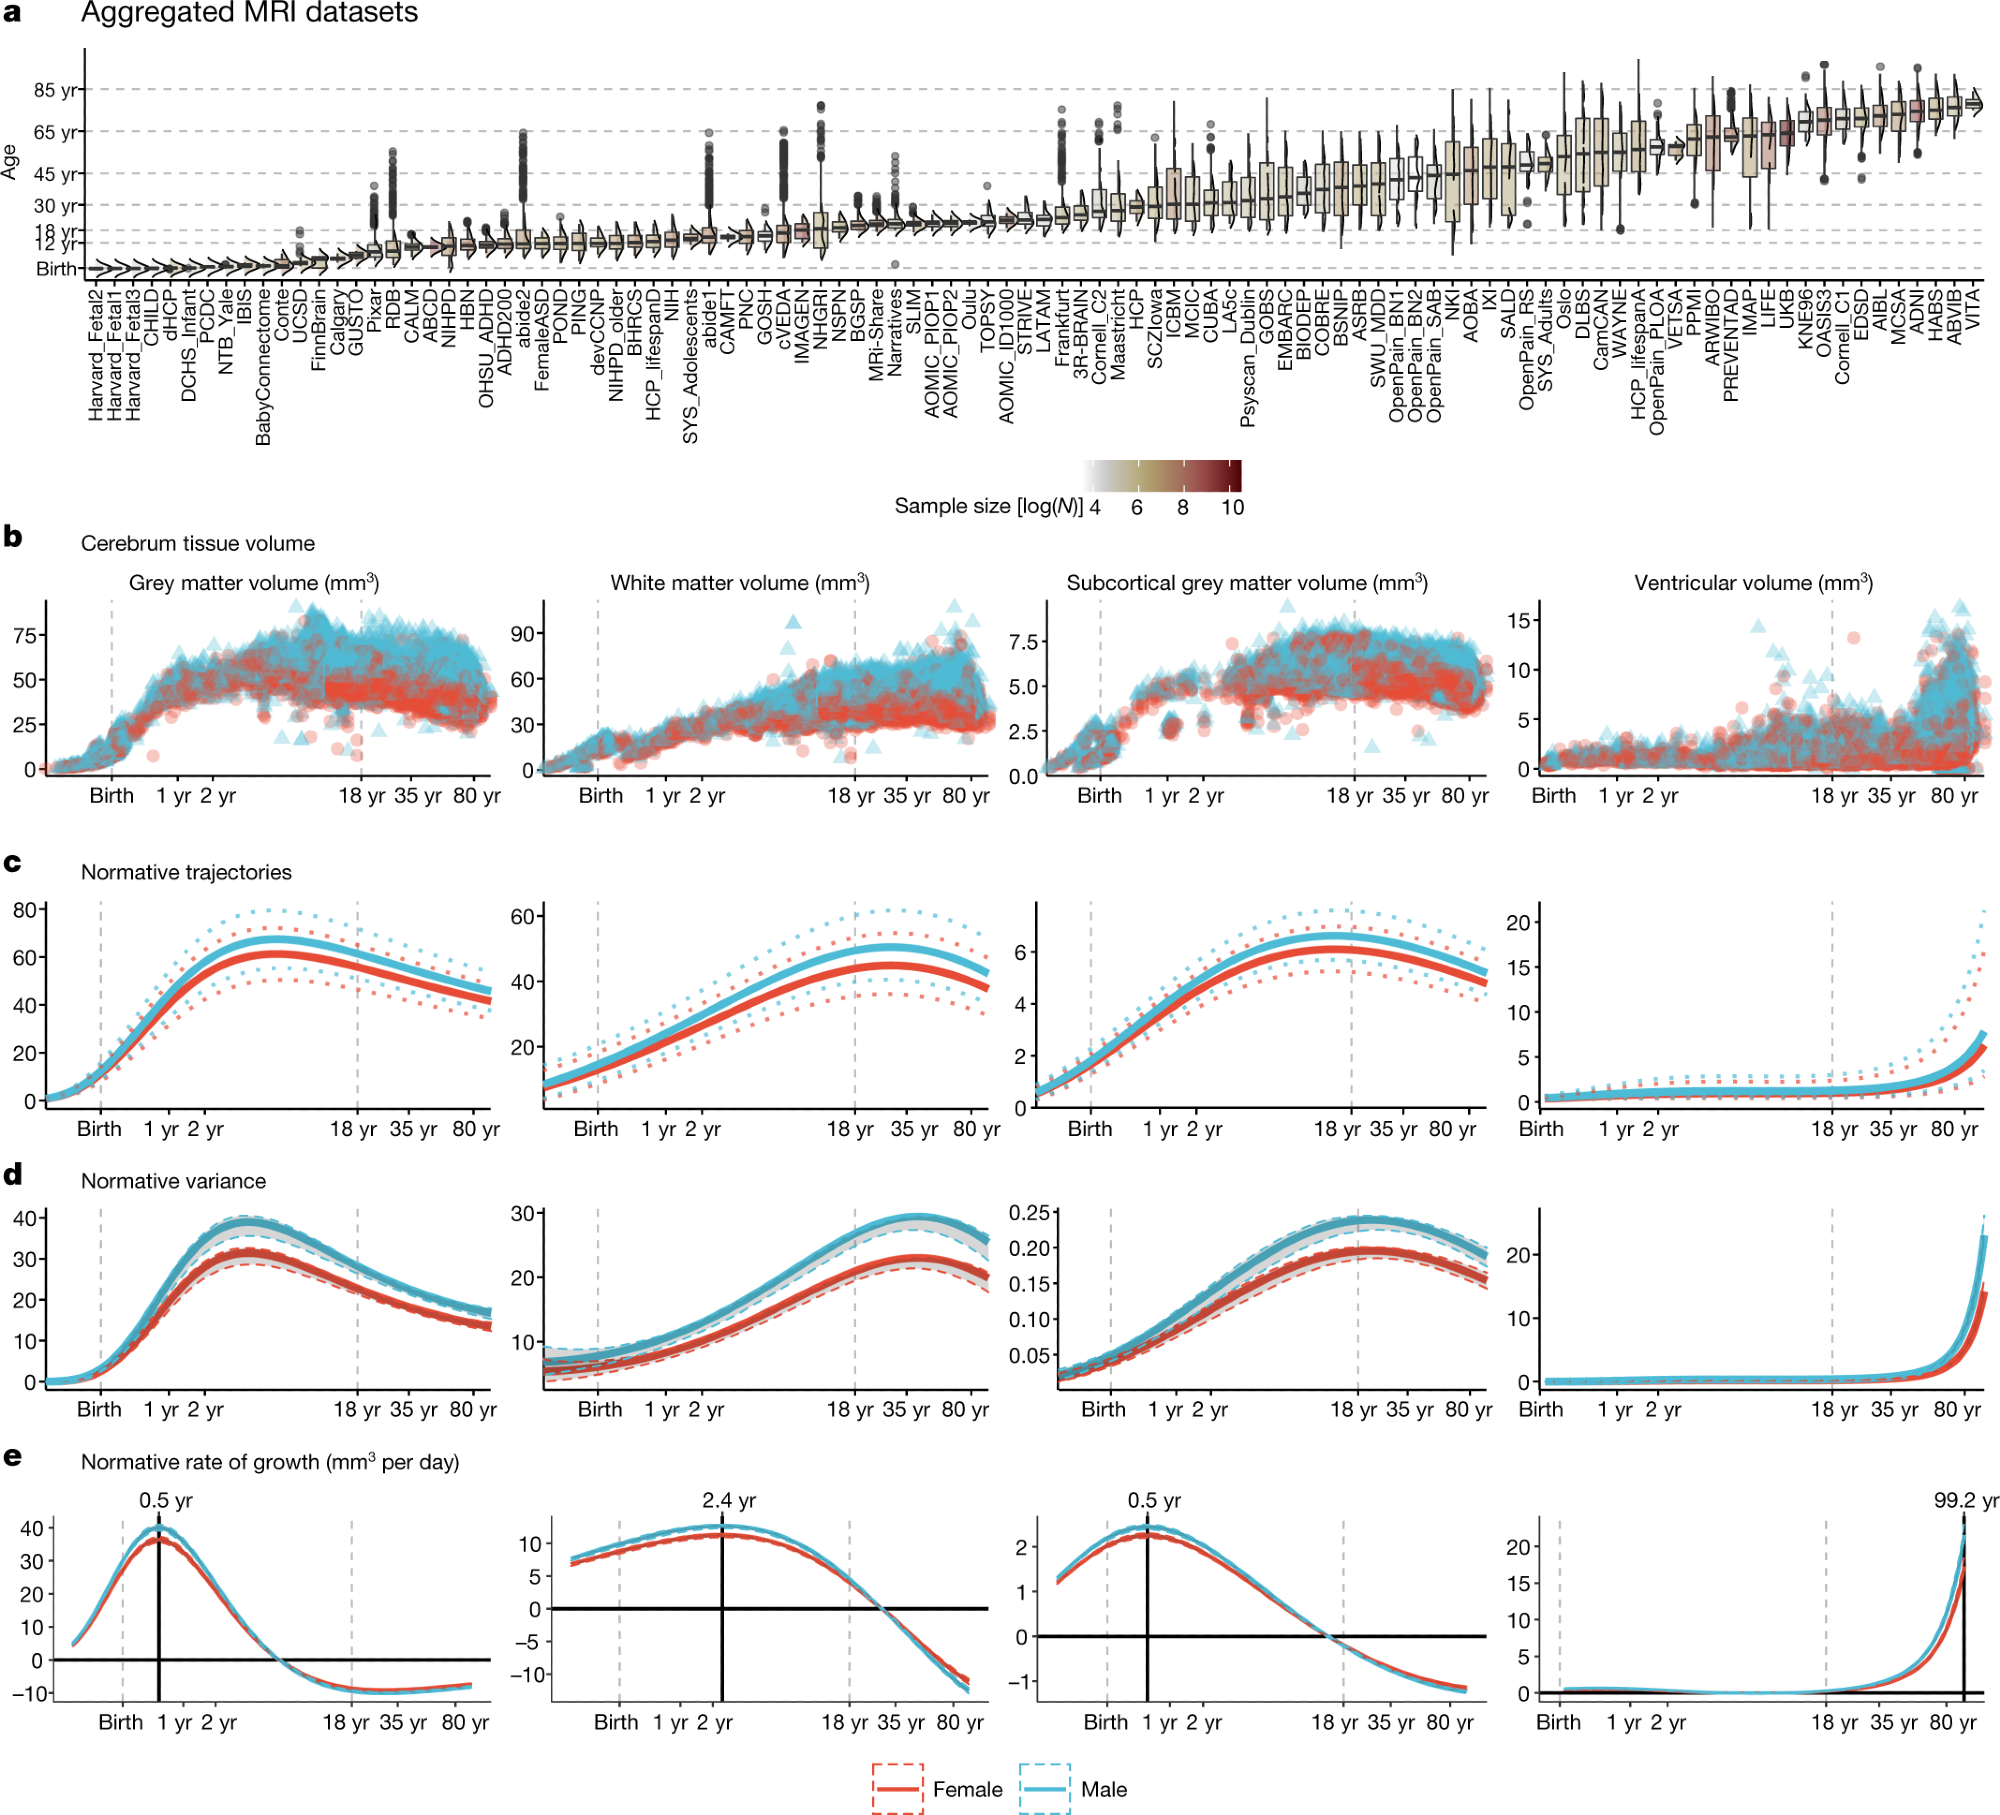
a, MRI data were aggregated from over 100 primary studies comprising 123,984 scans that collectively spanned the age range from mid-gestation to 100 postnatal years. Box–violin plots show the age distribution for each study coloured by its relative sample size (log-scaled using the natural logarithm for visualization purposes). b, Non-centiled, ‘raw’ bilateral cerebrum tissue volumes for grey matter, white matter, subcortical grey matter and ventricles are plotted for each cross-sectional control scan as a function of age (log-scaled); points are colored by sex. c, Normative brain-volume trajectories were estimated using GAMLSS, accounting for site- and study-specific batch effects, and stratified by sex (female, red; male, blue). All four cerebrum tissue volumes demonstrated distinct, non-linear trajectories of their medians (with 2.5% and 97.5% centiles denoted as dotted lines) as a function of age over the lifespan. d, Trajectories of median between-subject variability and 95% confidence intervals for four cerebrum tissue volumes were estimated by sex-stratified bootstrapping (see Supplementary Information 3 for details). e, Rates of volumetric change across the lifespan for each tissue volume, stratified by sex, were estimated by the first derivatives of the median volumetric trajectories. For solid (parenchymal) tissue volumes, the horizontal line (y = 0) indicates when the volume at which each tissue stops growing and starts shrinking and the solid vertical line indicates the age of maximum growth of each tissue. . Note that y axes in b–e are scaled in units of 10,000 mm3 (10 ml).
With this in mind, the researchers of the current study used almost 124,000 MRI scans of the brain from more than one hundred primary studies that consisted of over 100,000 participants of all ages from fetuses in utero to centenarians.
The scientists used the generalized additive models for location, scale, and shape (GAMLSS) model to create their brain charts, as this was both versatile and faithful to non-linear growth trajectories. They exploited a large amount of imaging data at their disposal to make an optimal selection of the model by empirical means.
Thus, the researchers considered total cortical gray matter volume, total white matter volume (WMV), total subcortical grey matter volume (sGMV), and total ventricular cerebrospinal fluid volume (ventricles or CSF).
Changes in volume with lifespan
Lifespan curves showed a rapid increase in GMV for the first six years of life, when it peaked, with the trajectory subsequently declining almost linearly. In comparison to earlier studies, the peak was two to three years later.
The increase in WMV also occurred until early childhood, with the peak volume at 29 years, but then rapidly decreasing after the age of 50 years. The sGMV trajectory fell between the first two, with the peak at 14 years.
While both the WMV and sGMV peaks agreed with earlier reports, CSF increased until the age of two years, then remained stable until the age of 30, following which it began to increase linearly. Finally, CSF levels increased exponentially in the sixth decade, which was a surprising finding for most scientists in this field, as it reflects brain atrophy.
The greatest variability in these measures occurred at different times. For GMV, it was at four years but late adolescence for sGMV. WMV and CSF variability peaked at the fourth decade and advanced age, respectively.
The researchers also measured other parameters, including total surface area, which is a surrogate for total cerebrum volume (TCV), that peaked at 11-12 years. Cortical thickness reached its peak at 1.7 years, agreeing with previous observations.
When observed by region, GMV showed significant differences between two and ten years, with primary sensory regions reaching peak volume earliest. These findings are also concordant with known patterns of brain development.
Developmental milestones
The velocity of growth varied, peaking in early childhood or infancy. Mean cortical thickness velocity peaked before birth in mid-pregnancy, a finding that is now being reported for the first time. Gray and white matter began to differentiate in the first month after birth as the gray matter became dominant. This period ended at three years when the difference in volume between the two compartments reached its peak.
This finding was novel and may be due to changes occurring in the myelination of nerves and the proliferation of neuronal synapses. The considerable amount of early developmental MRI neuroimaging data available in this study is likely responsible for the ability to recognize this pattern here.
Importantly, during this period, brain metabolism also shows major shifts, as the child learns to walk and talk, along with the highest velocity of change in TCV.
Centile scores
The centile scores showed a correlation with clinical disorders. The researchers generated a cumulative deviation metric, the centile Mahalanobis distance (CMD), which was a summary of brain form across all the abnormal phenotypes on MRI compared to the control group.
The greatest deviation of CMD from that of the controls occurred in adolescence, which corresponds to the period when mental disorders are more frequent, as well as in late adulthood when there is a higher risk of dementia. Further analysis showed that these phenotypes fell into one of three clusters including neurodegenerative, mood and anxiety, and neurodevelopmental disorders.
The centile scores also showed heritable patterns, thus reflecting the effect of genetics on brain structure. Thirdly, these scores showed long-term adverse effects subsequent to problems present at birth that could be recognized during adulthood. Centile scoring remained stable over time, with the most variable scores being in those who had progressive disease.
Implications
The current study showed that GAMLSS models allow MRI findings from different studies that use a variety of platforms and tools to be analyzed together. The findings were classified by the direction of structural changes in the brain and the rate of change over the human lifespan.
The study findings show that the brain changes in size over time. Interestingly, the researchers identified unexpected neurodevelopmental milestones and reflected robust correlations between neurodevelopment and age, irrespective of the different methods used in the source studies.
The centile scores provided a measure of abnormal brain structure that revealed predictable patterns of change in the neuroanatomy with neurological and psychiatric illness. These centile scores were more likely to be heritable.
The study findings show that brain charts can now be generated that allow the normal rate and direction of change in brain images by MRI to be documented by age and sex. These also allowed new neurodevelopmental milestones to be recorded.
Moreover, these charts make it easier to identify the effects of genetic predispositions and early environment on the neuroanatomy of the brain. Finally, the charts help quantify the abnormalities of brain structure across a range of diseases by providing standardized effect sizes.
Much more work is needed to produce a more accurate and precise chart that is applicable to clinical practice; however, the present prototype is a proof of concept. The researchers of the current study provided a set of open-access resources for further studies based on this concept, taking advantage of available neuroimaging datasets and future results.
“Brain charts are an essential step towards robust quantification of individual variation benchmarked to normative trajectories in multiple, commonly used neuroimaging phenotypes.”
 Study identifies immune pathway driving long-term concussion damage