Scientists at the Australian National University (ANU) have comprehensively analyzed the genomes of Australian Indigenous communities and found a rich genetic diversity. Their study is published in the journal Nature.
Genetic structures of Australian Indigenous populations remain largely unknown because of the limited involvement of Indigenous peoples in genomic studies. Existing evidence suggests that Indigenous Australians are descendants of an early human dispersal into eastern Asia, probably representing one of the oldest continuous populations outside Africa.
Previous whole-genome sequencing study has found that the Indigenous people of New Guinea (Papuan) and Indigenous people of Australia diversified 25 – 40 thousand years ago and that divergence within Australia occurred 10 – 32 thousand years ago (ka). The study has further estimated that Indigenous Australians and Papuans diverged from Eurasians 51 – 72 Ka, following a single dispersal outside of Africa and subsequent admixture with archaic populations.
In the current study, scientists have analyzed the genomes of 159 Australians from four Indigenous communities residing in the Central Desert, Far North Queensland, and two islands off the coast of the Northern Territory. The study population included people who speak the Tiwi language, distinct from the most widespread Pama–Nyungan language.
As mentioned by the scientists, careful engagement and consultation with Indigenous leaders have made it possible to establish this extensive collection of Indigenous Australian genomes.
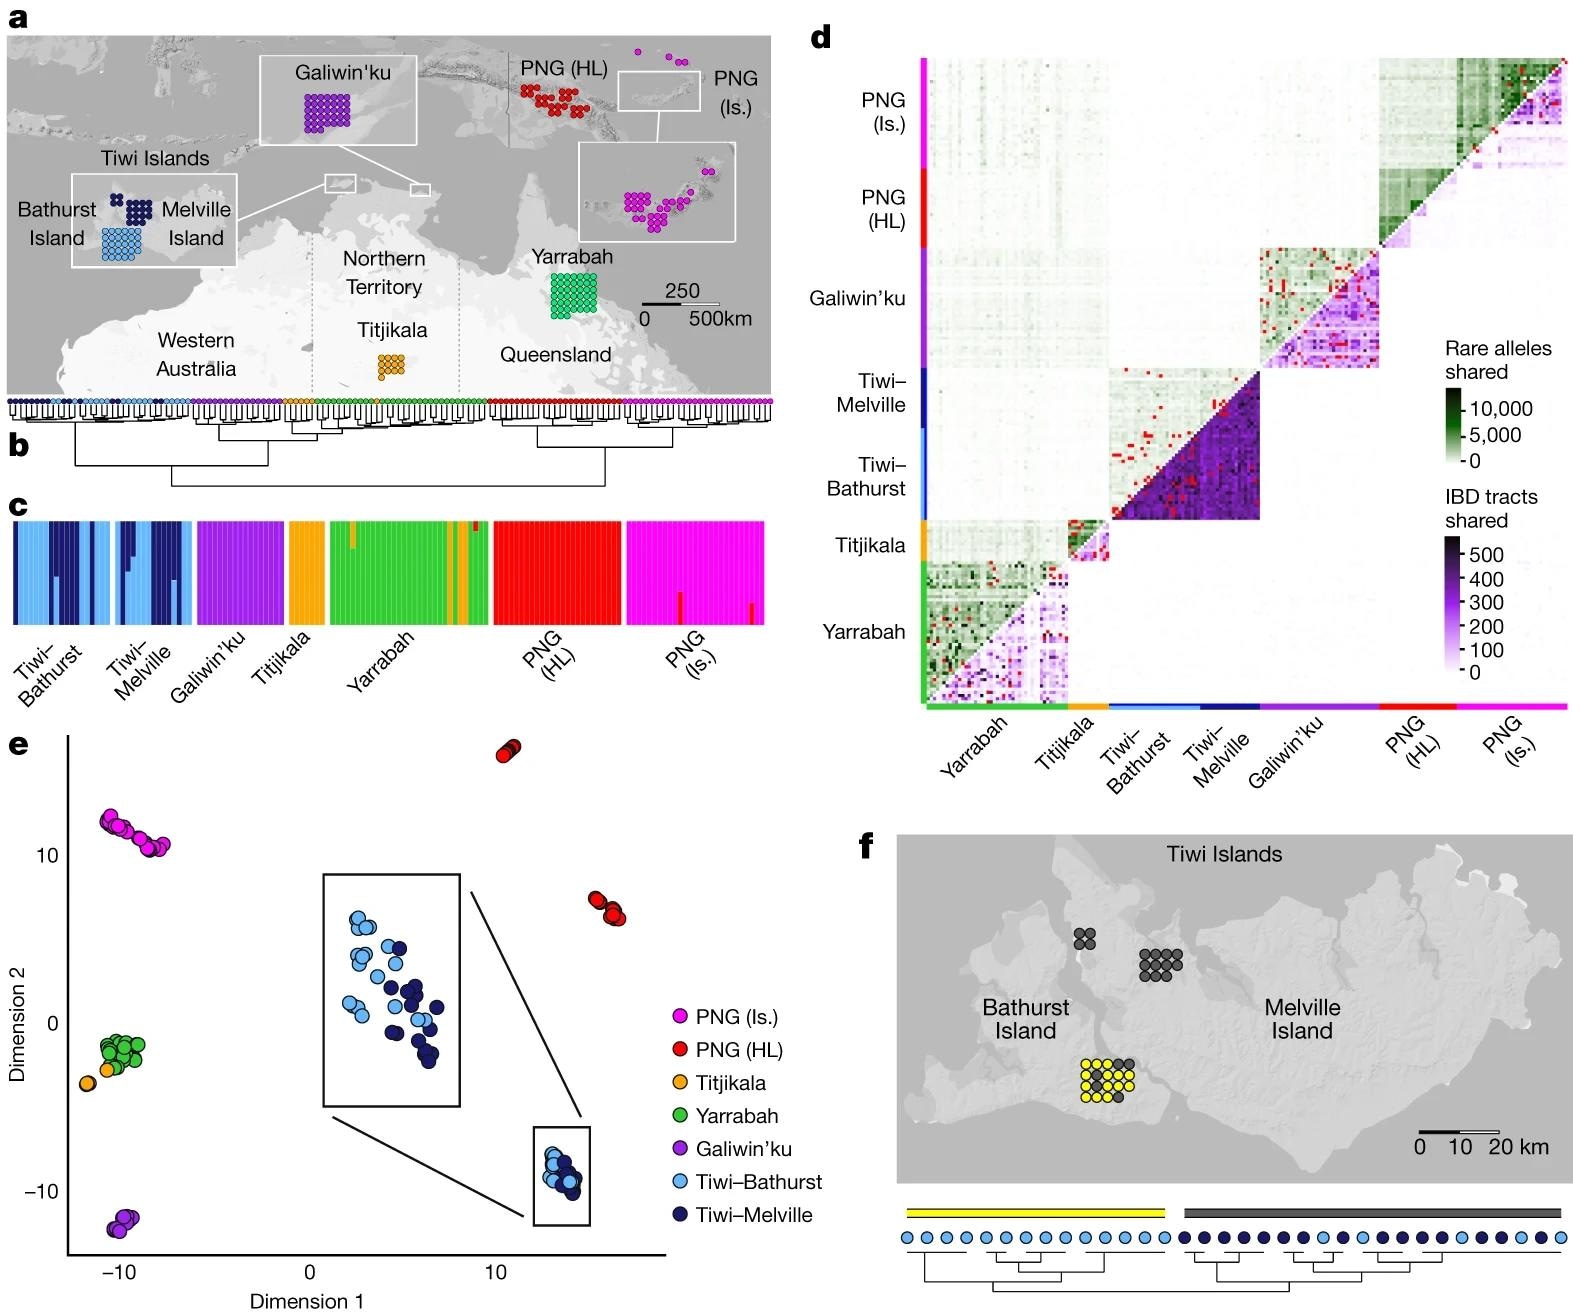 a, Location and sample size for all Australian and Papuan samples. b, Hierarchical clustering of unrelated individuals on the basis of pairwise outgroup F3 statistic values. Colour corresponds to sampling location. c, ADMIXTURE-inferred ancestry for unrelated individuals allowing seven clusters, ordered according to sampling location. Color was assigned to each cluster post hoc on the basis of the scheme in a and the majority membership of each cluster. d, Pairwise sharing of rare alleles (above diagonal) and IBD (below diagonal) tracts among all individuals. Counts were rescaled according to the proportion of the genome missing due to ancestry masking in each pairwise comparison. Comparisons between first- and second-degree relatives are indicated in red. e, UMAP clustering of unrelated individuals on the basis of minor allele frequency-corrected COV distances, reduced to the first ten components by MDS. Box expands the positions of Tiwi Island individuals. f, Clustering of Tiwi individuals on the basis of co-ancestry values estimated using fineSTRUCTURE run on all unrelated and unadmixed samples. Light blue (Bathurst Island) and dark blue (Melville Island) indicate sampling location, and yellow and grey indicate cluster membership.
Important observations
The scientists found strong genetic differences between Indigenous Australians living in the Tiwi Islands and Indigenous peoples living in the Australian desert. They found that the genetic structure of Tiwi speakers was developed from the ancestors of other Australian communities well before the physical separation of Tiwi islands by rising sea levels.
The non-uniform patterns of shared genetic drift showed that this early period was characterized by an extended period of stable interaction between the northern populations of Australia and Papua New Guinea, followed by a long-term genetic isolation, minimal migration, and strong fluctuation in effective population size ranging from very large at the end of the Last Glacial Maximum to small and stable over the past few thousand years.
As mentioned by the scientists, the demographic history of early separation from Papua New Guinea and Eurasian groups has led to the highest proportion of previously unidentified genetic variation observed outside Africa. Such demographic history has also generated the most extended homozygosity compared to global samples.
Specifically, the scientists identified more than 160,000 structural gene variants, with at least 300 structural variants in each individual that were unique to Indigenous Australians. These variants are responsible for most of the genetic differences between individuals and may be related to genetic diseases in some families.
A significant proportion of these variations were not observed in global reference panels or clinical datasets. The robust homozygosity of newly identified genetic variants specific to Indigenous Australians may falsely lead to them being prioritized as potentially pathogenic. This can influence any analyses that make decisions about variations in the absence of known functional consequences. This highlights the need to include individuals with diverse cultural and linguistic backgrounds in genomic studies.
As mentioned by the scientists, the discovery of genetic variations may explain why Indigenous Australians are more prone to develop certain chronic diseases, including kidney disease, diabetes, coronary disease, and cancer.
Medical practitioners so far rely on the genetic information of non-Indigenous populations for disease diagnosis and treatment of Indigenous populations, which often turns out to be inaccurate and ineffective. The establishment of this sizeable genetic dataset of Indigenous Australians has made it possible to develop personalized preventive and therapeutic interventions against a range of health conditions as well as rare genetic diseases.
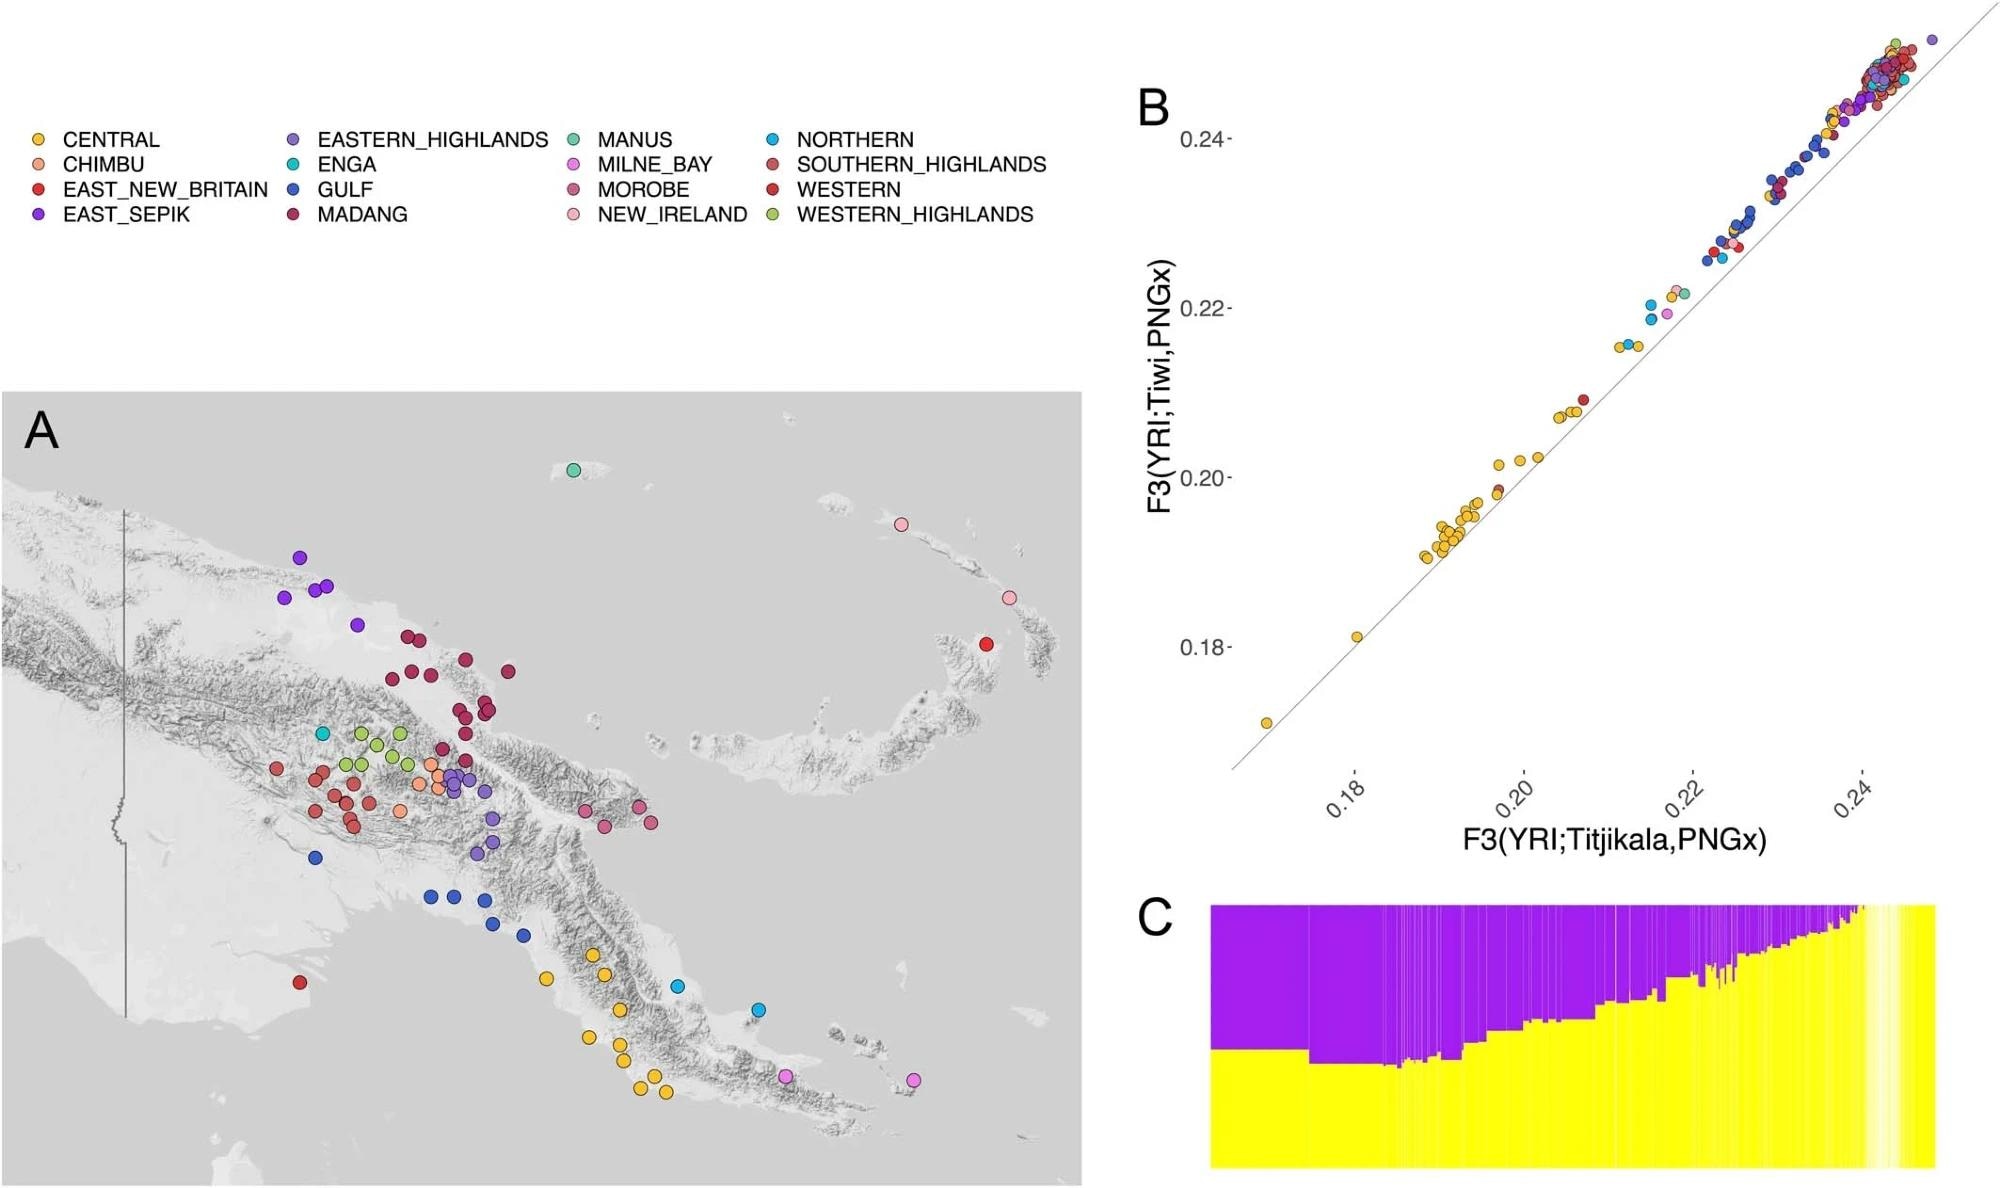 Map showing the locations of all populations sampled in the dataset of Bergstrom et al. (2017), with color code indicating the regional province. (Top Right) Scatterplot of values of outgroup F3 statistics of the form F3(Yoruba; Titjikala, PNG-X) versus F3(Yoruba; Tiwi, PNG-X), where ‘PNG-X’ is a PNG individual in the dataset described by Bergstrom et al. (2017). Colors represent the sampling location of the PNG individual (see map to the left). (Bottom Right) ADMIXTURE barplot showing putative PNG (yellow) and non-PNG (purple) global ancestry estimates for each of the individuals in the above scatterplot. Individuals in the barplot are shown in the same order left to right as in the scatterplot.
Study significance
The study finds that Indigenous Australians are not a single homogeneous genetic group. They share a non-uniform genetic relationship with the people of New Guinea. The study's findings can pave a new path toward developing novel personalized treatments that address health inequalities for Indigenous Australians.
 Genetic testing could sharply increase demand for ALS specialist care